Select a dataset
Every query in Explore starts with a dataset selection. Selecting the right dataset before running a query improves both the speed and relevance of your results.
Why your dataset selection matters
Use dataset selection for:
- Faster queries: Explore searches only within the datasets you select rather than across all your data, reducing query time and resource usage.
- Focused results: Results are scoped to the data type you are investigating, so logs queries return log events and spans queries return trace data, no noise from unrelated signal types.
- Access to internal data: System datasets expose Coralogix-managed metadata that is not part of your ingested data, such as alert history and audit events, without interfering with your application data.
How the selector works
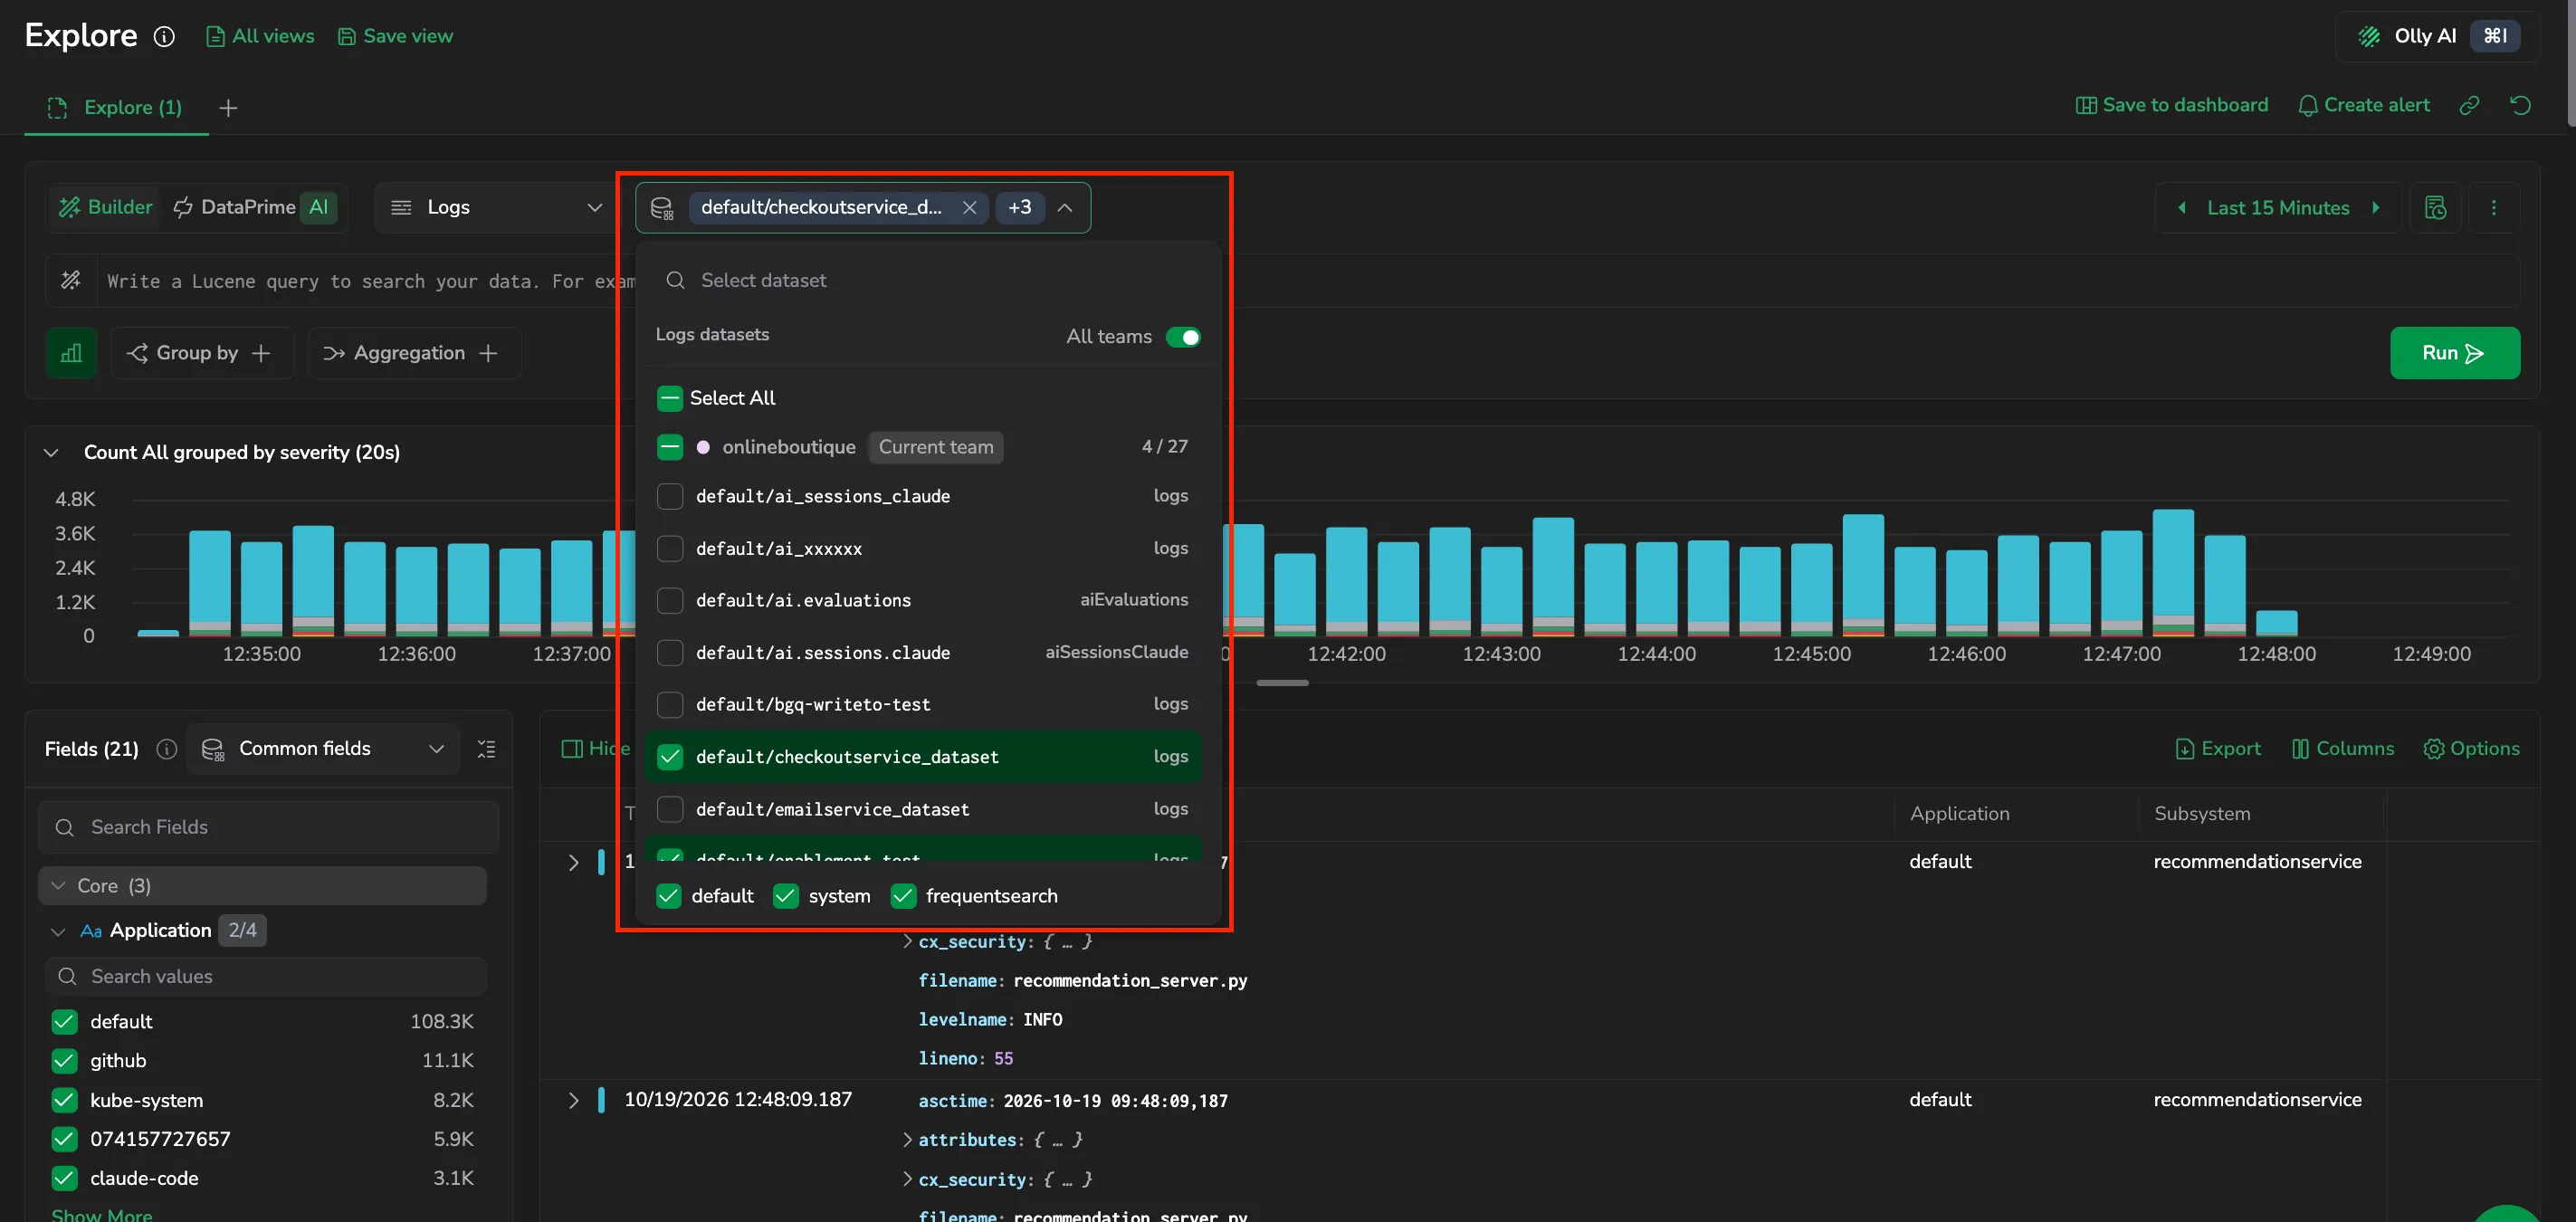
To the left of the dataset selector, the data-type selector sets which telemetry pillar you query, Logs, Spans, or JSON Data, and scopes the dropdown to datasets of that type. Each pillar has its own schema and guaranteed fields, so switching the data type resets the query and the column layout to that type's defaults (the time range is kept). Logs and Spans open on their default dataset (default/logs and default/spans); JSON Data holds non-time-driven data, such as aggregation results and lookup tables, and has no default dataset, so you pick the datasets yourself. See Entity types for how pillars and entity types work, and Schema Manager to manage the fields in each.

Open the dropdown to see the datasets available to you, searchable by name. Each row shows its <dataspace>/<dataset> name (for example, default/logs) and its entity type. The dataspace filters at the bottom narrow the list to default, system, or frequentsearch datasets (frequentsearch applies to logs and spans).
The selector is multi-select, and when you can access more than one team it groups datasets by team. See Query across teams.
Query more than one dataset
You can query several datasets at once, and datasets that belong to more than one team, from either Builder or DataPrime. Explore reads the whole selection in a single pass: it scans each dataset once and concatenates the records, so a comparison or roll-up across datasets is one query rather than a chain of separate ones.
In Builder mode
Select the datasets you want, including datasets from other teams, in the dataset selector. Explore turns your selection into a DataPrime source query across the chosen datasets, adding each dataset's team when it comes from another team, and runs it for you. Your selection travels in the Explore URL and is restored with the tab, so a reload or a shared link reopens the same datasets. If a field is indexed differently across the datasets you selected, Explore shows a performance warning.
In DataPrime
To read several datasets directly, switch to the DataPrime tab and list them as comma-separated sources:
source logs, spans, system/engine.queries
| filter $m.severity == 'Error'
| countby $l.applicationname
Every dataset in the list has to be in the same region, and one query can reference up to 128 sources. See source for the full syntax, including the teamId and version parameters.
What changes when you select multiple datasets
Selecting more than one dataset also changes the places that read your fields and keys, so they work across the whole selection:
- Fields panel: adds a view selector, Common fields / All datasets / a single dataset, and a coverage badge on each field showing how many of the selected datasets contain it. See Fields across multiple datasets.
- Columns management: the same view selector and coverage badges when you add columns, plus optional Dataset and Team columns. See Columns across multiple datasets.
- Manage keys: the Available keys list shows the same coverage, so you can tell whether a key exists in every selected dataset before you add it. See Keys across multiple datasets.
- Spans table: the same Columns and keys behavior applies, where the keys panel is Resource column keys. See Spans tables and flows.
In DataPrime mode, a query that reads from more than one source can't be filtered from the Fields panel, though value counts still load.
Query across teams
When you can access more than one team, you can query datasets from several teams in one query. In the dataset selector, the list groups datasets by team and marks your own team as the Current team. Each team header shows how many of its listed datasets are selected, with a select-all control for that team, and the All teams toggle adds the other teams to the list; it stays on while your selection includes another team's dataset. Explore lists and queries only the teams you belong to.
For a dataset that belongs to another team, Explore tags that source with its team, for example source logs(teamId='4000017'), frequentsearch/logs | ...; datasets from your own team stay untagged. See source for the teamId parameter.
Selecting more than one team also affects these places:
- Group by Team: add a Group by on Team to break results down per team. Explore groups by
teamId(), and the Overview tab shows one row per team. - Team column: add a Team column in the logs table to label each row with the team it came from. See Dataset and Team columns.
Dataspaces and datasets
Data in Coralogix is organized into dataspaces and datasets.
- A dataspace is a logical container that groups related datasets and applies shared configuration.
- A dataset is the actual data store within a dataspace. The records you query.
For example, logs is a dataset inside the default dataspace. In DataPrime you reference it as source default/logs (or simply source logs). In Builder mode, you just pick it from the dataset selector, no source clause appears in the Lucene query you type.
| Dataset | Dataspace | Entity type |
|---|---|---|
logs | default | Logs |
spans | default | Spans |
logs, spans | frequentsearch | Logs, Spans |
rum.events | default | Logs |
| User-defined datasets | default | Logs |
| System datasets | system | Various |
Predefined and custom datasets
The datasets available in the selector fall into four groups. Predefined and custom datasets match the Predefined and User values of the Managed by column in Dataset Management, and system datasets match its System tab.
logsandspans: Thedefaultdataspace'slogsandspansdatasets hold your ingested logs and traces. Their Frequent Search counterparts,frequentsearch/logsandfrequentsearch/spans, hold the data you assign to the High (Frequent Search) priority.- Predefined datasets: Datasets that Coralogix provisions in the
defaultdataspace for specific features, such asrum.eventsfor Real User Monitoring andops.eventsfor event markers. You don't create these: Coralogix defines their schema and entity type, and your data fills them. See Predefined datasets for the full list. - Custom datasets: User-defined datasets that you create under the
default/dataspace to isolate specific streams. You control the name, the routing policy that fills the dataset, and its access policy. - System datasets: Read-only system datasets in the
systemdataspace, which Coralogix maintains and fills with data about your account, such as alert history and audit events.
default is the name of a dataspace, not a synonym for "predefined." The default dataspace holds logs, spans, the predefined datasets, and any custom datasets you create, so a dataset under default/ can be any of these kinds.
/logs
The logs dataset is the default selection in the default dataspace. It contains your ingested log data and is the starting point for most log investigations.
When you select logs, you can query with Lucene or DataPrime, apply filters, group results, and visualize log distributions.
/spans
The spans dataset contains your distributed tracing data. Selecting spans lets you search traces, inspect spans, and drill into service dependencies.
rum.events
The rum.events dataset holds the Real User Monitoring events your browser SDK sends, such as page loads, user interactions, network requests, web vitals, and errors. Select it from the dataset selector to query RUM events with Lucene or DataPrime alongside your logs and spans.
Because RUM events are shaped differently from logs, Explore gives rum.events its own default grid columns: the timestamp, a User name column that resolves the first identity field the event carries (session_context.user_email, then session_context.user_id, then session_context.user_name), the event type (event_context.type), a Content column whose field depends on the event type, and the application.
The Content column shows a different field for each kind of RUM event:
| Event | Content field |
|---|---|
| Error | error_context.error_message |
| User interaction | interaction_context.resolved_name |
| Network request | network_request_context.fragments |
| Web vital | web_vitals_context.name |
| Resource | resource_context.name |
| Long task | longtask_context.duration |
| Log | log_context.message |
| Custom measurement | custom_measurement_context.name |
Events without a type-specific field fall back to event_context.source. You can customize the columns and Content keys like any other dataset. See Logs table.
View a RUM event in RUM Sessions
To jump from an event in Explore to the session it belongs to, select a field value in the rum.events grid to open the field context menu, then select View in RUM Sessions. Explore opens RUM Sessions in a new browser tab, filtered by the key:"value" you selected and scoped to the same time range.
JSON Data datasets
Some datasets hold JSON Data: non-time-driven records such as aggregation results, lookup tables, or exported summaries. A dataset takes the jsonData entity type, in the data pillar, when you write a DataPrime aggregation to it, such as countby or groupby, or when you create one to hold reference data. These records carry no $m.timestamp or $m.severity, so the time-over-graph view and other time-based features don't apply. Query them in DataPrime with source <dataset-name>. See Entity types for the full schema contract.
Frequent Search dataspace
frequentsearch is a dataspace, like default and system, not a dataset. It contains the logs and spans datasets that hold the data you assign to the High (Frequent Search) TCO Optimizer priority, indexed in hot storage (OpenSearch) for fast, interactive queries. You reference them as frequentsearch/logs and frequentsearch/spans. This is the fastest path for high-velocity, recent data. Select one from the dataset selector when you want quicker iteration over the most recent slice of your logs or spans. Query syntax, fields, and visualizations behave the same as default/logs and default/spans, with two differences:
- Span Relation filters are not supported on
frequentsearchdatasets. Explore clears them when you switch to or restore afrequentsearchdataset. - 10-second auto-refresh is exclusive to Frequent Search. The auto-refresh control in the time-range picker unlocks a 10-second interval only when a
frequentsearchdataset is active.
Which dataset Explore opens on
When you open Explore without naming a dataset, for example from the Logs link in the side navigation or from global search, Coralogix picks the dataspace for you based on one thing: whether your account has an archive configured.
- Archive configured: Explore opens on
default/logs, so your first query covers everything you have retained. - No archive configured: Explore opens on
frequentsearch/logs.
A dataset parameter in the URL always wins over this choice. See Deep links and URL parameters.
User-defined datasets
User-defined datasets are custom datasets you create under the default/ dataspace to isolate specific log streams. After creating a dataset in Dataset Management and routing logs to it via a TCO policy, the dataset is available in the Explore dataset selector.
Select a user-defined dataset from the dataset selector. In DataPrime, Explore references it as source default/<dataset-name>. You can then search, filter, and aggregate the data with Lucene or DataPrime.
See User-defined datasets for setup instructions.
What Explore shows for a custom dataset
A custom dataset appears in the selector alongside the predefined ones, labeled by its fully-qualified name and entity-type pill (for example, logs or jsonData). Query it directly with Lucene or DataPrime and add Group by and Aggregation clauses as needed. Custom datasets don't come with pre-built queries. You build the query yourself.
The result panel shows the Overview and Results tabs, plus the Templates view for logs datasets.
What else appears depends on the dataset's entity type:
- Timestamped datasets (for example, the
logsentity type): the dataset behaves likedefault/logs. The time-range picker is active, a time-series chart appears above the results, the Fields panel groups fields into categories such as Core and Kubernetes, and results show Timestamp, Content, Source, Application, and Subsystem columns. - Non-timestamped (not partitioned) datasets (for example, the
jsonDataentity type): the time-range picker is disabled, no chart appears, all fields fall under a single Other group, and each record renders in one Source column as JSON. See Non-timestamped datasets for the full behavior.
To inspect a single record, select its row to open the Log details panel, where you can read the record as Table, JSON, or Raw and jump to related logs and resources.
System datasets
System datasets are read-only datasets maintained by Coralogix. They contain internal observability data such as alert history, audit events, and limit violations.
| Dataset | Description |
|---|---|
system/aaa.audit_events | Audit trail of system activity for compliance and access monitoring. |
system/alerts.history | History of alert evaluations and trigger events. |
system/engine.queries | Record of user queries for introspection and optimization. |
system/engine.schema_fields | Field-level schema snapshots over time. |
system/labs.limitViolations | Records of configured limit violations. |
system/notification.deliveries | Lifecycle of outbound alert notifications. |
system/dataplan.quota_events | Quota-related events: allocations, consumption, and threshold breaches. |
system/dataplan.usage_events | Aggregated team data usage events. |
System datasets must be enabled before they can be queried. Navigate to Data Flow, then Dataset Management to enable or disable them.
Non-timestamped (not partitioned) datasets
Some datasets (such as jsonData summary datasets) do not include a timestamp field, so they are not partitioned by time. See Dataspaces and datasets for the dataset model and Entity types for how time partitioning works.
When you select a non-timestamped dataset:
- The time range picker is disabled and shows the tooltip The selected dataset is not partitioned by time.
- Auto-refresh is force-cleared.
- No time-series chart appears above the results.
- The Visualize as selector is locked to Table until you add a Grouped by clause.
Spans dataset views
The spans datasets (default/spans and frequentsearch/spans) carry distributed tracing data. Custom datasets currently support the logs pillar only, so there are no user-defined spans datasets. When you select a spans dataset, the result panel adds trace-focused views (such as Traces, Flows, and Signals (which includes RED metrics)) alongside the standard result views. The active view is captured in the URL, so saved views and shared links reopen the same view.
Next steps
Review the role-based and policy-based permissions required to use Explore in Explore permissions.