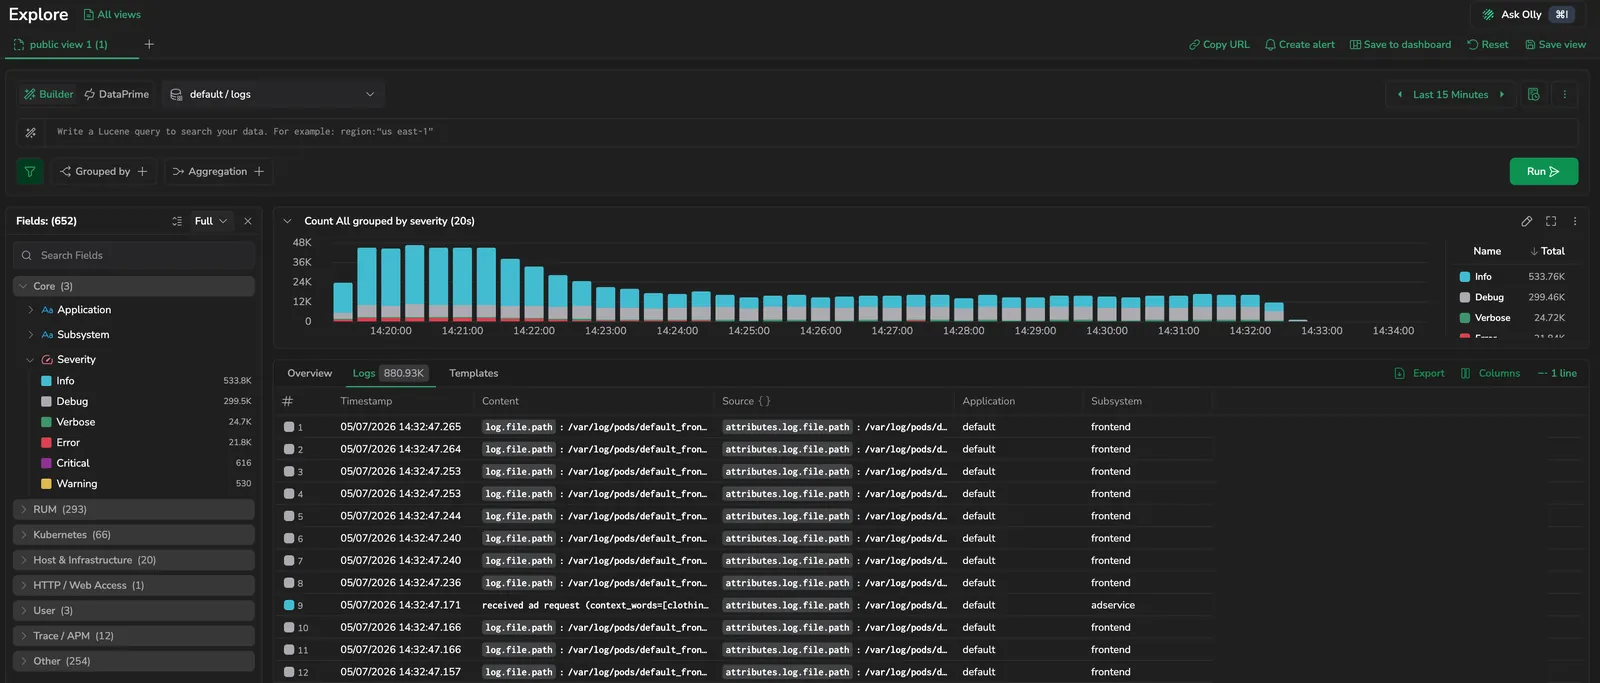
Fields for logs
The Fields side bar on the left of Explore logs lists every field detected on the logs matching your current query, grouped into named sections. Sections make the side bar navigable when a source carries hundreds of fields, and let you find the right filter without knowing the exact attribute path.
The side bar stays in sync with the query builder. When you add a field-value pair from the side bar, it appears in the query bar; when you edit the query bar, the side bar reflects what is applied.
The Fields panel is available in both Builder and DataPrime modes. Selecting a value in DataPrime mode updates the DataPrime query with the equivalent filter clause, so you can discover and apply filters without knowing the exact field path.
Favorites
Favorites sits above the sections and is always expanded. Pin any field to Favorites from its more actions menu to keep it at the top of the side bar for quick access. Favorites are stored per source and dataset, so each investigation surface keeps its own shortlist.
Core
Core is the first section below Favorites and is expanded by default. It lists the identifiers you filter on most often, in a fixed order:
| Field | Description |
|---|---|
| Application | Filters by the Coralogix application label. |
| Subsystem | Filters by the Coralogix subsystem label. |
| Severity | Restricts to one of Debug, Verbose, Info, Warning, Error, or Critical. |
Other Core identifiers detected on your logs are listed below the three above, sorted alphabetically.
Fields by section
Below Core, the side bar groups every other field into named sections by domain. Sections start collapsed — select the section header to expand it. Within each section, fields are sorted alphabetically.
| Section | What it covers |
|---|---|
| RUM | Real User Monitoring fields captured by the browser SDK, such as session and view attributes. |
| Kubernetes | Container, pod, node, and workload attributes. |
| Host & Infrastructure | Host, cloud, and infrastructure attributes from resource detectors. |
| HTTP / Web Access | Request, response, and access-log attributes. |
| GeoIP | Country, region, city, and coordinates derived from client IP. |
| User | User identity, session, and account attributes. |
| Trace / APM | Trace, span, and service context linking a log to its APM signal. |
| Other | Any field that does not match one of the sections above. |
Sections that have no matching fields in the current results are hidden.
Expand and collapse
Each entry in the side bar supports expand and collapse:
- The whole list, to focus on a single section.
- Each section, to browse its fields.
- Each field, to inspect its values.
Your last expand/collapse state is remembered per source and dataset.
Search the side bar
Use the search box at the top of the side bar to find a field by name when many attributes are present. Search matches against the field key — matched fields appear under their section, and any collapsed section that contains a match auto-expands so the result is visible.
Field actions
Expand a field to see its top values with a count beside each. Counts update dynamically as you apply other filters elsewhere in the side bar or query bar. For the full list of per-field actions — value checkboxes and Only, Search values, Show more, Add as a column, Copy path, Show distribution, Group by — see Fields sidebar actions on the Logs table page.
Next steps
Inspect a single log event in depth in the Log details panel.