Search logs and spans
Use the Lucene-powered search bar in Explore to find the exact logs and spans you need. Builder mode supports two input styles (a visual chip builder and a Lucene editor) and you can switch to the DataPrime syntax for advanced pipelines. As you search, Explore keeps your query, filters, and UI actions aligned so you can refine results without rebuilding your work.
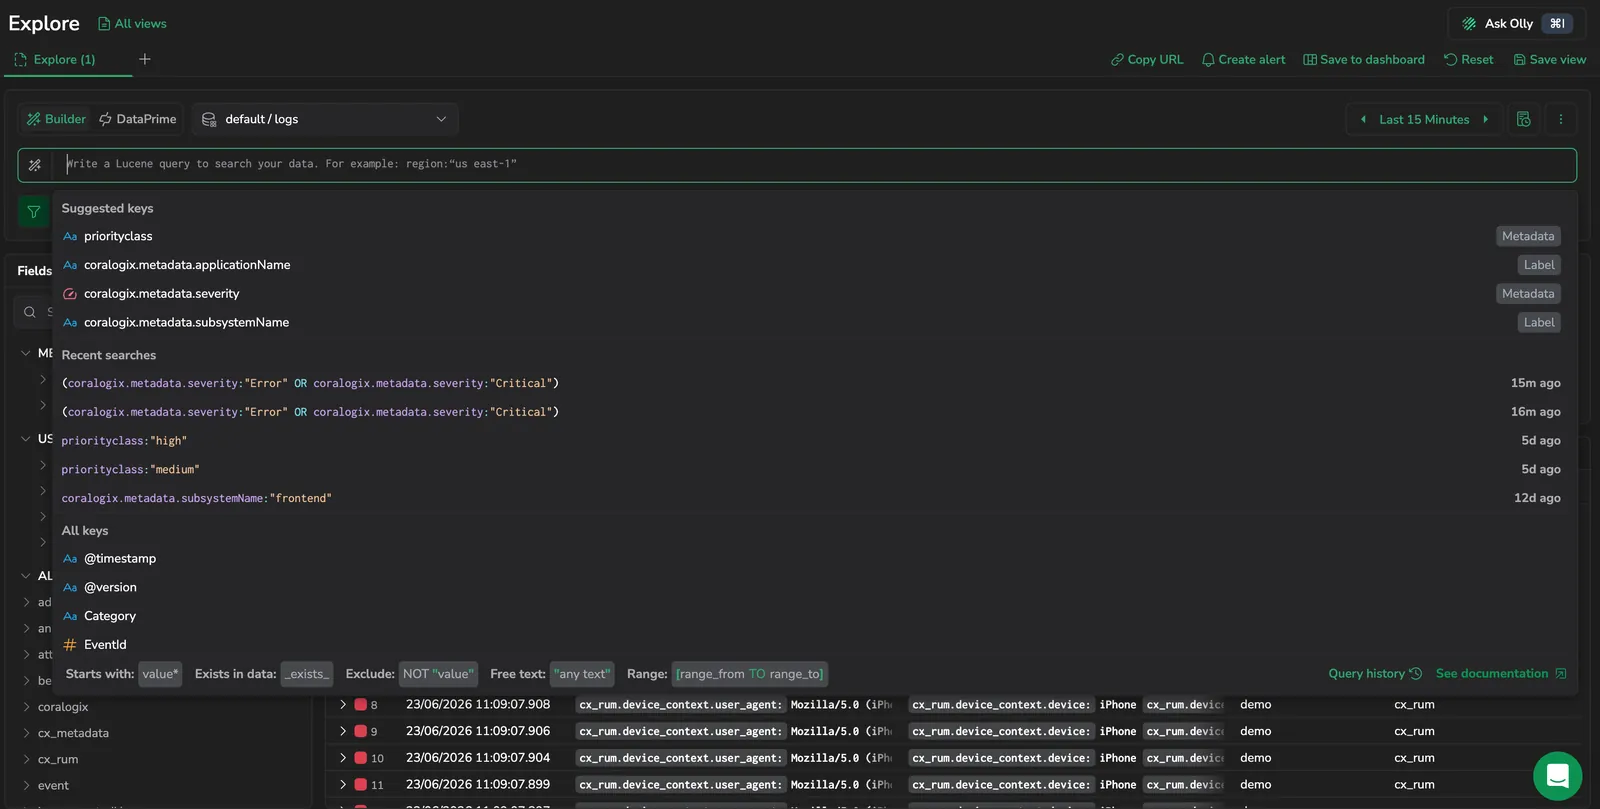 Search bar with autocomplete showing suggested keys, recent searches, and syntax helpers
Before you begin
- Select the dataset you want as your query data source.
- Set the time range.
Your dataset and time range apply to every search you run until you change them.
Select the dataset
Use the dataset selector to choose the dataset you want to search (for example, a logs or spans dataset).
What happens when you change datasets:
- Explore keeps compatible selections when possible (same field name and type).
- Explore removes incompatible filters and selections.
- If the dataset has no data in the selected time range, you see an empty state. Expand the time range or adjust filters.
Set the time range
Use the time range control to define the window for your search (for example, Last 15 minutes, Last 24 hours, or a custom range).
You can also:
- Change the time range at any time. Results refresh to match your new selection.
- In time-series charts, highlight a segment of the chart to update the selected time range to that interval. This is useful when you spot a spike and want to zoom in.
Build your search query
In Builder mode the search bar offers two input styles that compile to the same Lucene query:
- Lucene editor: type the Lucene expression directly.
- Chip builder: build the query visually using chips for field, operator, and value.
Toggle between the two with the small icon next to the search bar. Switching keeps your query intact.
While the Lucene editor holds a query, three actions appear at its right edge:
- Format query: tidies the query in place, for example removing extra whitespace and writing
key: valueaskey:value. The result matches how the chip builder writes the same query. Undo reverts it in one step. - Copy query: copies the query text to the clipboard.
- Clear query: empties the editor.
If you instead switch the top-level syntax to DataPrime, the editor reseeds with source <dataset> or a translated form of your Lucene query. Switching back to Builder restores your Lucene query if you haven't edited the DataPrime. If you have edited it, Explore translates simple DataPrime queries back to Builder, and opens a "Please note" dialog only when a query is too complex to translate, where you can Cancel, Open Lucene in new tab, or Discard query. See Switch back to the query builder.
Chips join with either AND or OR. Toggle the operator with the button above the chip row. To mix AND and OR or to group with parentheses, switch to the Lucene editor and write the expression directly, for example (severity:error AND service:web) OR severity:fatal.
Use autocomplete while you type
When you place your cursor in the search bar, Explore opens an autocomplete panel that helps you build the query faster and more accurately.
The panel includes:
- Suggested keys: commonly used fields for the selected dataset.
- Recent searches: previously run searches you can reuse.
- All keys: the full set of searchable fields in the selected dataset.
As you build a clause, Explore guides you through the next step. For example, after you select a field, it prompts you to choose a value. After you complete a clause, it prompts you to choose what comes next, such as adding AND, OR, or NOT.
Tips for working quickly:
- Use the arrow keys to move through suggestions, then press
Enterto accept the highlighted suggestion. - Press
Enterinside the Lucene editor to run the query, unless you've moved into the suggestion list, whereEnteraccepts the highlighted suggestion. The query stays on one line: line breaks you paste or enter withShift+Enterbecome spaces.
Use common operators
The autocomplete panel also provides operator patterns you can apply as you build queries, including:
- Starts with
- Exists in data (for example,
_exists_) - Exclude (for example,
NOT) - Free text
- Range (for example,
[range_from TO range_to])
Use quotes for values that include spaces.
Run the search
Select Run to execute the search. In Builder mode, Run stays enabled even when the query is invalid, in both input styles, the chip builder and the Lucene editor. If you select Run, or press Enter, on an invalid query, Explore sends no request and outlines the query bar in red to mark the problem. A tooltip on Run gives the reason, which is the parser's own error message when it has one.
An incomplete chip is outlined on its own instead of the whole query bar, and the tooltip names what's missing:
- Aggregation chip: a function with no field to aggregate over. The tooltip reads
Invalid query - select a field for the aggregation function. - Relation chip (spans datasets): a relation filter with no field or no value. Only root needs neither, so it never counts as incomplete. The tooltip reads
Invalid query - select a field and a value for the relation filter.
Your next edit clears the error, and Explore never marks an error while you're still typing. Warnings don't block a run; only errors do.
In Builder mode the query auto-submits after edits that produce a complete, valid query, for example, applying a chip-builder clause or accepting an autocomplete suggestion. Free-text typing in the Lucene editor is staged but not auto-submitted, so you can still write multi-clause queries without partial runs. Edits that leave the query invalid are never auto-submitted either, and that silent path paints nothing: the red error state appears only when you select Run or press Enter yourself. DataPrime is excluded from auto-submit (partial DataPrime queries would error out). Select Run, or use the Cmd+Enter / Ctrl+Enter / Shift+Enter keyboard shortcut, to run a DataPrime query.
After the search runs, results appear in the grid.
Pause a running query
While a query is running, the Run button becomes Pause. Select Pause to stop execution mid-run, in both Builder and DataPrime. Pausing stops every part of the query at once: the results grid, the results count, and the chart. Field value counts in the Fields panel load separately, so expanding a field doesn't switch Run to Pause, and pausing doesn't cancel the counts. Your query is left unchanged, so if no results returned yet, the grid shows a Query paused state with a Run query action, and you can run it again or edit it first. Pausing one Explore tab doesn't affect queries running in other tabs.
You don't have to pause before changing your mind. Submitting again while a query is still running replaces the running query with the one you just submitted, so an edit you make mid-run takes effect instead of being dropped.
Review results
The data grid is your default view for inspecting individual logs, spans, and traces.
Common actions:
- Select a row to open the info panel.
- Use Columns to add fields so you can compare values across many logs without opening each one.
- Sort by a column to quickly find outliers (for example, the highest value in a numeric field).
Highlighted query matches
When your search matches on text, Explore highlights the matched terms in the log results so you can see at a glance why each row came back. Highlights appear in the log content in the results grid, including the expanded row, in both light and dark mode. They update each time you run a search, based on the query you submitted.
Explore highlights:
- Free-text terms and text field filters (for example,
message:pods). - Add to filter (contains) matches and other substring filters, including wildcards. A wildcard widens the highlight across the rest of the matched token and stops at delimiters, so
*kube*highlightskubeinkube-controller-manager, not the whole value. - Quoted phrases, highlighted word by word.
- DataPrime text predicates, including the
~,~~, and==operators,contains()andstartsWith(), andwildfind/find.
Explore doesn't highlight:
- Label and metadata fields (for example, application name, subsystem name, and severity). Every row in the result matches these identically, so highlighting them would add noise rather than signal.
- Field-presence filters (
_exists_), numeric ranges, and any negated (NOT) clause. - The log details panel, which stays plain.
Matching is case insensitive. A plain term marks its exact characters wherever they appear, so alert highlights the alert inside alertId as well as the standalone word Alert. Wildcards are the exception: a wildcard widens the highlight only to the surrounding token and stops at delimiters.
Inspect a log in the info panel
When you select a log row, the info panel opens and shows details for the selected log. Use it to review the log's fields and drill into the full record.
From the info panel, you can:
- Search within the log details
- Use field-level actions to refine your investigation (for example, include or exclude a value in the query)
Find out more in Log details panel.
Check the distribution of a field from the table
When you want to understand how values are distributed for a specific field, open the context menu for a field value in the table and select Group by.
Explore opens a chart drilldown panel grouped by the selected field. Use this view to spot the most common values and pivot your investigation to a specific subset.
Examples
coralogix.metadata.severity:"Error"
_exists_:cx_rum.page_context.page_fragments
cx_rum.page_context.page_fragments:"alerts/{id}"
Next steps
Group, count, and compare results across any field with the Query builder.