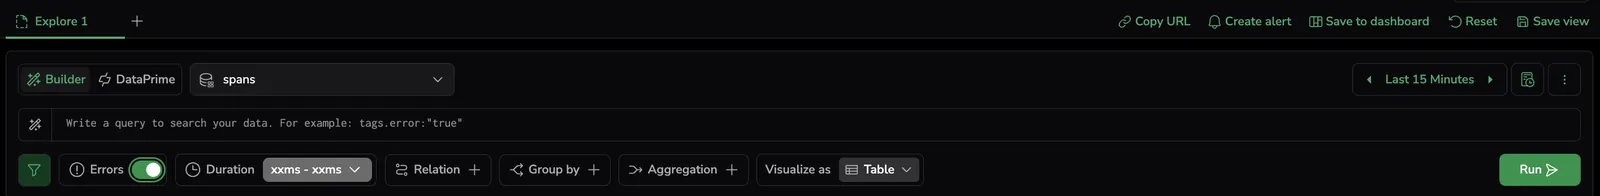
Query builder for spans
The Spans and Traces tabs of Explore spans extend the standard Coralogix query builder with three controls tailored to span data: error filters, duration filters, and span-relationship filters. All three apply to the active tab and stay in sync with your search, Group by, and aggregation choices.
Toggling the Errors filter or selecting Apply on Duration runs the query automatically—the results table and the count chart above it update in place.
For the shared building blocks—search bar, Lucene and DataPrime modes, Group by, Aggregation, and drilling down into grouped results—see the main Query builder doc.
Filter by error
Use the Errors toggle to narrow results to spans or traces that include an error.
- In the Spans tab, the toggle shows only spans whose status indicates an error.
- In the Traces tab, it shows traces that contain at least one error span.
Combine the error toggle with a service or operation filter to jump straight to failing executions without rewriting your query.
Filter by duration
Use the Duration control to isolate slow operations.
- In the Spans tab, filter by span duration. Trace duration is not currently supported.
- Enter a minimum and maximum in milliseconds, or choose a percentile (
p25,p50,p75,p95,p99). For example,p95shows only spans slower than 95% of all spans in the current result set. - Select Apply to execute the filter—this triggers an automatic query run.
The duration filter applies to the active tab and updates the results table and the count chart above it simultaneously.
Filter by span relationships
Use relational filters to find spans based on their position within a trace. Relational filters are available in all tabs of the spans dataset when the Monitoring, Archived, or S3 data tier is selected. You can add multiple relation filters at once and combine them with AND or OR — except for Only root, which can be added once because it restricts the entire result set and applying it more than once would have no additional effect.
- Go to Relation, then select Add relation filter.
- Choose a relation type.
- In Field, pick a span attribute or tag — for example,
service.nameorhttp.status_code. - Choose an operator — Equals (default) or Not equals.
- Select one or more values.
- Select Run to apply the filter.
| Relation type | What it filters | When to use |
|---|---|---|
| Root | Spans that are root spans in the trace (span.parent_id == null) and also match the specified field and value condition. | Use when you want to investigate how a request started. |
| Only root | Restricts the result set to root spans only, without requiring a field or value condition. | Use to get a clean view of entry-point requests without child-span noise. |
| Parent | Spans that have child spans matching the condition. | Use when you suspect a downstream operation is causing the issue and want to find the span that triggered it. |
| Entry service | Spans that represent the entry point of a service (span.kind == SERVER) — the first span created when a service handles a request. | Use to focus on inbound traffic to a specific service. |
| Child | Child spans that match the condition. | Use to trace an issue back up to its origin — find the parent by looking at what its children are doing. |
| Any | Traces that contain another span matching the condition. If you add more than one Any filter, every filter must match the same span. | Use when you know something went wrong somewhere in the trace but don't know exactly where — for example, finding all traces that contain a slow database span, regardless of its position in the trace. |
| Not any | Traces that do not contain another span matching the condition. | Use when you want to filter out known patterns and focus on what's left — for example, excluding all traces that contain a specific service or operation to narrow down to unexpected behavior. |
The builder generates the matching DataPrime relational query automatically. Switch to DataPrime at any time to inspect or edit the generated syntax — start with the visual builder and switch to DataPrime when you need more precise control, without losing your work.
Up to two different relationship types can be included in a query, across both filters and Group by. For example, you can't filter on both Root and Any and also group by a Parent relationship. There is no limit on the number of filters per relationship type. For more on relational query behavior, see Relational queries.
Relation filters flow through to the Highlights tab — its graph and field distribution analyze the relationally-filtered span set. When Compare to previous period is on, both windows honor the filter, so regression analysis stays scoped to the same relationships as the Spans and Traces tabs.
Examples
End-to-end queries that combine the controls above with the shared builder primitives.
- Tab: Spans.
- Search:
db.system:*. - Duration:
500ms–∞, orp95. - Group by:
db.operation. - Aggregation:
count.
Result: a grouped list of DB operations with counts, sorted by frequency — helping you identify which query type is slowest.
DataPrime equivalent:
source spans
| filter db.system != null
| filter $m.duration > 500000000
| groupby db.operation
| aggregate count() as span_count
- Tab: Spans.
- Search:
coralogix.metadata.serviceName:"checkout-service". - Errors toggle: on.
Result: every error span produced by the checkout service in the active time range.
- Tab: Spans.
- Search:
coralogix.metadata.serviceName:"checkout-service". - Errors toggle: on.
- Duration:
> p95.
Result: the slowest 5% of error spans in the checkout service — useful for tail-latency error investigation.
- Tab: Traces.
- Errors toggle: on.
- Any relation filter:
service.name = checkout-service.
Result: all traces that contain at least one error span in the checkout service.
- Tab: Spans.
- Only root relation filter (no field or value condition needed).
Result: only the entry-point spans for each trace, with all child spans removed from the view.
Span events
Span events — exceptions, logs attached to a span, or other structured events recorded during instrumentation to capture what happened at a specific point in a span's execution — are queryable through DataPrime when you need to filter or aggregate across them, and surface in the trace view for at-a-glance inspection. This is especially useful when investigating recurring exceptions or errors across many spans at once.
Query events with DataPrime
Span events live as a logs array on each span and aren't exposed in the Query builder controls. To filter, count, or aggregate spans by an event-level attribute — for example, exception.type or exception.message — open Explore, switch the search bar from Builder to DataPrime mode, and use explode to flatten $d.logs into one row per event.
Despite the field name, logs contains span events — not application logs.
How explode works
The explode command expands an array field into individual rows so each element can be queried separately. Applied to span events, it takes the logs array on a span and creates a new row per event, letting you filter, count, and aggregate on event-level fields like exception.type and exception.message.
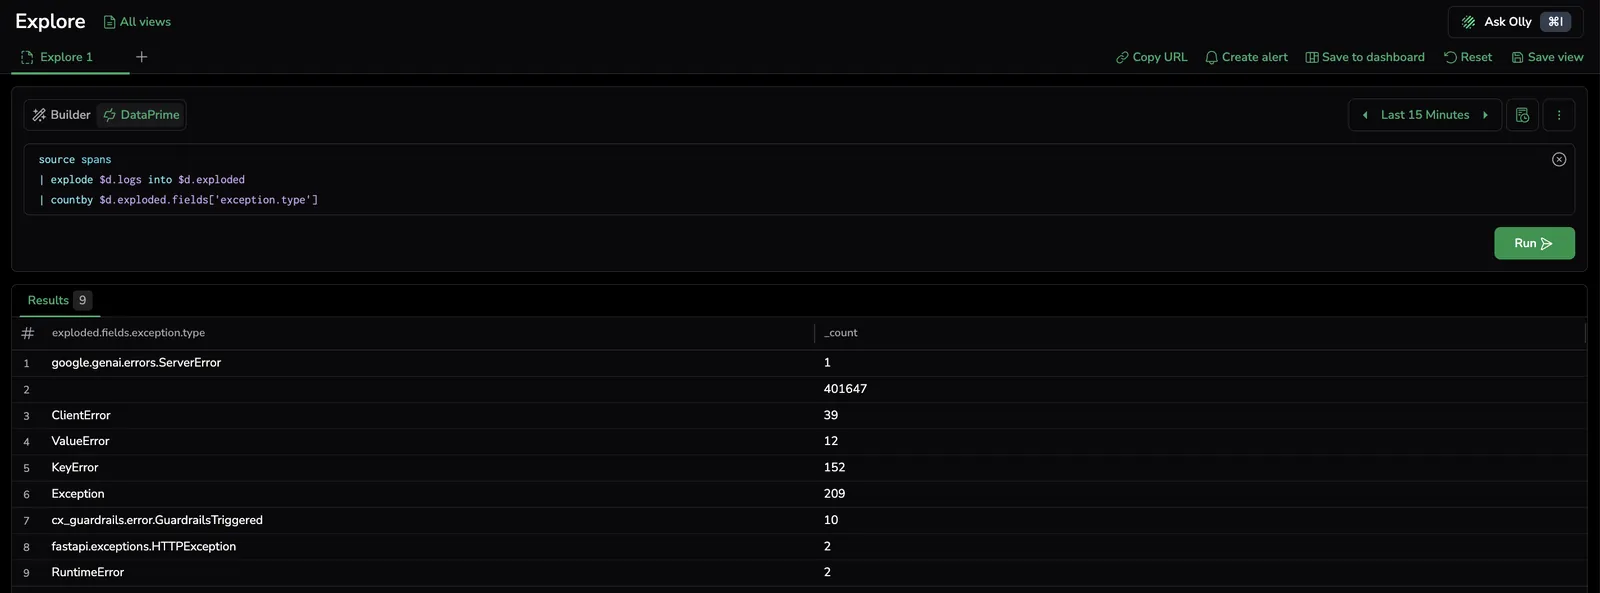
Explore query bar in DataPrime mode, running an explode $d.logs query against the spans dataset.
Use this pattern when you want to:
- Count or rank events by an event-level attribute (for example, the most common exception types across spans).
- Filter spans whose events match a condition while preserving the original span fields.
- Find every span that contains a specific event type — for example, every span that recorded an exception.
Count exceptions by type:
source spans
| explode $d.logs into $d.exploded
| countby $d.exploded.fields['exception.type']
The result is a count of span events grouped by exception.type — useful for quickly identifying the most common errors across your spans.
Find spans whose events include a specific exception type:
source spans
| explode $d.logs into $d.exploded original preserve
| filter $d.exploded.fields['exception.type'] == 'GraphQLError'
| remove exploded
original preserve keeps the original span fields on each new row, so the result returns the spans (not just the events) that contain a matching event. remove exploded drops the per-event payload before the spans are returned. Use this when you want to identify which spans — not which events — are affected by a specific exception type.
View events in the Gantt, Info panel, and Related data
- Gantt view: spans that carry events show a small marker on the right edge of their bar, visible without selecting the span. Use this to quickly identify which spans recorded exceptions or events without opening each one individually. See Visualize spans and traces.
- Info panel: selecting a span opens the Events section in the Info panel, with each event listed by timestamp. Expand an entry to see its attributes — for example,
event,level,code.filepath,code.lineno,code.namespace, and any custom fields attached to that event. See Span fields and attributes. - Related data: the Events tab in the Related data drawer surfaces the same per-span events when you open the drilldown from the Gantt or results table. See Span related data.
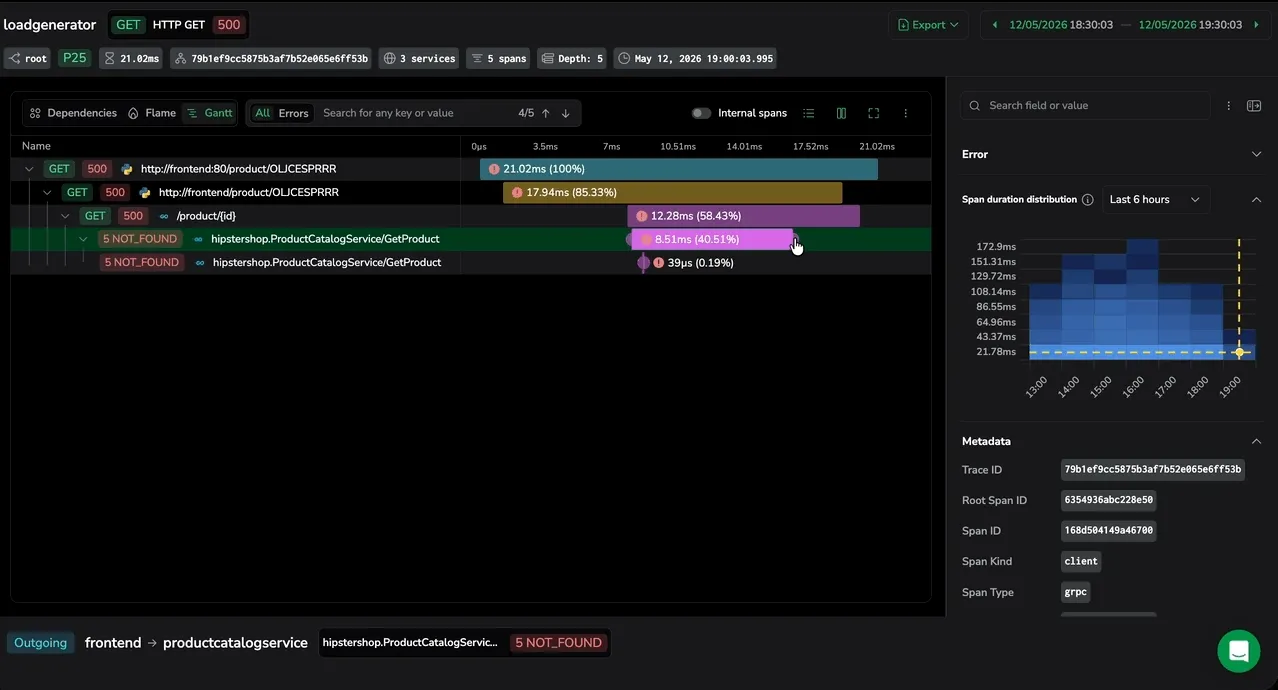
Gantt span bar with the event marker visible, the Info panel Events section with an expanded entry, and Events in the Related data drawer.
Next steps
Browse and configure the span fields available in your query in Fields for spans.