Spans, Traces, and Flows
The results area of Explore spans has three tabs—Spans, Traces, and Flows. Spans and Traces render your query as a table. Flows renders the same data as an interactive service map. The active query and time range apply to every tab, so you can switch between them without losing context.
Choose a view
| Tab | What you see |
|---|---|
| Spans (default) | One row per span. Use this tab to find a specific operation that explains a symptom. |
| Traces | One row per trace. Use this tab to compare end-to-end requests. |
| Flows | Service map of the traces in the current query. Use this tab to understand how services communicate. |
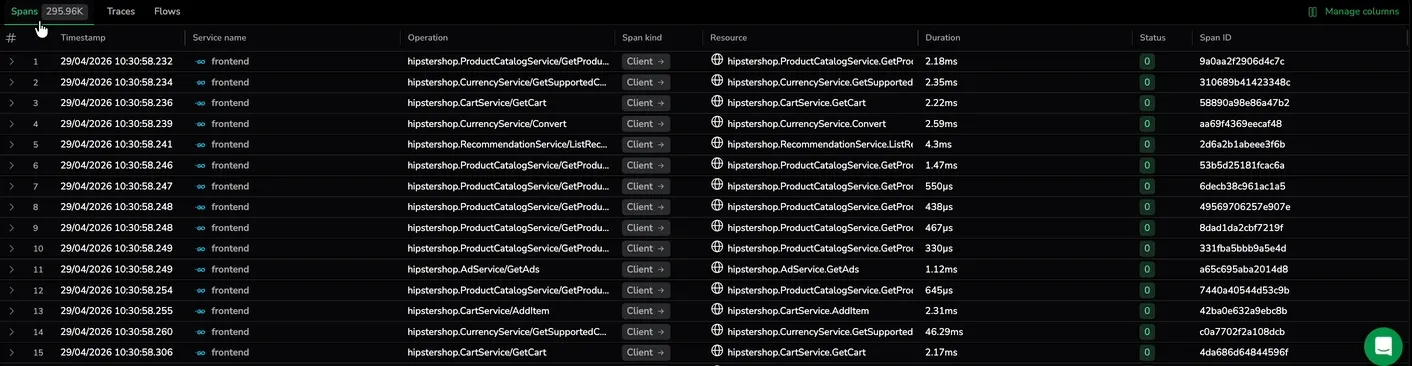
Spans tab
The Spans tab lists the spans that match the active query, sorted by timestamp.
Columns
| Column | Description |
|---|---|
| Timestamp | When the span began. |
| Service name | The service that produced the span. The icon reflects the SDK language (telemetry.sdk.language). |
| Operation | Operation name—for example, Lambda.Invoke or index.continuous_data_.... |
| Span kind | SERVER, CLIENT, PRODUCER, CONSUMER, or INTERNAL, with a directional arrow. See Span kind. |
| Resource | Human-readable resource label derived from span attributes. See Resource column — configurable display keys. |
| Duration | Span duration in ms or a larger unit. |
| Status | Error status—color-coded when applicable, or a dash when the span has no status. See Error. |
| Span ID | Unique identifier for the span. |
Traces tab
The Traces tab lists one row per trace. Columns are aggregated at the trace level, and all fields and tags shown for a trace come from its root span.
Columns
| Column | Description |
|---|---|
| Timestamp | The earliest span start time in the trace (typically the root span). |
| Root service name | The service that initiated the trace. |
| Operation | Operation name of the root span. |
| Resource | Human-readable resource label for the root span. |
| Span count | Number of spans in the trace. |
| Errors | Spans marked as errors. |
| Duration | End-to-end duration from root-span start to root-span end. Hover the cell to see a per-service trace duration breakdown—for example, Cumulative span duration: 211.17ms shows the sum of all span durations within the trace. |
| Trace ID | Unique identifier for the trace. |
The Span count, Errors, and Duration columns reflect the entire trace, independent of the query time range. Even when your selected time range covers only part of a trace, these columns report the trace's true totals—so you can identify large or long-running traces before you open them. See Investigate large and long-running traces.
Resource column — configurable display keys
The Resource column (present in both the Spans and Traces tabs) displays a human-readable label derived from span attributes. By default, Coralogix selects the most informative attribute available for each span based on its span type.
You can customize which span attributes are used as the Resource column from the Resource Column displayed values panel—similar to the Content column configuration in Logs.
Default field priority by span type:
| # | Span type | Fields | Example |
|---|---|---|---|
| 1 | HTTP | http.method, http.route, http.target, http.url, http.request.method | GET /checkout |
| 2 | RUM | cx_rum.network_request_context.url | https://app.store.com/cart |
| 3 | gRPC / RPC | rpc.service, rpc.method | CartService.GetCart |
| 4 | GraphQL | graphql.operation.type, graphql.operation.name | query getCart |
| 5 | GenAI | gen_ai.operation.name, gen_ai.system, gen_ai.request.model, gen_ai.usage.total_tokens | chat.completions (gpt-4o) |
| 6 | Messaging | messaging.system, messaging.operation, messaging.destination.name | kafka publish orders-topic |
| 7 | Database | db.system, db.operation, db.operation.name, db.namespace, db.name | SELECT users |
| 8 | Object Storage | object_storage.operation, object_storage.bucket, object_storage.service | s3 PUT user-uploads |
| 9 | Serverless / FaaS | faas.name, faas.trigger | http processOrder |
| 10 | Spark / Airflow / DBT | dbt.model, dbt.project, airflow.dag_id, spark.job.id | airflow etl-pipeline |
| 11 | Network | net.peer.name, net.peer.port, network.protocol.name, network.transport | api.stripe.com:443 |
| 12 | Runtime | process.runtime.name | node.js v18 |
| 13 | Checkly | checkly.check.name | checkout-flow-check |
| 14 | CloudEvents | cloudevents.event_type, cloudevents.event_source | com.store.order.created |
Error
The Error column is color-coded so you can scan for failures. A dash (-) means no status was recorded. When multiple status types exist on the same span—for example, both http.status_code and otel.status_code—Coralogix prioritizes them in the order: HTTP → gRPC → OpenTelemetry span status.
HTTP (http.response.status_code, http.status_code):
- Green—2xx success
- Yellow—1xx informational, 3xx redirect, or some 4xx client-side responses
- Red—4xx and 5xx server errors
gRPC (rpc.grpc.status_code):
- Green—
OK(0) - Yellow—client-related errors:
CANCELLED,INVALID_ARGUMENT,NOT_FOUND,ALREADY_EXISTS,PERMISSION_DENIED,FAILED_PRECONDITION,ABORTED,OUT_OF_RANGE,UNAUTHENTICATED - Red—server-side failures:
UNKNOWN,DEADLINE_EXCEEDED,RESOURCE_EXHAUSTED,UNIMPLEMENTED,INTERNAL,UNAVAILABLE,DATA_LOSS
OpenTelemetry span status (otel.status_code):
- Green—
OK - Yellow—
UNSET(no explicit status recorded) - Red—
ERROR
Span kind
The Span kind column (Spans tab) shows the OpenTelemetry span kind along with a directional arrow indicating call direction. Span kind is set by the instrumentation library and cannot be changed after ingestion.
| Kind | Arrow | Meaning |
|---|---|---|
SERVER | ← | Handles an inbound request into this service. |
CLIENT | → | Makes an outbound request to another service. |
PRODUCER | → | Publishes a message to a queue, broker, or topic. |
CONSUMER | ← | Receives and processes a message from a queue or broker. |
INTERNAL | — | Performs in-process work (no direction). |
Columns
Add, remove, reorder, and reset columns to customize the Spans or Traces table.
- Select Columns in the table header.
- Search for a field by name or browse the list.
- Select the field to add it as a column.
- Drag the field to reorder it.
- Select Apply or close the panel to save changes.
In the Spans tab you manage span attributes. In the Traces tab you manage trace-aggregated metrics such as service count and total duration. Column values in the Traces tab are sourced from each trace's root span.
Reset column layout
In Columns, select Reset to default to restore the original columns.
Sort columns
The default sort order is by timestamp, newest first. Select a column header to sort by that column. Select again to reverse the order. An indicator shows the active sort column and direction.
Export
Use Export in the table header to download the current result set. The Spans tab exports per-span fields and runs against the backend. The Traces tab exports trace-summary fields, sourced from each trace's root span, for the rows already loaded into the grid.
For supported formats, row caps, and file-name rules, see Export data.
Row actions
Open the more actions menu for row-level actions.
| Action | What it does |
|---|---|
| Copy span | Copies the full span payload to the clipboard. |
| Copy trace ID | Copies the trace ID for the current row. |
| Show trace | Opens the full trace that contains the selected span. |
| Show surrounding similar spans | Expands a submenu to find nearby spans similar by service or operation. Pick a timeframe to scope the search. |
| Copy permalink | Copies a link to the selected span. Opening the link reopens that span in Explore, so you can share it with a teammate or paste it into an incident ticket. |
| Export span JSON | Downloads the selected span as <spanId>.json. |
| Export root span JSON | Downloads the trace's root span as <traceId>-root.json. |
| Export trace CSV | Downloads every span in the trace as <traceId>.csv, with nested attributes flattened into dotted columns. Capped at 50,000 spans per trace. |
Messages you might see during a trace CSV export:
Exporting trace CSV…while Coralogix builds the trace CSV.This trace has no spans to export.when the trace is empty.This trace has no root span to export.when no root span exists.
Selecting a row anywhere outside the more actions menu opens the drilldown drawer.
Add a span to Olly context
Send a specific span to Olly when you want to ask about that exact operation instead of the full query result. The action lives in a right-pinned column in the spans table. The column has no header, and the button appears only when you hover the row.
- Hover the span row you want to send to Olly. The Olly icon appears at the right edge of the row.
- Select Add to Olly context.
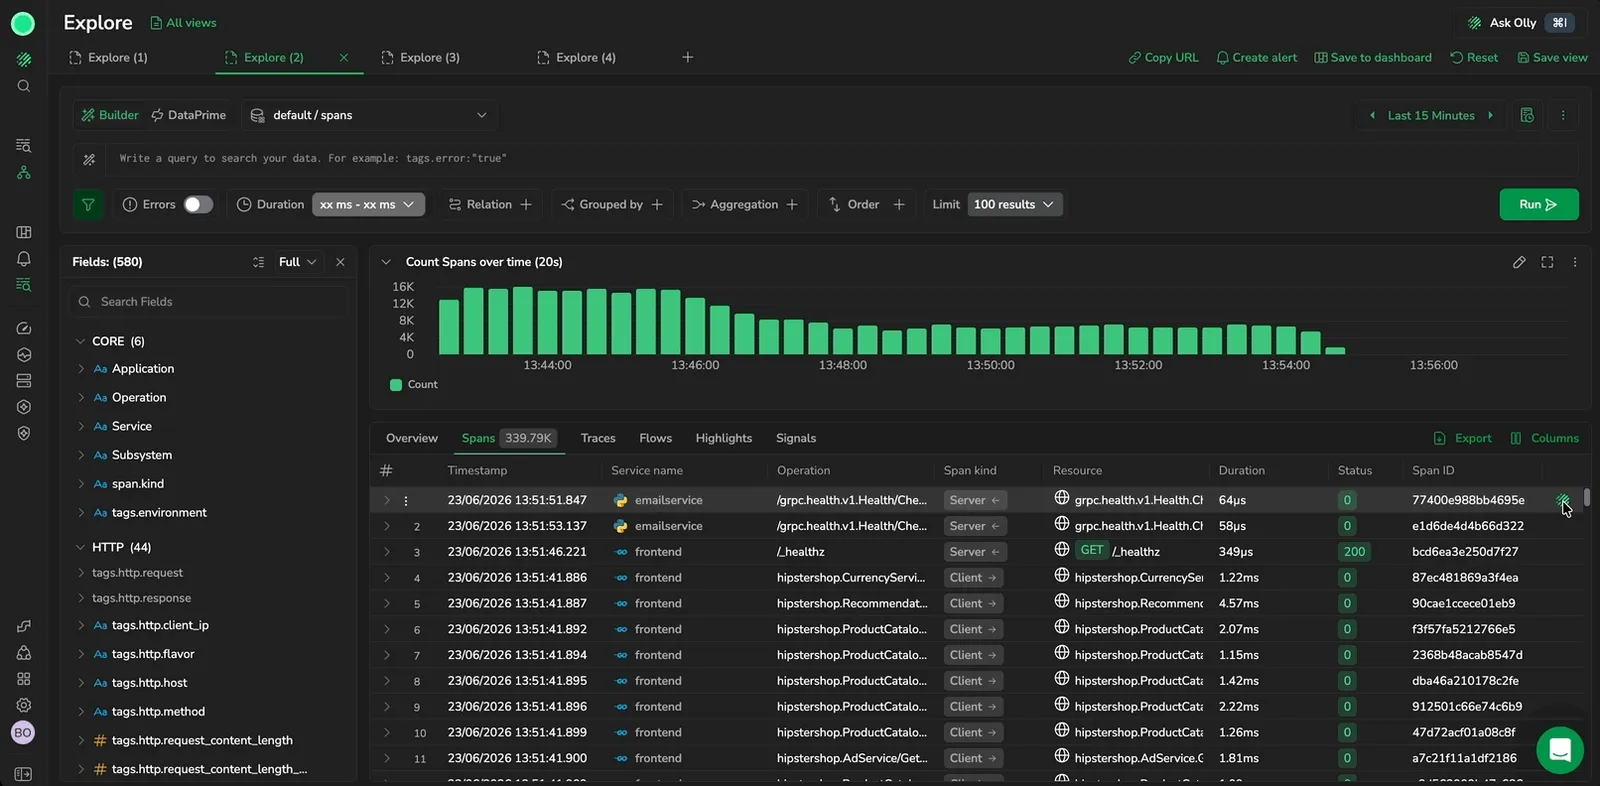
Olly opens in a drawer with the span already attached as a data-context chip — labelled with the span's start time, with an entity icon, and a tooltip that reads Span: <timestamp>. Add more rows by hovering other spans and selecting the same action; each one becomes its own chip. See Page and data context for chip behavior and removal.
The Olly column stays pinned to the end of the table and isn't part of the column layout — you can't move it, hide it from Manage columns, or include it in a saved view. The button doesn't appear on rows where the span has no resolvable ID.
Cell and key actions
Select any value in the table to open the cell action menu.
| Action | What it does |
|---|---|
| Custom Actions | Opens a submenu listing every action that matches the selected value. Use the search box or the All / Private / Shared tabs to find an action, then select it to open the destination URL in a new tab. Select Manage actions at the bottom to create or edit actions. See Custom actions. |
| Include in query | Adds the field-value pair as an inclusion filter on the current query. |
| Exclude from query | Adds the field-value pair as an exclusion filter on the current query. |
| Copy path | Copies the full field path, including parent keys. |
| Copy value to the clipboard | Copies the value. |
| Copy key | Copies the field name. |
| Value across time | Opens a time-series chart of the selected value over the active time range. Use this to quickly identify if a value is anomalous compared to its historical pattern. |
Flows tab
Flows renders the traces in your current query as an interactive service map. The map behavior—nodes, edges, hover metrics, depth control, filters, pan, and zoom—mirrors the Analyze tab in Service Catalog. See that doc for the full reference.
A node count indicator at the top of the map shows how many nodes are visible based on the active filters. Use the minimap in the corner to navigate large service maps without losing context.
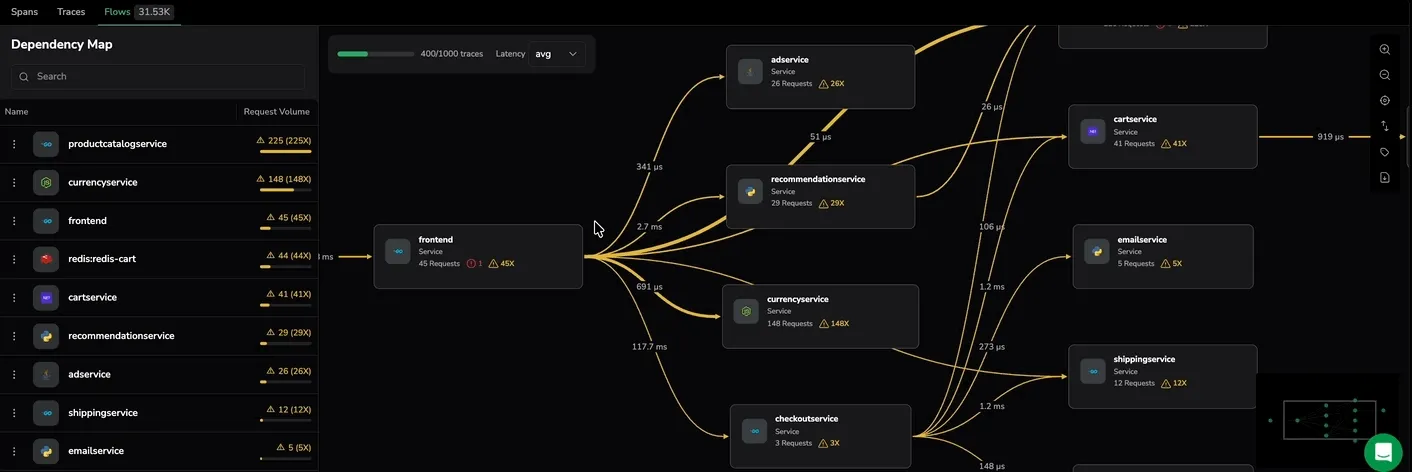
Behaviors unique to the Flows tab in Explore spans:
- Query-scoped map: the map aggregates every trace that matches the active query and time range, not a single service in the catalog.
- Cross-tab drilldown: selecting a node filters the Spans and Traces tabs to the traces that pass through that node, so you can jump from the map straight to the underlying rows.
- Errors toggle: filter the map to error paths only.
- Duration filter: narrow the map to slow operations.
- Refine with filters: use the side bar filters or the Errors toggle and Duration filter in the query builder to narrow the traces feeding the service map.
Next steps
Break the spans matching your query down by field in the Highlights tab.