Trace structure indicators
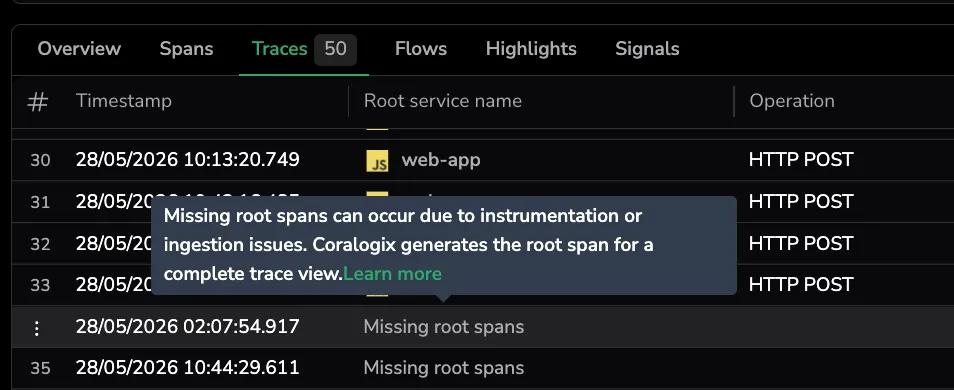
In the Traces tab of Explore spans, each row represents a single trace and the Root service name column shows the service that initiated the trace—the service that emitted the trace's root span. When a trace doesn't have exactly one root span, or hasn't fully arrived yet, Coralogix can't show a normal service name. Instead, the Root service name column renders a placeholder that names the condition and offers a tooltip with a link back to this page.
You see these placeholders only in the Traces tab. The Spans tab, the Flows tab, and the Logs grid aren't affected.
For a refresher on what a root span is and how it relates to the rest of the trace, see Understanding traces and spans.
Where the indicators appear
The Root service name column in the Traces tab sources its value from the trace's root span. When Coralogix can identify a single root span, the column shows the root service name and icon as usual. When it can't, the column shows one of three indicators.
| Indicator | When you see it |
|---|---|
| Incomplete trace | The trace started less than 5 minutes ago and is still being ingested, or it stayed flagged as incomplete after that window closed. |
| Missing root spans | The trace is older than 5 minutes and has no root span. |
| Multiple root spans | The trace is older than 5 minutes and has more than one root span. |
Coralogix synthesizes a root span so the trace remains explorable end-to-end. The placeholder tells you that what you're seeing was reconstructed, so you can adjust your interpretation accordingly and—if the condition is recurring—investigate the instrumentation side.
How the indicator is chosen
Coralogix picks one of the three placeholders by running this check, in order:
- If the trace started less than 5 minutes ago, the row shows Incomplete trace. Spans haven't all necessarily arrived yet — the trace is still being ingested and the row will update in place as more data lands.
- Otherwise, if the trace has no root span, the row shows Missing root spans.
- Otherwise, if the trace has more than one root span, the row shows Multiple root spans.
- Otherwise, the row falls through to Incomplete trace — a trace older than 5 minutes that has exactly one root span but is still flagged as incomplete. This usually signals an instrumentation, sampling, or transport problem rather than a transient ingestion delay.
The 5-minute threshold means Missing root spans and Multiple root spans are never transient. If you see them, the trace is already past the ingestion window — they reflect a persistent condition that won't resolve on its own.
Missing root spans
The Root service name column shows the placeholder Missing root spans when the trace is older than 5 minutes and Coralogix can't find a root span for it. Hovering the placeholder shows:
Missing root spans can occur due to instrumentation or ingestion issues. Coralogix generates the root span for a complete trace view.
This condition is persistent — the 5-minute threshold means the trace has already passed the ingestion window. If you see it repeatedly for traces from the same service or call path, treat it as an instrumentation or transport issue. See What to check on the instrumentation side.
Where to start investigating
Open the Spans tab to see which spans were received for this trace. This helps you confirm whether the root span was simply never emitted by the entry service, or whether it was emitted but dropped on the way to Coralogix.
Common causes
A trace ends up without a root span when the service that started the request didn't emit (or didn't deliver) the corresponding span. Likely causes to investigate:
- Instrumentation gap on the entry service. The first service in the request chain isn't instrumented, or the instrumentation library doesn't emit a span for the inbound request.
- Broken trace context propagation. The downstream services were instrumented and emitted spans, but the trace context from the entry service was missing or malformed, so they look like orphans without a parent.
- Ingestion loss. The root span was emitted but never reached Coralogix—for example, a transient network failure between the OpenTelemetry Collector and Coralogix, or the entry service shut down before the span flushed.
Multiple root spans
The Root service name column shows the placeholder Multiple root spans when the trace is older than 5 minutes and Coralogix detects more than one root span for it. Hovering the placeholder shows:
Multiple root spans can occur due to instrumentation or ingestion issues. Coralogix generates the root span for a complete trace.
Like Missing root spans, this condition is persistent — the 5-minute threshold means the second (or third) root span isn't going to disappear.
Where to start investigating
Open the Spans tab and scan the spans Coralogix received under this trace ID. Check whether the trace ID appears in spans from unrelated services — if so, Trace ID reuse or collision is the most likely cause and you should start with the producer that's emitting the same ID across services.
Common causes
A trace ends up with more than one root span when several spans appear to start the same trace independently. Likely causes to investigate:
- Trace ID reuse or collision. Two unrelated requests emit spans under the same trace ID, so Coralogix receives spans from both as if they belonged to one trace.
- Lost parent references. A service deeper in the chain emits spans without a parent span ID, so they look like independent entry points instead of children of the real root.
- Duplicate instrumentation on the entry service. An entry service has two instrumentation paths active at once (for example, an SDK and an automatic agent), and both emit spans for the same inbound request.
Incomplete trace
The Root service name column shows the placeholder Incomplete trace in two distinct situations. Hovering the placeholder shows the same tooltip in both cases:
Trace is in progress or partially ingested. Spans may be missing or change as more data arrives.
The right reaction depends on which situation applies — and the difference comes down to how long ago the trace started.
Recent traces (less than 5 minutes old)
If the trace started less than 5 minutes ago, this is the normal in-progress state. Spans are still flowing in from your services or the OpenTelemetry Collector, and what you see in the row is whatever has arrived so far. As more spans land, the row updates in place — including the Root service name, once the root span comes through.
What to do: most traces complete ingestion within a few seconds. Wait briefly and reopen the trace. If the Incomplete trace indicator persists for more than 30–60 seconds on the same row, investigate the ingestion pipeline instead of waiting longer. Coralogix continues to treat the trace as in-progress for a full 5 minutes before flipping it to one of the other indicators—but in healthy systems you shouldn't need to wait that long.
Common reasons spans arrive late:
- The originating request is still running. Long-lived requests (background jobs, queue consumers, streaming responses) keep emitting spans for the duration of the work.
- Batch flush in progress. OpenTelemetry exporters typically batch spans; the early spans of a trace can be queryable before the later spans flush.
- Cross-region ingestion lag. Spans from a less-active region or a less-active collector arrive after the rest of the trace.
Traces older than 5 minutes (fallback state)
If the trace started more than 5 minutes ago and still shows Incomplete trace, the ingestion window is closed but Coralogix has determined the trace is still incomplete despite having exactly one root span. This usually points at something on the producer side:
- Sampling configuration. A head-based or tail-based sampler may be dropping part of the trace's spans before they're exported. Check the sampling rules configured on the application SDK or on the OpenTelemetry Collector.
- Producer-side or device-side loss. A misconfigured exporter, a crash in the originating process, or transport drops between the application and the Collector can leave a trace with its root span but without the rest of its spans.
What to do: treat this the same way as Missing root spans or Multiple root spans — the trace is unlikely to fix itself. Walk through the instrumentation checks below, paying particular attention to sampling and Collector-side drops.
What to check on the instrumentation side
Missing root spans, Multiple root spans, and Incomplete trace rows for traces older than 5 minutes are usually instrumentation, sampling, or transport conditions — not transient noise. If you see them repeatedly for traces from the same service or call path:
- Confirm the entry service is instrumented. The first service in the chain (the one that receives the inbound request) needs to emit a span. For an OpenTelemetry SDK, that usually means the auto-instrumentation for the inbound framework (HTTP, gRPC, messaging) is enabled and running.
- Verify trace context propagation across service boundaries. Downstream services need the incoming
traceparent/tracestateheaders (or the equivalent for the propagator in use) to attach their spans to the right trace. Missing headers produce orphan spans; mismatched propagators produce broken traces. For background, see the OpenTelemetry tracing concepts. - Check for double instrumentation. If a service runs both an SDK and an automatic agent, turn one off to avoid duplicate or competing root spans.
- Review your sampling configuration. Head-based or tail-based samplers that drop part of a trace's spans can leave behind a root span without its children, or stray children without their root.
- Look at the Collector side. Drops between the application and the Collector, or between the Collector and Coralogix, can leave traces without their root span. Check the Collector exporter queue metrics and any retry or drop counters.
Related resources
- Understanding traces and spans
- Spans, Traces, and Flows
- Span drilldown
- OpenTelemetry getting started guide