Identify uninstrumented services
Not every service in a request emits telemetry. A service appears as uninstrumented in the dependency map when Coralogix has no spans from it, even though other services in the trace call it. This happens in two distinct situations: the service has no OpenTelemetry instrumentation at all, or it's instrumented but its telemetry never reaches Coralogix. Either way, the service still took part in the request but has no spans of its own to represent it.
Rather than drop these services and show a broken call path, the Dependencies view reconstructs them from the spans of the instrumented services around them and marks them as uninstrumented. This keeps architectural blind spots visible instead of silently missing from the investigation.
How an uninstrumented service appears
Uninstrumented services appear in the Dependencies view's Service view. They're inferred from the spans of instrumented services that reference them, so you can see where a request went even when the destination emits nothing itself.
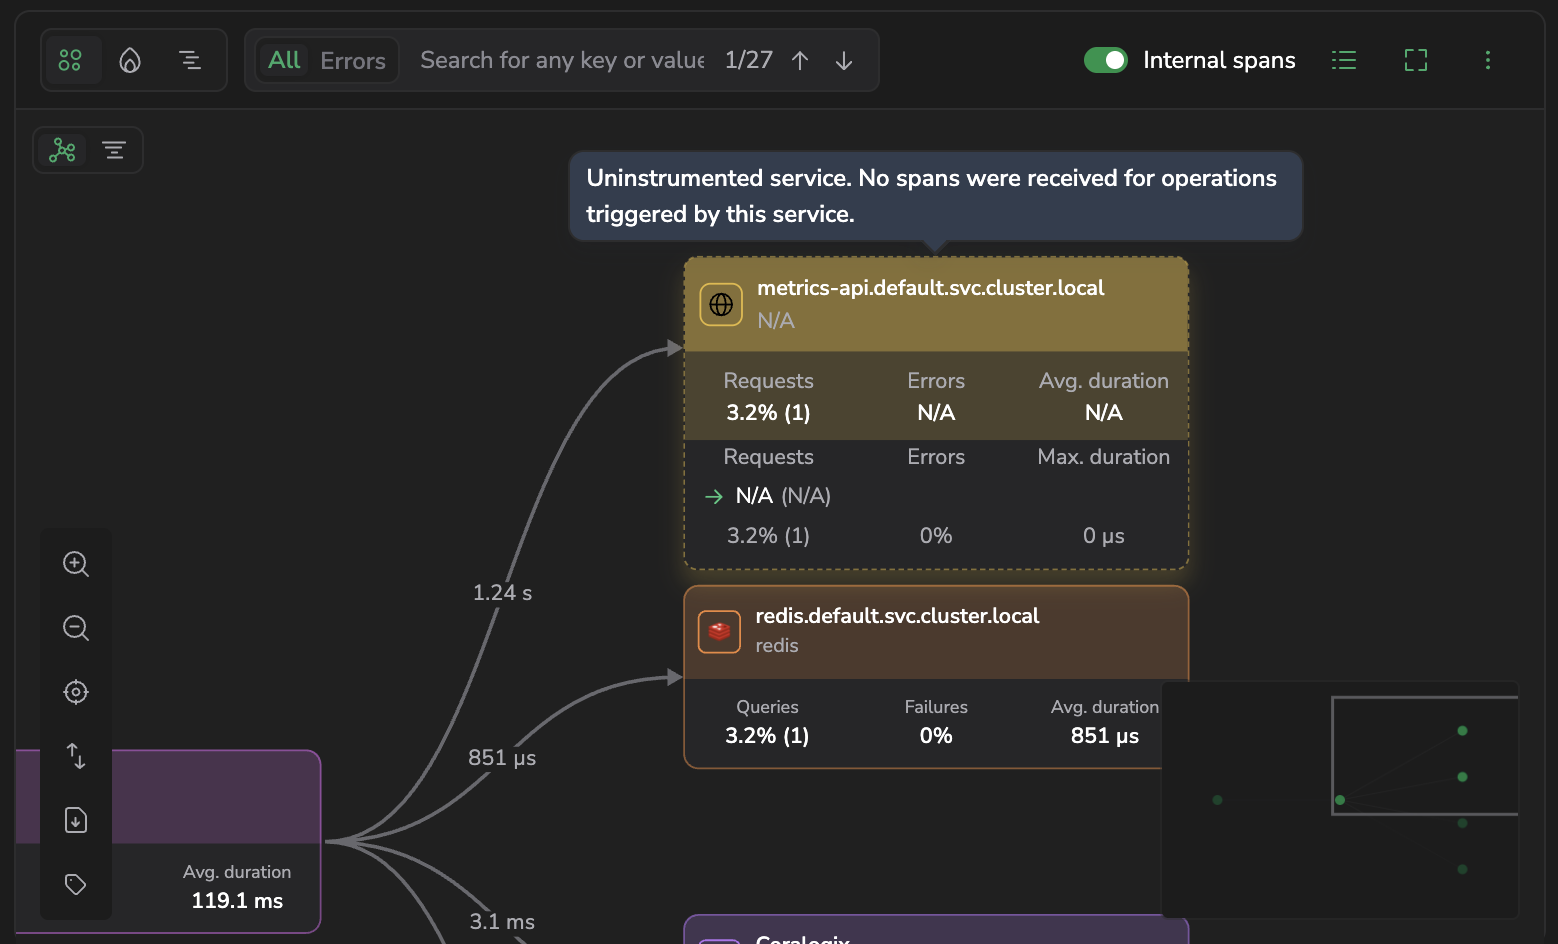
- Dashed border and generic icon: the node renders with a dashed border and a generic globe icon, in contrast to the solid border and service-specific icon of instrumented services. This applies at both node sizes, the compact circle and the expanded card.
- Requests count, but
N/Afor Errors and duration: the node still shows a Requests value, the calls made to it, counted from the instrumented caller's spans. Errors and Avg. duration showN/A, because those require the service's own spans, which Coralogix never received. - Tooltip: hovering the node shows
Uninstrumented service. No spans were received for operations triggered by this service. - Not selectable for drilldown: the node can't be opened for drilldown. There are no spans, logs, or metrics of its own to inspect.
Why it appears only in Service view
Service view maps the request as a service-to-service graph, so it can place a service on the map using only the references other services make to it. Span view and the Flame and Gantt views represent individual spans (and an uninstrumented service has none) so it has no node to show there. To see uninstrumented services, stay in Dependencies → Service view.
Why a service is uninstrumented
A service shows as uninstrumented for one of two distinct reasons, worth telling apart, because they call for different fixes:
- Truly uninstrumented: the service has no OpenTelemetry SDK or agent installed at all, so it emits no spans, logs, or metrics to any backend. This is the strict OpenTelemetry definition of uninstrumented. Third-party or managed dependencies (for example, a managed database or SaaS API) usually fall here, since you can't instrument them directly.
- Instrumented, but data isn't received: the service is instrumented, but its telemetry never reaches Coralogix, for example, a misconfigured exporter, a network failure, or a Collector drop. The service is technically instrumented; Coralogix just isn't getting its data.
Use it to
- Reveal architectural blind spots, services in the call path that you have no visibility into.
- Decide where to add instrumentation next, based on which uninstrumented services sit on critical paths.
What to do next
To gain full visibility into this service, add OpenTelemetry instrumentation. An SDK or agent that emits spans, logs, and metrics. See the OpenTelemetry getting started guide for setup instructions.
If the service is already instrumented but its data isn't arriving, check its export pipeline instead: the exporter configuration, the network path, and any Collector between the service and Coralogix.
Either way, once the service's spans reach Coralogix it renders as a normal instrumented node with live metrics instead of a dashed placeholder.
Related resources
Next steps
Stream logs live as they arrive with LiveTail.