Quick start: your first time using Config Navigator
This guide shows how to move from raw YAML to a visual architectural map using Config Navigator, helping you validate your first configuration.
1. Access the visualization
Access Fleet Manager, then Configuration. Select any of the configuration groups. The opened page displays a split view with the YAML editor on the left and the Config Navigator canvas on the right.
2. Generate the architecture map
The visualization updates automatically, no save action is required.
- Existing configurations: The graph renders as soon as the configuration loads.
- New configurations: Begin typing a receiver, processor, or exporter. Once the YAML is syntactically valid, the corresponding nodes appear on the canvas.
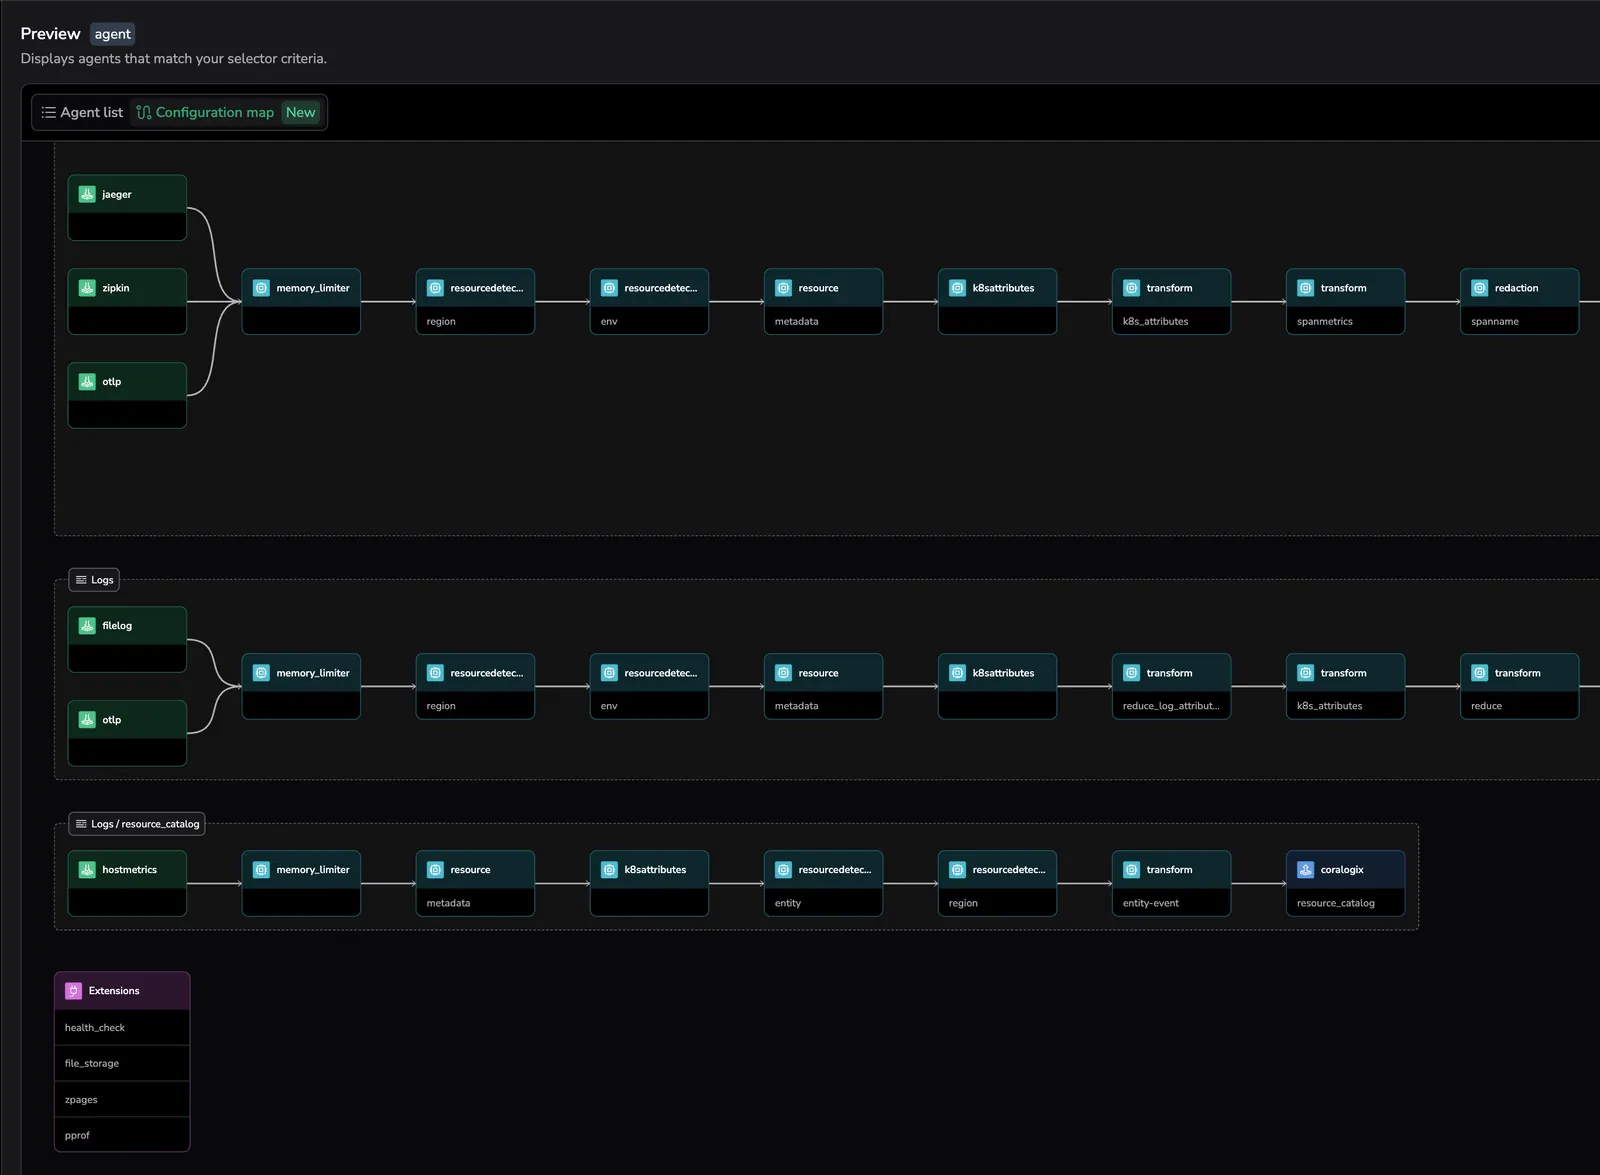
3. Understand pipeline components
Read the graph from left to right to follow the lifecycle of your telemetry data:
- Left-side nodes (green): Receivers, showing where data enters the pipeline (for example,
otlporhostmetrics). - Middle nodes: Processors, applied in sequence. Verify that the order reflects your intended logic, such as filtering before batching.
- Right-side nodes: Exporters, representing destinations such as Coralogix or Prometheus.
- Purple nodes: Connectors, indicating where one pipeline feeds into another for advanced routing scenarios.
4. Navigate and inspect the graph
Use the canvas controls to explore complex configurations:
- Zoom and pan: Zoom with the scroll wheel and drag the canvas to move between pipelines (logs, metrics, traces).
- Fit to view: Select Fit to view (bottom right) to center the entire architecture on the canvas.
- Path highlighting: Select any node to highlight its inbound and outbound connections, making it easier to trace a specific data path through dense configurations.
5. Identify and fix issues visually
Config Navigator provides immediate feedback when it detects configuration problems.
- Validation indicators: Nodes outlined in red or marked with a warning icon indicate errors. Hover to view details, such as missing required fields or references to undefined components.
- Editor correlation: Select a problematic node to identify the corresponding section in the YAML. Visual cues indicate exactly which component requires attention.
Next steps
Learn how to create, version, and manage configurations across your fleet in Configuration management.
Last updated on