Visual builder
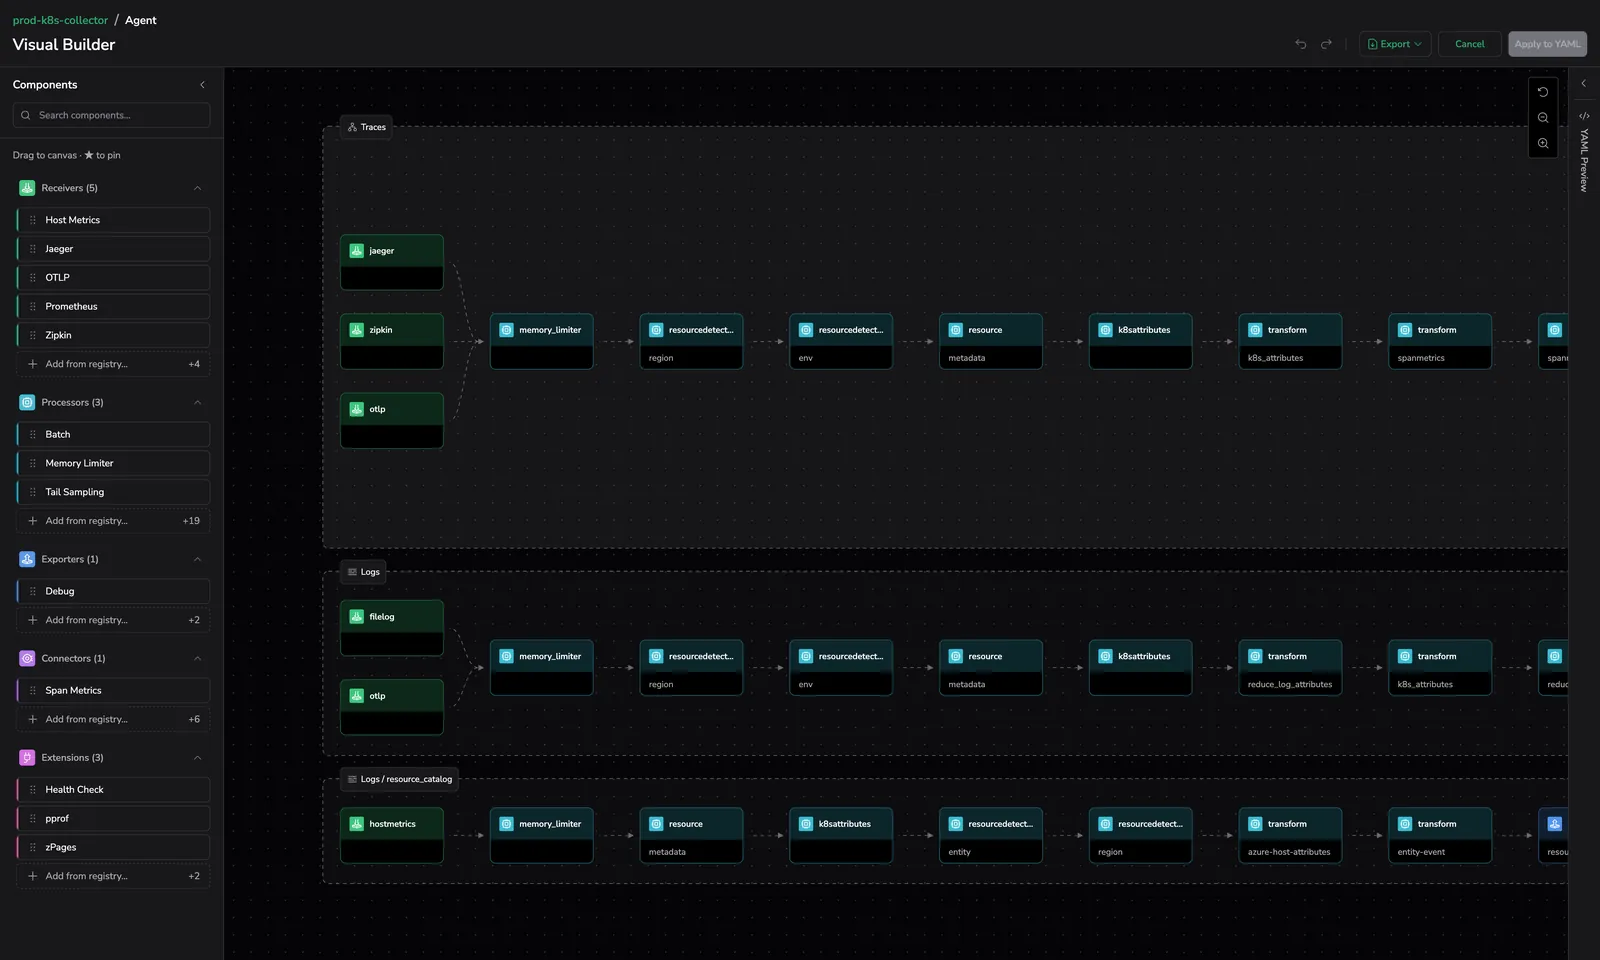
The Visual builder is a graph-based editor for the OpenTelemetry (OTel) Collector pipelines that Fleet Management deploys to your agents. Instead of editing collector YAML by hand, you see a pipeline of receivers, processors, and exporters per signal (logs, metrics, traces), drag components from a palette onto the graph, configure each node in a structured form, and apply the changes back to YAML.
When to use the Visual builder
The configuration editor exposes two edit modes for a configuration group: Presets and Code. The Visual builder works on top of Code mode, it edits the raw collector YAML through a graph and a schema-driven form.
| Use this | When |
|---|---|
| Presets (Configuration templates) | You want toggle-based, environment-specific setup for a Kubernetes, ECS, or Host group without writing YAML. |
| Visual builder | You are working in Code mode and want to add, rename, configure, or reorder pipeline components without typing YAML by hand. |
| YAML editor | You need to make a change that the form cannot represent, for example, a field on a component the builder has no schema for, or precise control over key order and comments. |
| Config navigator | You only need to read the pipeline graph for review or debugging, not edit it. |
The Visual builder button stays inactive while the configuration family uses Presets mode. Hovering the inactive button shows the tooltip Switch to Code mode to use the Visual builder.
Prerequisites
- The
REMOTE-CONFIGURATION:MANAGEpermission. See Permissions. - A Code-mode configuration version that you can open in the configuration editor. See Configuration management.
Open the Visual builder
- In Coralogix, select Integrations in the navigation menu, then select Fleet Management, then select the Configurations tab.
- Open a configuration group and select a version to edit.
- In the configuration editor, make sure the configuration family uses Code mode.
- In the preview panel header, select Visual builder.
The Visual builder opens with the components panel beside the pipeline graph for the current YAML.
Pipeline graph anatomy

The graph follows the standard OTel pipeline lifecycle: receivers ingest telemetry, processors transform it, and exporters deliver it to a destination. The graph groups nodes into clusters (one per signal (logs, metrics, traces)) plus a separate area for extensions. Each cluster contains only the pipelines for that signal, so configurations with multiple pipelines per signal stay in their own cluster and the graph stays readable as you scale.
| Component | What it does |
|---|---|
| Receivers | Data ingestion points (for example, otlp, hostmetrics). |
| Processors | Transformation, filtering, and enrichment steps. |
| Exporters | Destinations for telemetry data. |
| Connectors | Bridges between pipelines. A single connector appears as both the exporter of one pipeline and the receiver of another. |
| Extensions | Operational and control-plane components (for example, health_check). Extensions live outside the per-signal clusters. |
For background on OTel components, see OpenTelemetry collector components.
Add a component
You can add a component to the pipeline in three ways:
- From the components panel. Drag a component chip from the panel onto a placeholder, an edge insert, or a column-add node on the graph.
- From the registry popover. Select Add from registry… in the components panel to open a sub-popover with the full OTel component catalog. Drag any item from the popover onto the graph, or select it to pin it to the components panel for reuse.
- From the inline insert menu on the graph. Select an Insert receiver, Insert processor, or Insert exporter slot on the graph to open a slot-specific popover, then pick the component.
Add a custom component
If your YAML uses a component that is not in the bundled OTel registry (for example, an experimental processor, a fork, or an internal naming convention) type its name into either the Add from registry… sub-popover or the graph insert popover. When there are no matches, the popover surfaces an + Add <name> option that inserts a custom component into the pipeline and pins it to the components panel as a chip you can reuse. Custom chips persist across page reloads in the same browser, render alongside the section's favorite chips, and offer a remove action.
AWS CloudWatch components
Three components in the palette carry CloudWatch in their name, and they do not all move data the same way. A component's type decides the direction: a receiver brings telemetry into the pipeline, an exporter sends it out to a destination.
| Component | Type | Direction |
|---|---|---|
| AWS CloudWatch | Receiver | Reads CloudWatch metrics and logs into the pipeline. |
| AWS CloudWatch Logs | Exporter | Writes logs from the pipeline out to Amazon CloudWatch Logs. |
| AWS EMF | Exporter | Writes metrics out in CloudWatch Embedded Metric Format. |
AWS CloudWatch Logs is the one to read carefully. It sends your logs to CloudWatch, so it is not a way to collect CloudWatch logs into Coralogix. To bring CloudWatch logs in, use the AWS CloudWatch receiver, or connect the account directly through Cloud Accounts, which needs no collector at all.
The same reading applies across the palette. AWS S3 and AWS X-Ray are exporters, so they deliver telemetry to those services rather than collect from them.
Configure a component
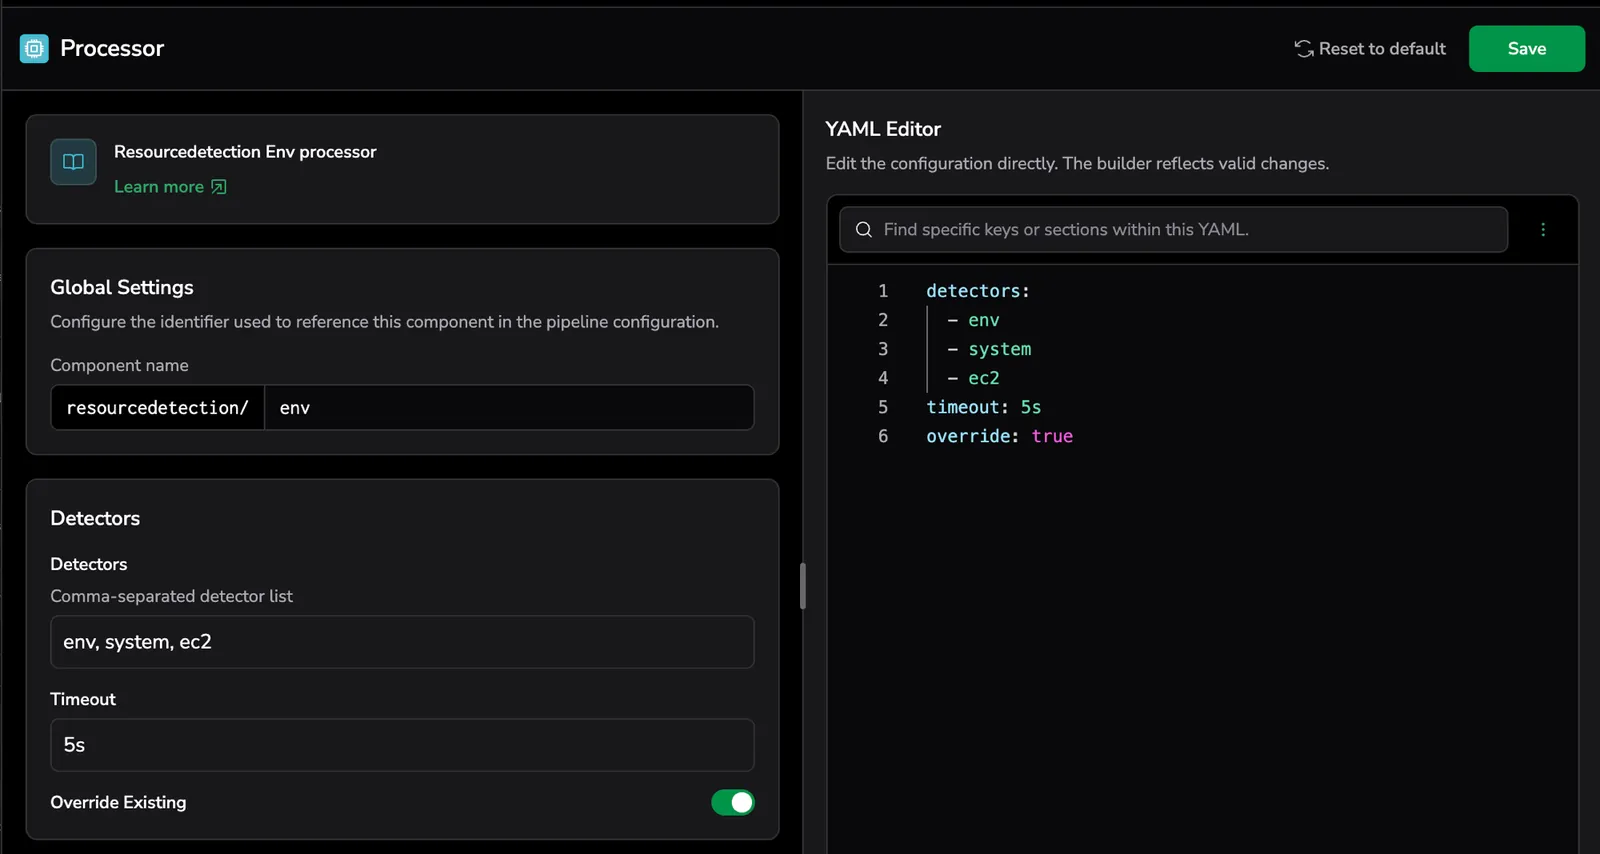
Double-click a node on the graph to open the node config drawer. The drawer has two panes: a schema-driven form and a YAML view of the same component. The form fields come from the component's schema, so each component shows the fields and types it actually accepts. The YAML pane covers anything the form doesn't.
Component info card
The top of the form pane shows an information card for the selected component, with the component title, an optional descriptive text, and a Learn more link. The link resolves to the corresponding page in the opentelemetry-collector or opentelemetry-collector-contrib repository. Variant names like coralogix/resource_catalog link to the base component page (coralogix), not the variant.
Rename a component through the suffix
Multiple instances of the same component can coexist in a collector configuration by appending a /<suffix> to the key (for example, otlp/secondary). In the node config drawer, the component name appears as the base type plus an editable suffix.
To rename a component, edit the suffix and select Save. The builder rewrites every reference in service.pipelines.* and service.extensions so the graph stays consistent. For connectors, references in both receivers[] and exporters[] across all pipelines are rewritten in the same save.
If the suffix collides with an existing component, an inline duplicate error appears and Save stays inactive. The builder strips whitespace, slashes, and colons from the suffix as you type.
Builder unavailable empty state
If the builder cannot drive the YAML for the selected node, the form pane shows a centered Builder unavailable empty state instead. There are two cases:
- The YAML has fields the form cannot represent (semantic divergence). The empty state explains the divergence and shows a Reset to defaults button that resets the YAML and restores the form.
- The component has no structured form (no schema). The empty state points you to the YAML pane and does not show Reset to defaults, since reset cannot recover a missing schema.
The builder detects divergence by parsing both sides of the YAML and comparing the resulting structures, so reordering keys, changing quoting, or adding comments in the YAML pane does not flip the drawer into the unavailable state. Only changes the schema cannot represent do.
Edit tail sampling policies
The tail_sampling processor has a dedicated Policies section in the node config drawer, after the buffering fields (decision_wait, num_traces, expected_new_traces_per_sec). You can add, edit, reorder by drag, and remove policies without leaving the form.
The editor supports the following tail sampling policy types from the OTel contrib distribution:
status_codelatencyprobabilisticalways_samplestring_attributerate_limiting
Edits in the policy editor update the YAML pane live. Hand edits in the YAML pane refresh the policy editor when the YAML round-trips cleanly through the policy schema.
For the underlying processor reference, see Tail sampling processor in the OTel collector-contrib repository.
Apply changes to YAML
The Visual builder mutates an in-memory copy of the collector YAML. To write your changes back to the underlying configuration version, select Apply to YAML in the builder toolbar.
- Apply to YAML stays inactive when the current builder state is identical to the snapshot taken when the builder opened. Hovering the inactive button shows the tooltip No changes to apply.
- After any mutation in the builder (drop, configure, reorder, rename, delete), the button activates.
- Undo and redo navigate through the builder's edit history. Undoing back to the original snapshot deactivates the button. Redoing reactivates it.
- Selecting Cancel without applying prompts a confirmation dialog when you have unsaved changes.

Applying changes only updates the YAML in the configuration editor. To roll the new YAML out to agents, save the configuration version and activate it from the Configurations tab. See Configuration management.
Export the graph as PNG
Use the Export PNG action in the builder toolbar to download the current pipeline graph as an image. Use this for design reviews, runbooks, or to attach a graph to a change request.
What's not supported
- Presets mode. The Visual builder edits raw collector YAML. It stays inactive while the configuration family uses Presets mode. Use Presets-mode toggles instead, or switch the family to Code mode.
- OpenTelemetry operator and OpAMP-bridge configurations. These require Kubernetes Custom Resource Definition (CRD)-shaped configurations, while Fleet Management's configuration family model uses raw collector configurations. The Visual builder does not support them.
- Components without a schema. The builder still inserts custom components (see Add a custom component) into the pipeline, but their node config drawer shows the Builder unavailable empty state and points you to the YAML pane for any field edits.
Additional resources
Related links
- Config navigator. The read-only pipeline visualization that the Visual builder builds on.
- Configuration management, how configuration groups, versions, and rollout work.
- Configuration templates, Presets-mode setup for Kubernetes, ECS, and Host environments.
- OpenTelemetry collector components, reference for receivers, processors, exporters, connectors, and extensions.
Next steps
Learn how to manage configuration groups and versions in Configuration management.