Data Limits
Coralogix is introducing fair usage limits for Infrastructure Monitoring to ensure platform stability, predictable performance, and fair access for all customers. These limits apply specifically to Infrastructure Explorer and the data you send to it.
View your infrastructure data usage in the Data Usage screen under Settings, then Data Usage. While infrastructure data is currently metered at 0 units, it still follows fair usage limits. Learn more about Data Usage
What are the limits?
The following table summarizes the main fair usage limits:
| Limit name | Applies to | Fair usage limit | Description |
|---|---|---|---|
infra_monitoring_events_processed | Event ingestion | 1 million/hour | Number of infrastructure events allowed per hour. |
infra_monitoring_event_payload | Attribute size | Max 256 characters/value | Attribute value length in infrastructure monitoring events. |
infra_explorer_active_items | Infrastructure Explorer | 100,000 active items | Maximum items shown in Infra Explorer (nodes, pods, volumes, etc.) |
infra_explorer_retention_period | Infrastructure Explorer | 14 days | How long historical data is retained. |
What do the limits mean?
Each limit is designed to prevent:
- System overloads due to excessive ingestion
- Noise from non-critical data
- Unexpected slowdowns for other customers
- Inefficient data exploration caused by overly large inventories
They define what is considered fair and reliable use of the system at your current plan level.
What happens when you exceed limits?
Each limit is enforced differently:
| When limit is exceeded | System behavior |
|---|---|
infra_monitoring_events_processed | A circuit breaker is triggered. All incoming events are blocked until the next hour. |
infra_explorer_active_items | New items over the limit are blocked from appearing in Infra Explorer. |
infra_monitoring_event_payload | Attribute values longer than 256 characters are truncated or dropped. |
infra_explorer_retention_period | Older data is automatically deleted after 14 days. |
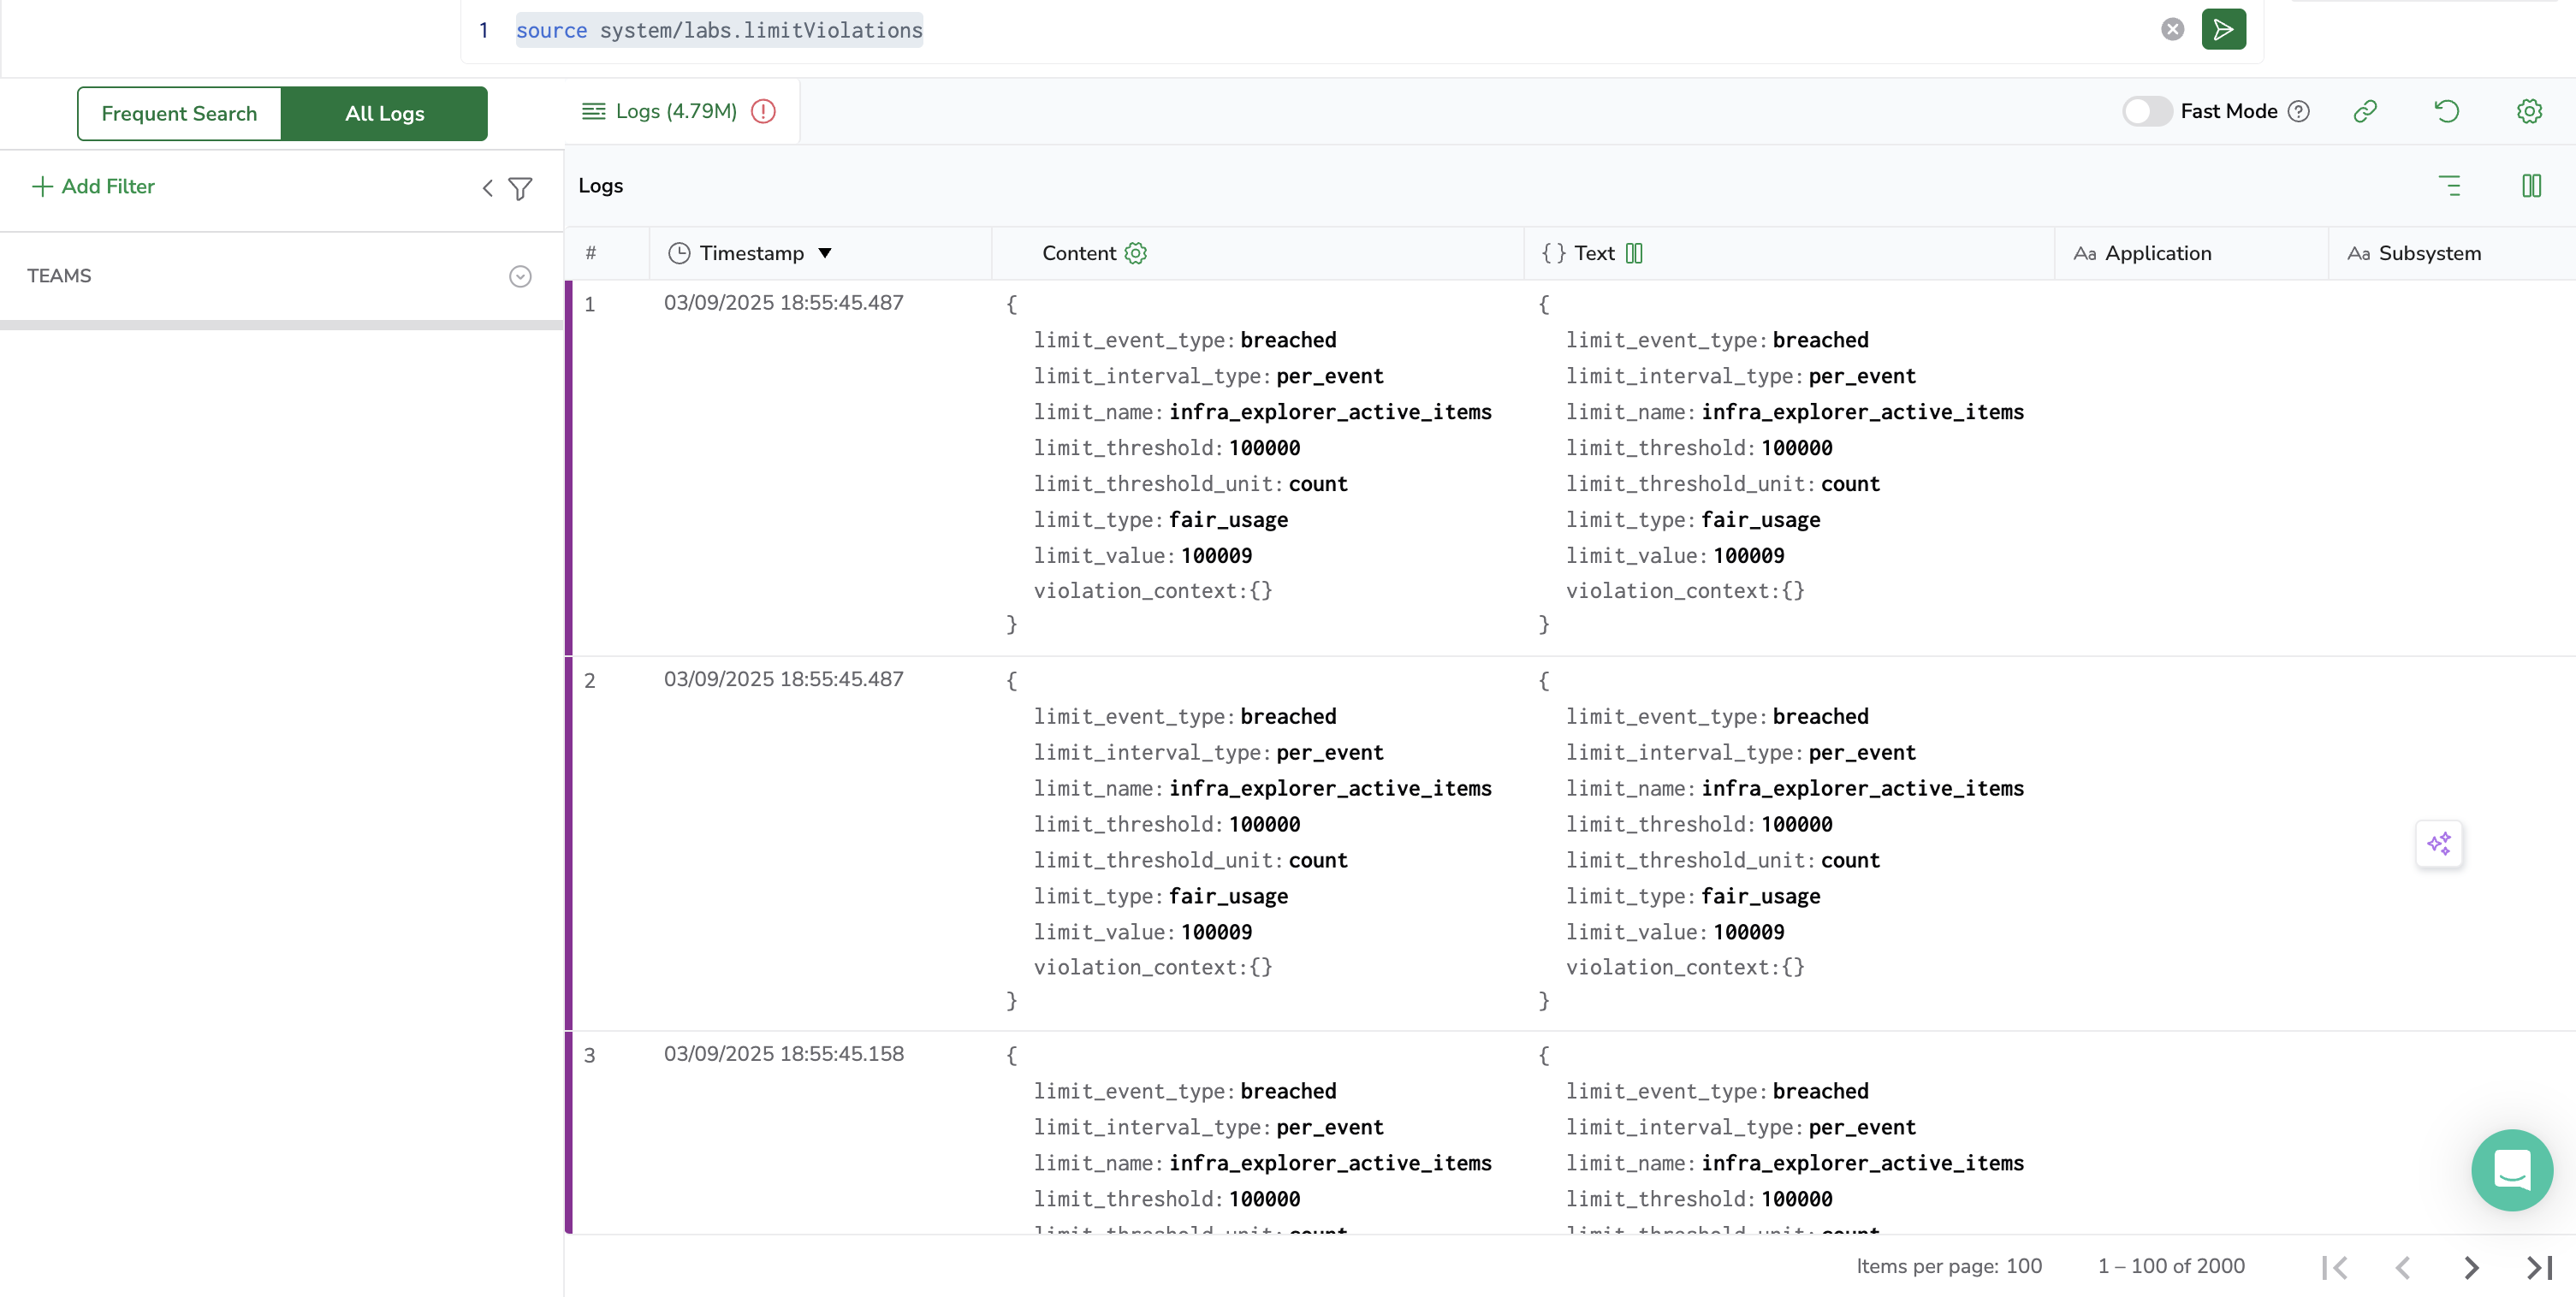
When a limit is crossed, Coralogix also emits a diagnostic log that includes:
{
  "limit_name": "<name of the limit>",
  "environment": "<env>",
  "fair_usage_threshold": "<value defined>",
  "current_value": "<current_value_that_breached>",
  "timestamp": "<RFC 3339>",
  "labels": <additional_key_values_for_any_sub_division>
}
Example:
{
"limit_name": "infra_monitoring_events_processed",
"environment": "eu-west-1",
"fair_usage_limit": "5000000",
"current_value": "5000001",
"timestamp": "2025-07-22T14:30:00Z",
"dimensions": {}
}
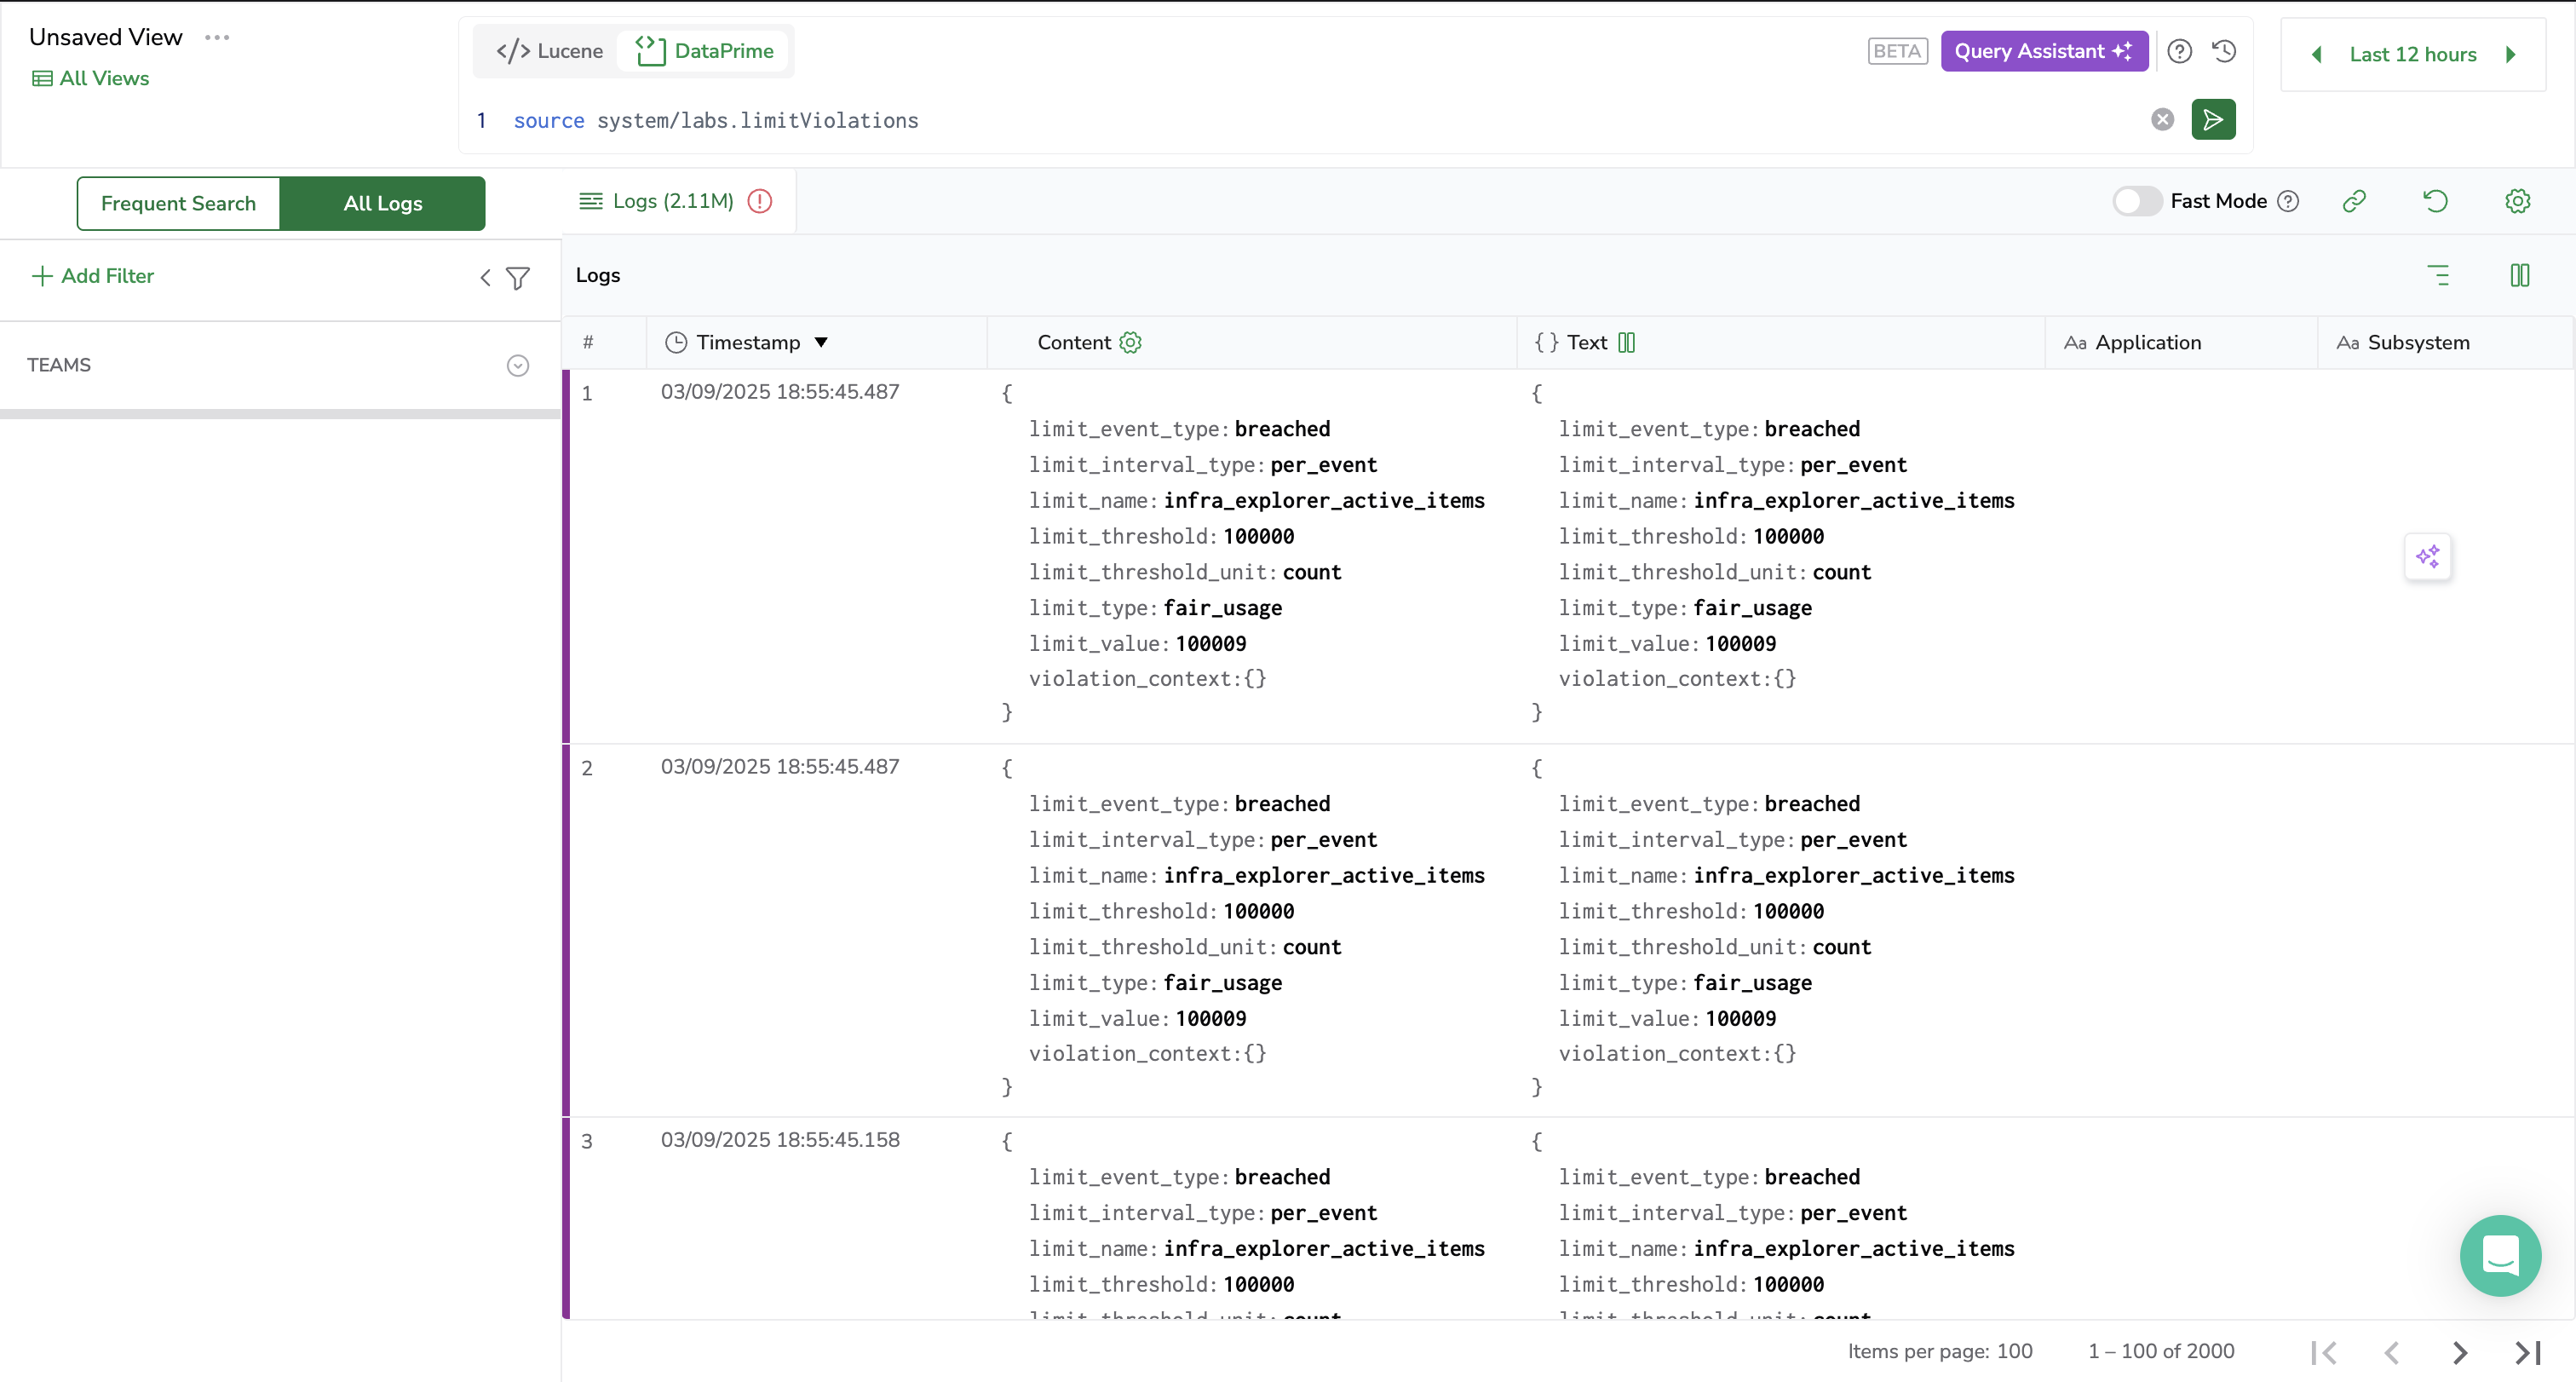
These logs appear in your log ingestion pipeline so you can track violations and remediate proactively.
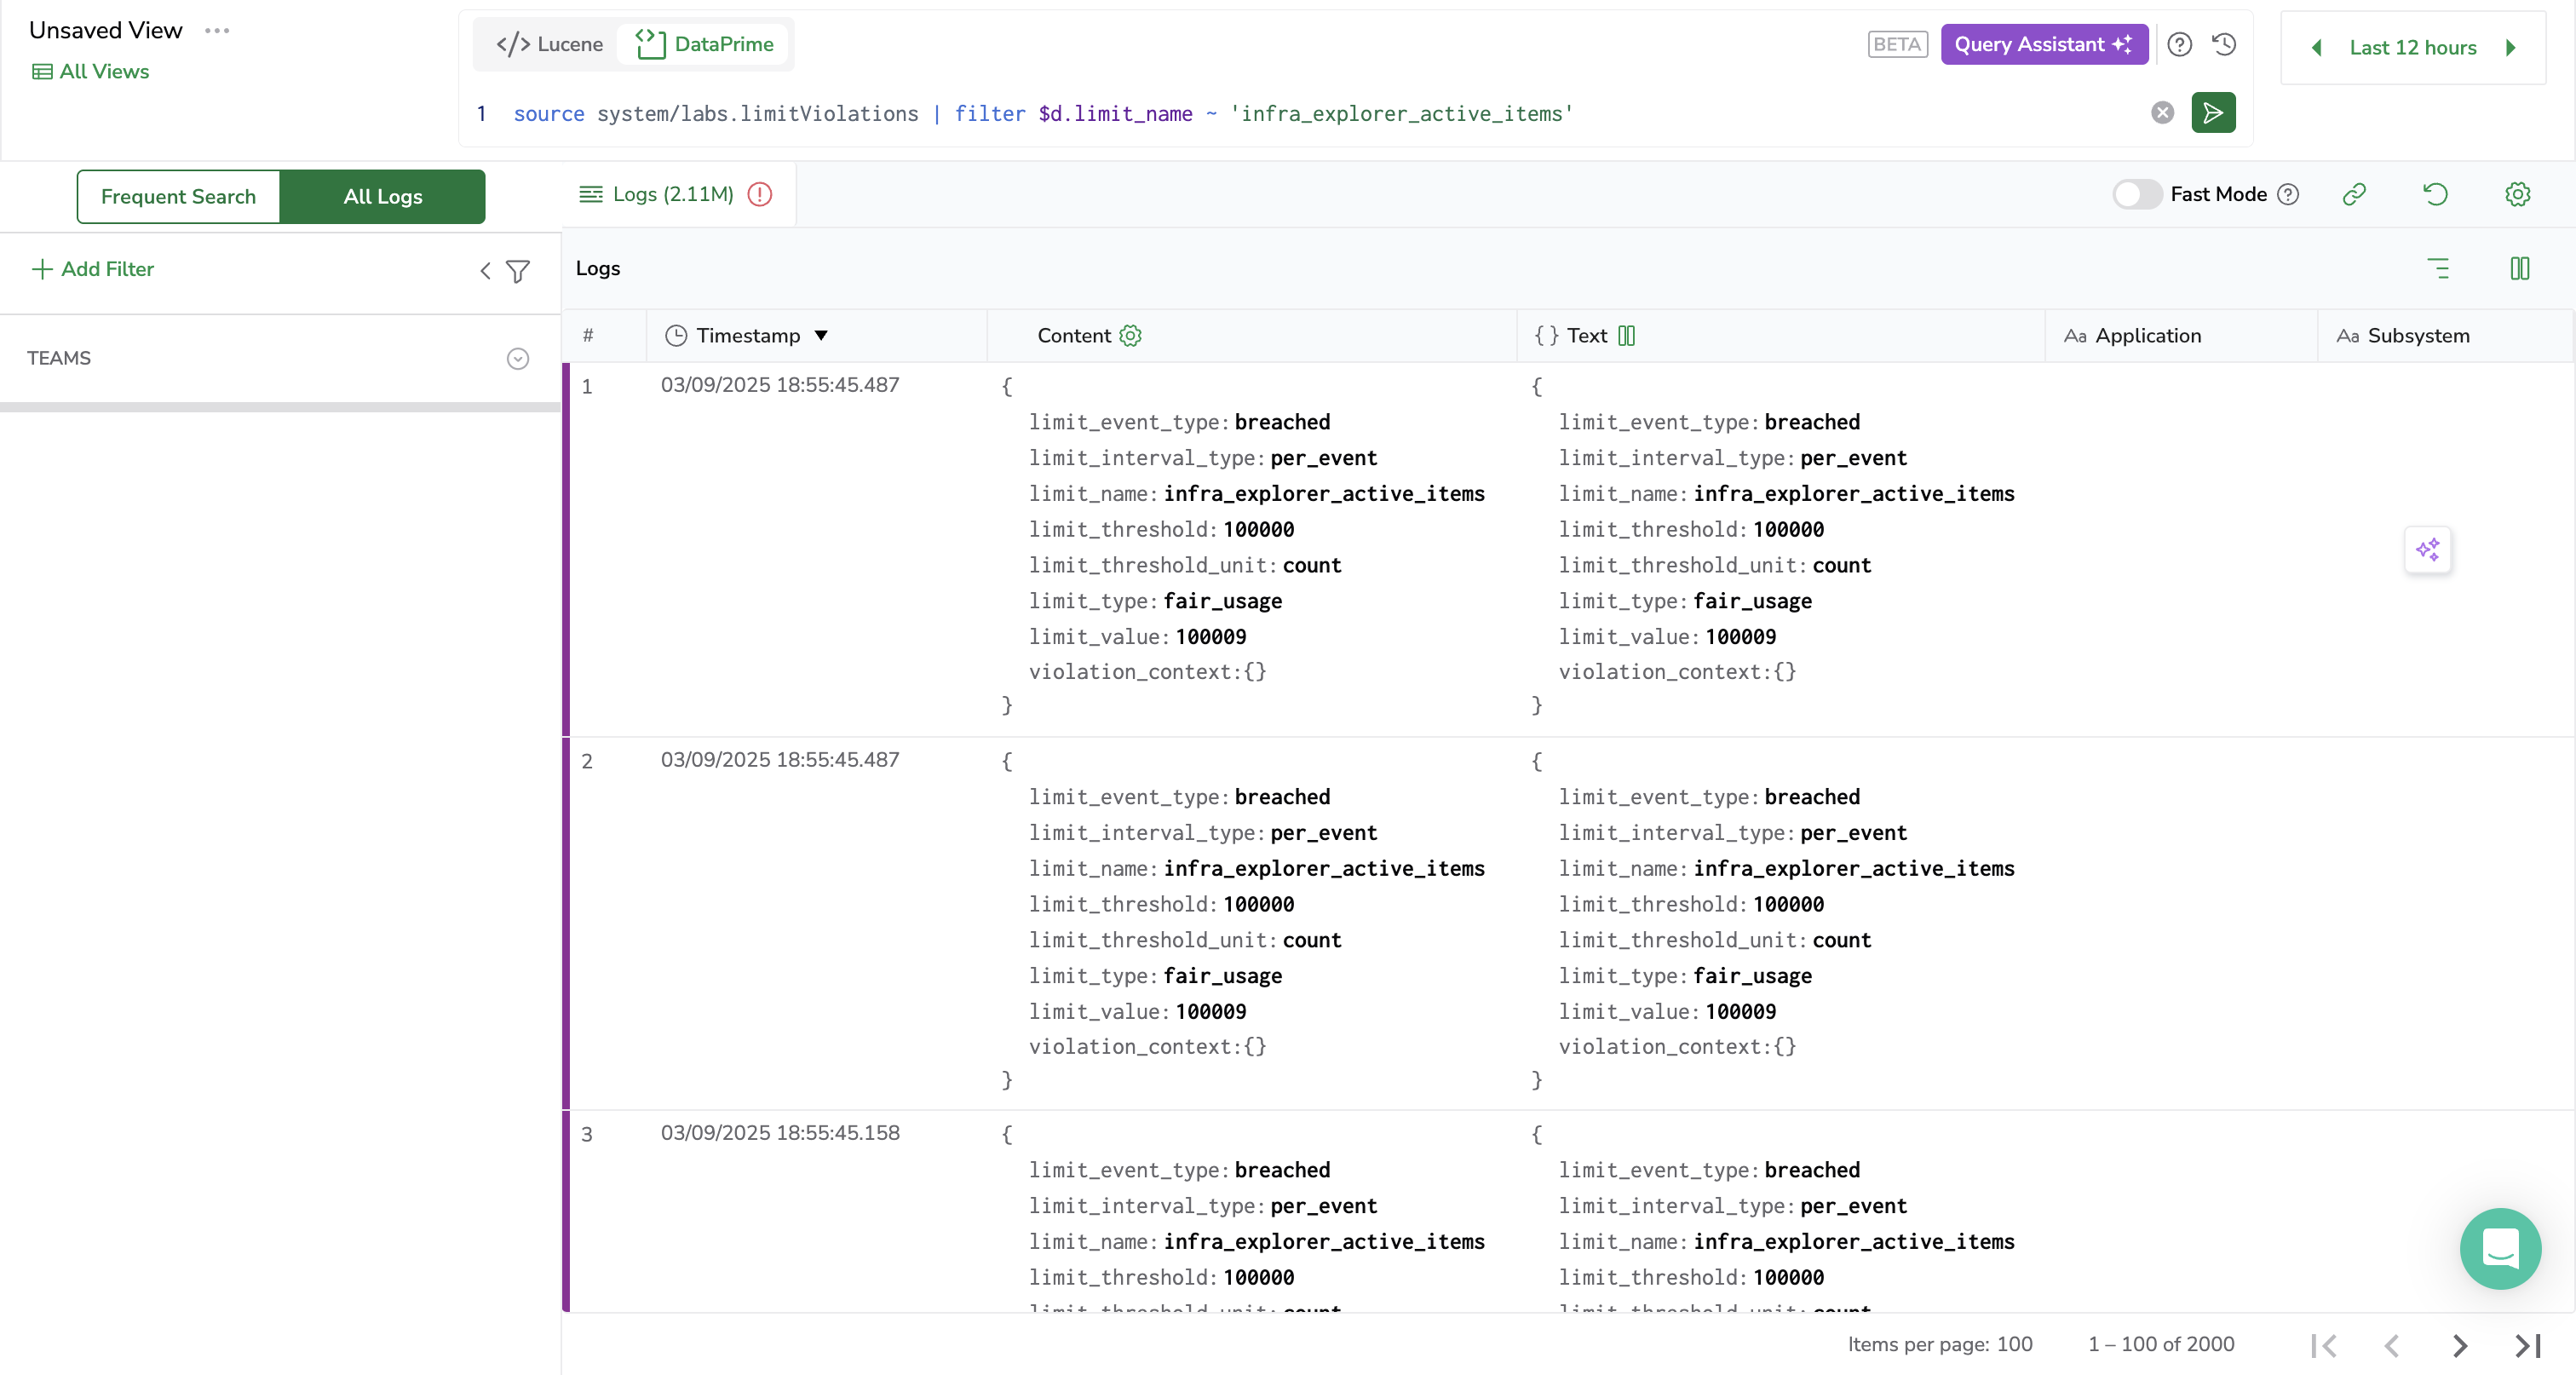
Query examples
Run this to see all categories of violation logs
query:
event: infra_monitoring_events_processed
query:
event: infra_explorer_active_items
query:
event: infra_monitoring_event_payload
query:
event: infra_explorer_retention_period
query:
Where can I view my current usage?
Your current Infrastructure Monitoring usage is visible in the Usage tab of the Coralogix app. Select Settings, then Data Usage, then Infrastructure data
| Section | Description |
|---|---|
| Total Events | Cumulative number of infrastructure events sent in the selected time window. |
| Daily Max | The peak number of events on a single day during the selected period. |
| Stacked | Daily breakdown of:• Infrastructure events (light orange)• Blocked infrastructure events (dark orange)• Quota line for reference |
| Breakdown Table | Shows daily usage broken down by:• Infrastructure events: All ingested events• Blocked infrastructure events: Dropped or rejected eventsEach day shows the event count and unit usage |
Can I control or block data myself?
Yes. Configure the OpenTelemetry Collector to filter or drop unnecessary infrastructure events before they reach Coralogix. For more information, see Advanced Configurations.
For example:
This reduces usage and ensures only important data appears in your infrastructure dashboard.