Infrastructure explorer
Infrastructure Explorer provides a live, searchable inventory of your Kubernetes and cloud resources. It surfaces real-time context for every resource: tags, relationships, versions, ownership, and health status, without manual mapping or spreadsheets.
Explore resources
Browse, group, and analyze discovered resources in Live and Inventory views.
Search and filter
Find resources by name, tag, owner, or namespace with the Lucene builder.
Monitor health
Track resource health status across your environment.
Track ownership
Assign teams and track accountability for infrastructure resources.
Compare configuration
Diff resource configurations across time or between resources.
Manage data usage
Monitor and optimize the cost of your infrastructure metrics.
Connect your cluster or host to start exploring your infrastructure inventory. See Getting started with Kubernetes monitoring or Getting started with host monitoring.
Learn how Infrastructure Explorer differs from traditional dashboards in resource discovery, troubleshooting, and real-time auditing.
Get started
- Kubernetes
- Hosts
- Connect your cluster. Follow Getting started with Kubernetes monitoring to connect your clusters, collect live metadata, and visualize workloads.
- Enrich your data. Add labels, annotations, and resource attributes using Kubernetes enrichment options.
- Explore resources. Open Infrastructure, then Infrastructure Explorer to browse, search, and filter your live inventory.
- Set up host monitoring. Follow Getting started with host monitoring to monitor cloud and on-prem machines.
- Enrich host data. Add cloud tags and metadata using Host data enrichment.
- Explore resources. Open Infrastructure, then Infrastructure Explorer to view system health, usage, and ownership.
What you get
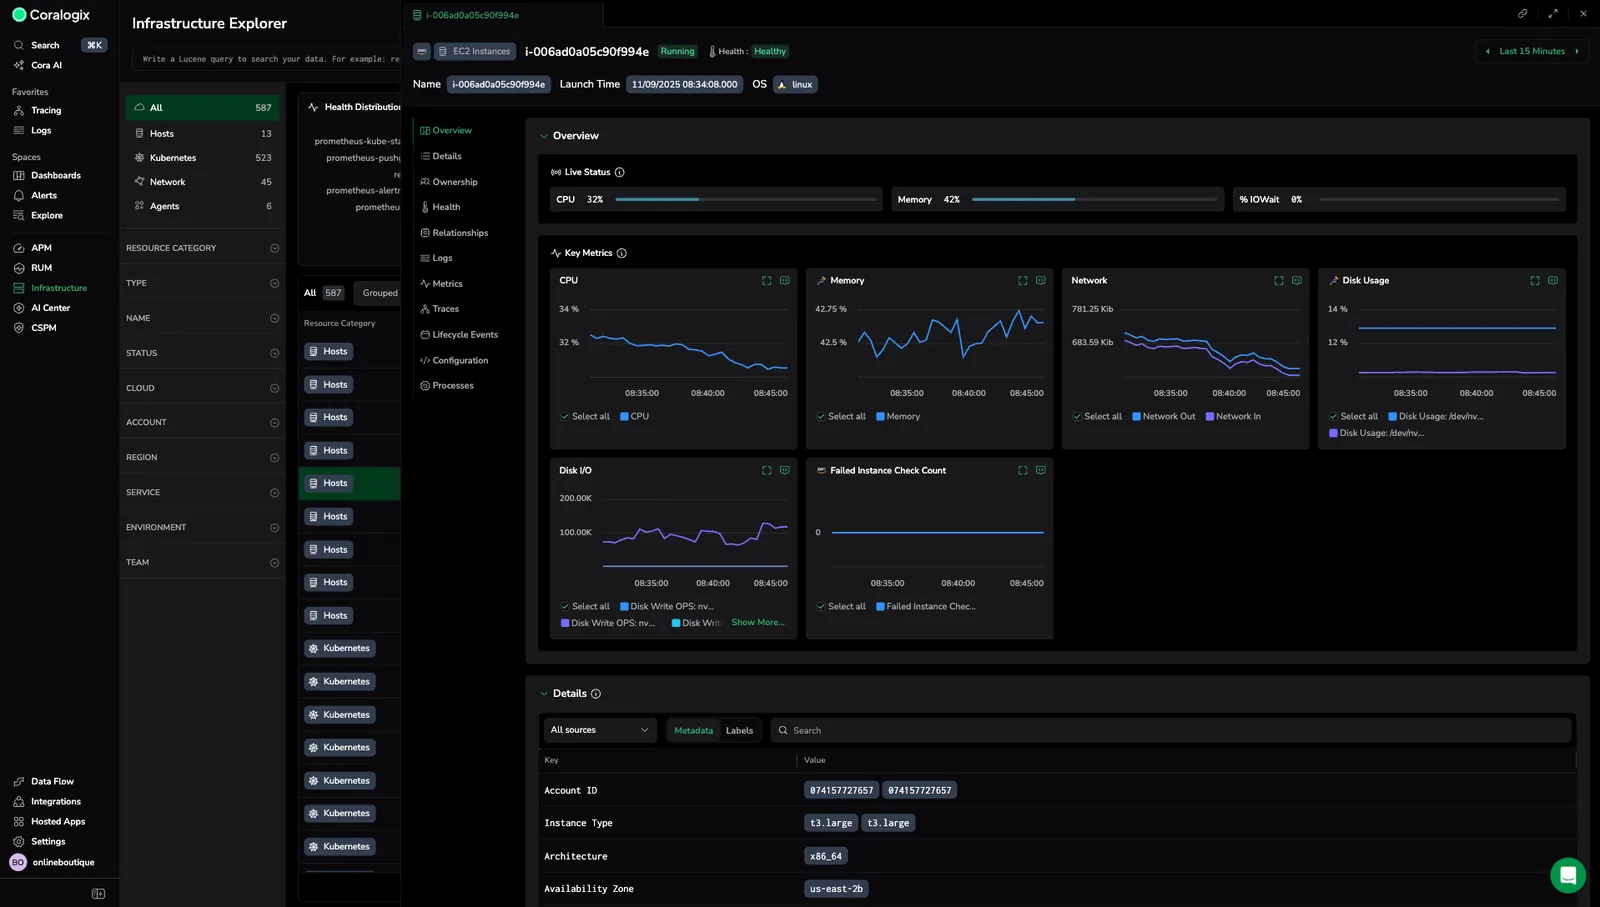
A unified view of your infrastructure across Kubernetes and cloud environments. Navigate clusters, nodes, pods, containers, hosts, network interfaces, and more from a single screen.
From the Coralogix toolbar, select Infrastructure, then Infrastructure Explorer.
Capabilities
- Explore resources: Search, filter, group, and analyze discovered infrastructure in Live and Inventory views
- Health overview: Monitor resource health status across your environment
- Health policies: Define and manage health rules that evaluate resource conditions
- Ownership: Assign teams and track accountability for infrastructure resources
- Compare configuration: Diff resource configurations across time or between resources
- Application telemetry: Configure observability for applications running on your infrastructure
- Data usage: Monitor and optimize infrastructure metric costs
Investigate a resource
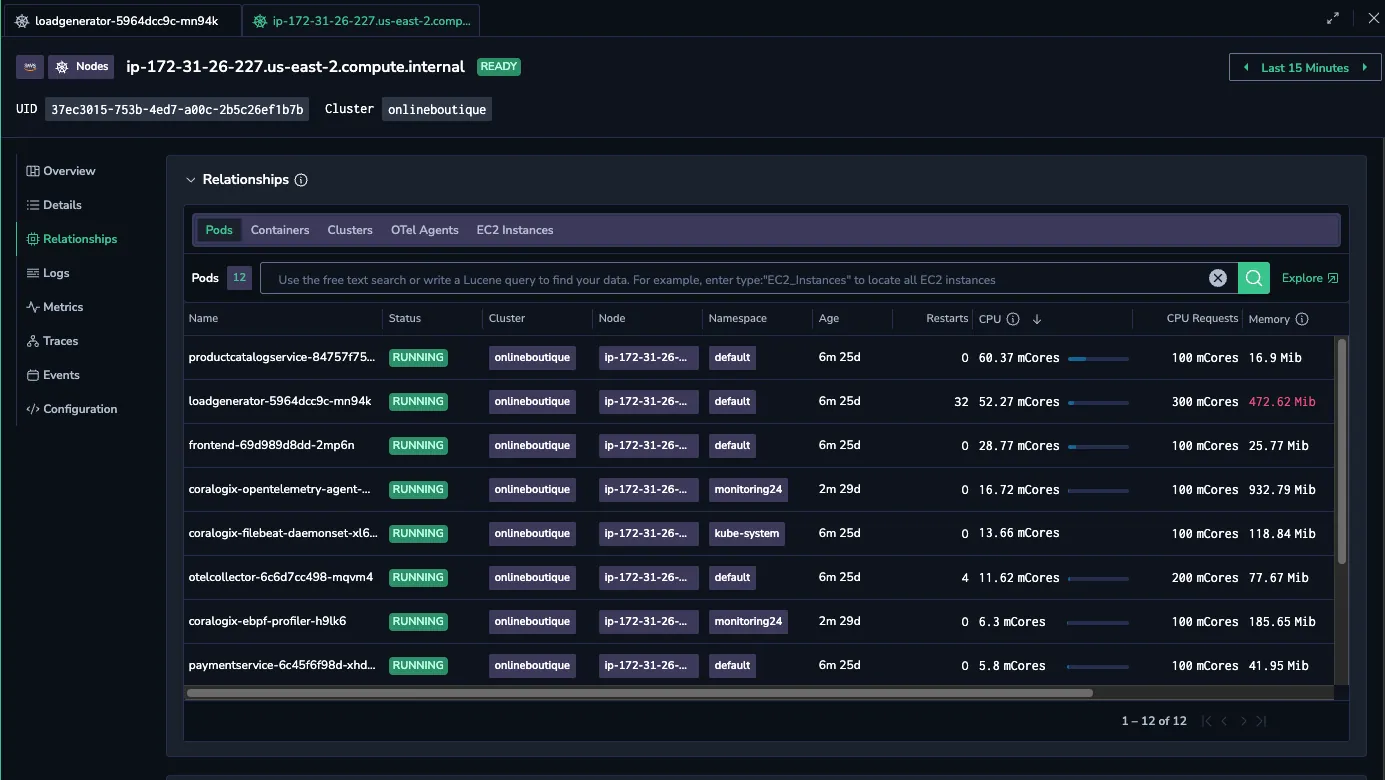
Select any resource to open a context-rich side panel with the full state, telemetry, and metadata for that resource.
This panel does not display secrets. Values resembling secrets (for example, tokens or keys) are randomly generated identifiers and pose no security risk.
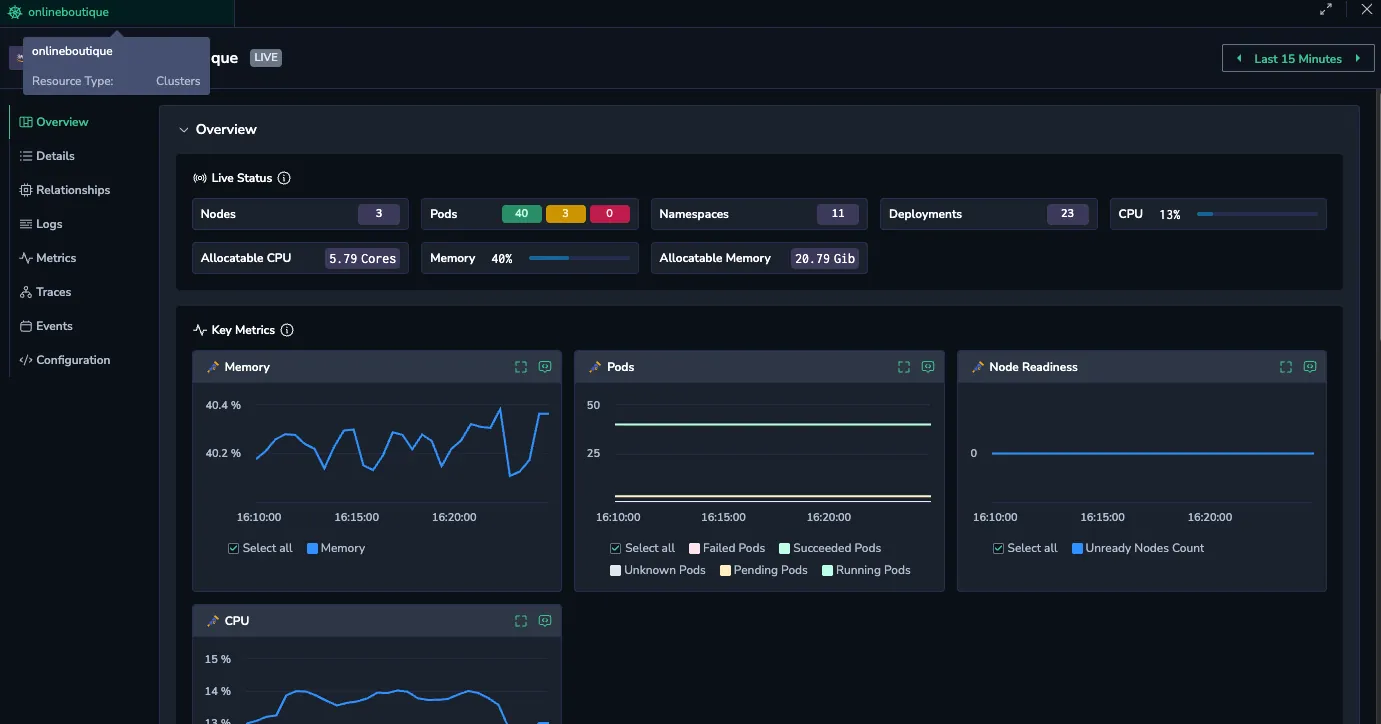
- Fast insight
- Deep dive
- Connected context
Get a quick snapshot of resource health. Overview shows usage and status at a glance. Events reveals real-time issues like scheduling or probe failures. Metrics helps spot performance trends and resource bottlenecks.
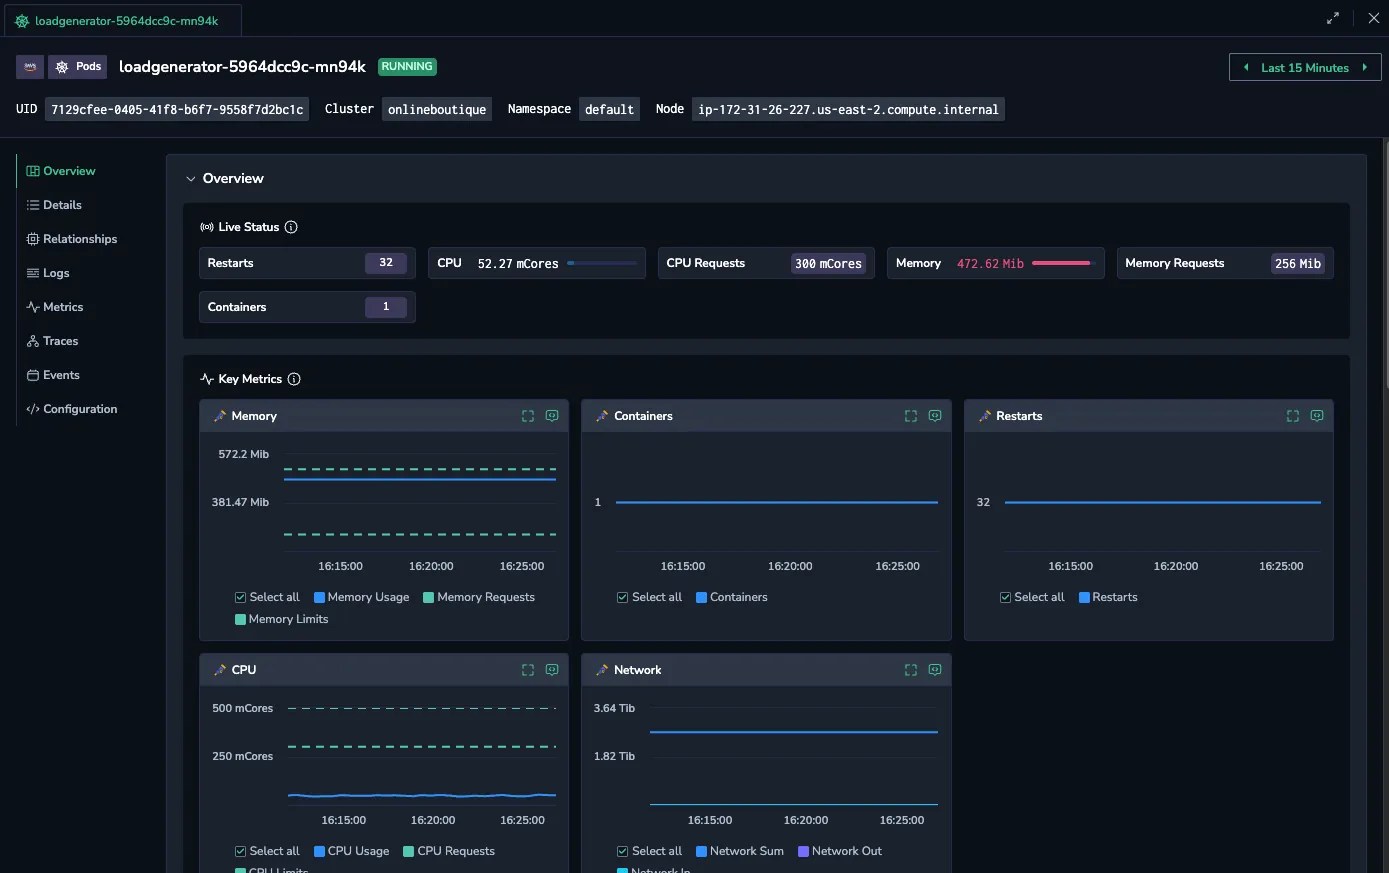
For exact data, Details shows metadata like image tags and labels. Configuration exposes the full YAML/JSON spec. Logs provides real-time application output with search and filtering.
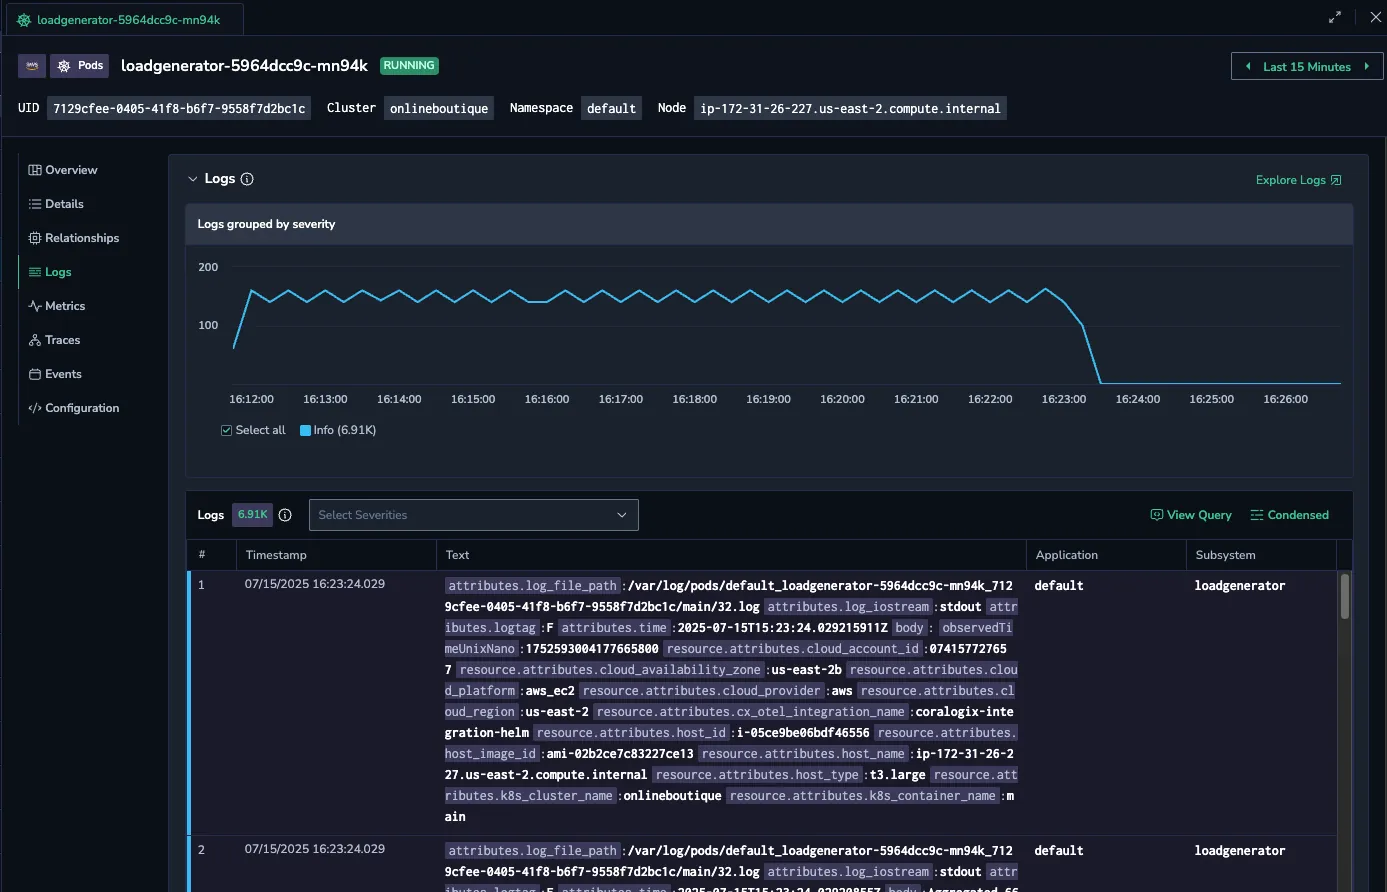
Understand dependencies. Relationships maps Kubernetes resources to each other: pods to nodes, services to volumes. Traces (if enabled) follows requests across services to find latency or failure points.
Time filtering
Narrow scope to a specific moment for focused debugging. Select a time range to reduce noise, compare behavior across logs, metrics, and traces, and uncover patterns.

Live view shows the latest resource state, marked with a timestamp and "Live" label.

Access controls limit visibility to specific clusters, namespaces, or teams using Scopes.
Permissions
| Resource | Description | System roles | API presets |
|---|---|---|---|
INFRASTRUCTURE-EXPLORER:READ | View the Infra Explorer resource catalog. | Data Admin, Observability Lead, Platform Admin, Read-Only User, Security User, Standard User | - |
INFRASTRUCTURE-HEALTH-RULES:READ | View configured health rules. | Data Admin, Observability Lead, Platform Admin, Read-Only User, Security User, Standard User | - |
INFRASTRUCTURE-HEALTH-RULES:MANAGE | Create, edit, enable, disable, duplicate, and delete health rules. | Data Admin, Observability Lead, Platform Admin, Standard User | - |
INFRASTRUCTURE-MONITORING-DATA:MANAGE | Enable or disable Infrastructure Monitoring diagnostic logs. | Data Admin, Observability Lead, Platform Admin, Standard User | - |
INFRA-SAVED-VIEWS:READ | View saved views in Infra Explorer. | Data Admin, Observability Lead, Platform Admin, Read-Only User, Security User, Standard User | - |
INFRA-SAVED-VIEWS:MANAGE | Create, edit, and delete saved views in Infra Explorer. | Data Admin, Observability Lead, Platform Admin, Read-Only User, Security User, Standard User | - |
INFRA-SAVED-VIEWS:READACCESSPOLICY | View access policies defined on saved views. | Data Admin, Observability Lead, Platform Admin, Security User | - |
INFRA-SAVED-VIEWS:UPDATEACCESSPOLICY | Manage access policies on Infra Explorer saved views. | Data Admin, Observability Lead, Platform Admin, Security User | - |
INFRA-TEAM-DEFAULT-VIEWS:READ | View team-level default views in Infra Monitoring. | Platform Admin | - |
INFRA-TEAM-DEFAULT-VIEWS:MANAGE | Define team-level default views in Infra Monitoring settings. | Platform Admin | - |
Related resources
Next steps
Learn how Infrastructure Explorer differs from traditional dashboards in resource discovery, troubleshooting, and real-time auditing.