See Coralogix views in your AI tools with MCP Apps
Get the Coralogix experience right inside your AI tool. With MCP Apps, query results open as the same interactive views you know from Coralogix (log grids, charts, trace waterfalls), with the familiar look and feel, right next to the agent's answer. You get the answer and the evidence in one place: the agent's conclusion in text, and the data behind it in a view you can scroll, sort, and open in Coralogix.
The Coralogix MCP server shows DataPrime and PromQL results this way in AI tools that support the MCP Apps extension: a log grid, a chart, stat tiles, or a trace waterfall. You can scroll for more logs, open a trace, hover a chart, and jump to the same query in Coralogix with one click.
Shows a PromQL chart view inside a Claude chat, with the value of every series under the pointer.
MCP Apps is available in the EU2 region (eu2.coralogix.com). Availability in other regions is rolling out.
What you need
- The Coralogix MCP server connected to your AI tool. See Setup.
- An AI tool that supports MCP Apps, such as Claude (web and desktop app), Cursor, or Codex. There is nothing to turn on in the tool: the MCP server detects what your tool supports.
AI tools without MCP Apps support, such as Claude Code in the terminal, keep getting the same text answers as before.
Get a view
- In your AI tool, ask a question about your logs, spans, or metrics. For example:
Which subsystems logged the most errors today? Show the top 10. - The agent runs the query and decides whether a view helps. When it does, the view opens in the chat, under the step that ran the query, followed by the agent's answer.
- To see a view for a result the agent answered in text, ask for one, for example
Chart that.
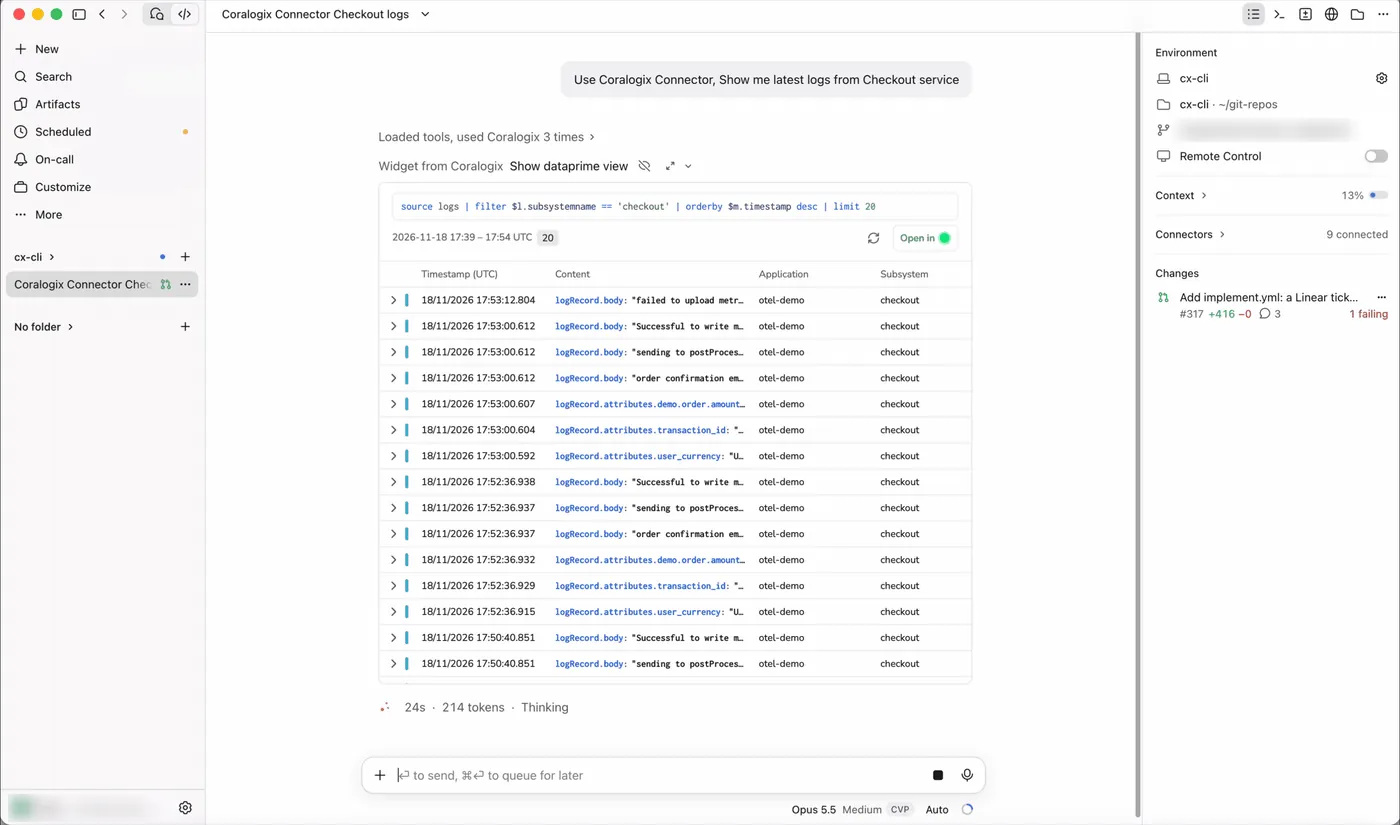
Shows the view under the step that ran the query, with the query, time range, and row count in its header.
The agent shows one view per answer. It skips the view for a single number, an empty result, a failed query, and intermediate steps of an investigation, so a long investigation does not fill the chat with frames.
Views
The view depends on the query the agent runs. More tools will get views over time.
| Query | View |
|---|---|
| DataPrime on logs | Log grid with Load more |
DataPrime with groupby, countby, or top N ... by | Chart, with a switch to a table |
| DataPrime on spans | Spans table with a trace waterfall and Load full trace |
| PromQL range | Time-series line chart |
| PromQL instant | Stat tiles, or a table for many series |
Logs
A DataPrime query on logs returns the Explore log grid. Each row shows the timestamp (UTC), a severity bar, the log content as key: value pairs, the application, and the subsystem.
Shows the log grid opening under the prompt, then loading older matching logs as you scroll.
- Select a row to open the full JSON of the log.
- Scroll to the bottom of the grid, or select Load more, to load older logs that match the same query.
Aggregations
A DataPrime query that aggregates, such as groupby, countby, or top 5 ... by, returns a chart. The chart follows the shape of the result, like Visualize as in Explore:
- One group key and one value: horizontal bars, sorted by value.
- A time bucket: a time series.
- Two group keys: clustered columns. When there are more than 12 categories or the names are long, such as error messages grouped by subsystem, the view draws one bar per row, colored by the other key.
Switches the error count by service between a bar chart and a table with the switches next to Open in.
Use the chart and table switches in the header to move between the two.
Spans and traces
A DataPrime query on spans returns a spans table with the timestamp, service, operation, span kind, resource, duration, and status. Select Traces in the header to group the spans by trace.
Opens the trace waterfall under the table when you select a span.
- Select a span or a trace to open its waterfall under the table. Select it again, or the close button, to close it.
- Select Load full trace to fetch the spans of the trace, up to 500. When the trace has more spans, or is too large for the view, the waterfall says
Showing N of M spansand links to the full trace in Coralogix.
Spans results without trace IDs, and top N ... by results on spans, show as a table or a chart instead.
Metrics over time
A PromQL range query returns a time-series line chart.
Charts the HTTP request rate per service over the last hour, and lists every series value under the pointer.
- Hover the chart to see the value of every series at a point in time.
- Select a legend entry to hide or show that series.
- Labels shared by every series appear once under the toolbar, and the legend shows the labels that differ.
Current metric values
A PromQL instant query returns one stat tile per series with its current value. When the result has more than 8 series, the view shows a sorted table with inline bars.
Lists the current pod count for each namespace as a sorted table with inline bars.
Work with a view
- Open in opens the same query and time range in Coralogix: Explore for DataPrime, and Metric Explorer for PromQL.
- The refresh button in the header runs the same query again.
- All times in a view are UTC, including the time range in the header.
- A view follows the light or dark theme of your AI tool.
- On narrow panels, such as a side bar, wide tables scroll sideways. No column is removed.
- When a result is very large, the view shows the first rows and the header says how many of the total it shows.
How it works
The MCP server serves each view as an MCP Apps resource. When your AI tool tells the server that it supports MCP Apps, the server gives the agent extra tools that show a view. The agent first queries the data, then shows a view when a view is the best way to present the answer.
AI tools that do not support MCP Apps never get these extra tools and receive the same text results as before.
A view uses the same MCP connection and permissions as the text answer, and no other service.
Limitations
- A view holds up to about 100,000 characters of data. Larger results are cut, and the header says so.
- Load full trace fetches up to 500 spans of a trace.
- Cursor versions earlier than 3.26 fold views into the collapsed Worked for N s block. Expand the block to see the view.
Troubleshoot
| Symptom | Cause | What to do |
|---|---|---|
| The agent answers in text and no view appears | The agent decided a view does not help, or your AI tool does not support MCP Apps | Ask for a view, for example Show it as a chart. If no view appears, check that your AI tool supports MCP Apps and that MCP Apps is available in your team's region. |
| The view does not appear in Cursor | Cursor before 3.26 folds the view into the Worked for N s block | Expand the block, or update Cursor. |
A trace waterfall says Showing N of M spans | The trace has more than 500 spans, or is too large for the view | Select the link to see the full trace in Coralogix. |
| A view looks different from these examples after an update | Your AI tool keeps the view it loaded for the current session | Reconnect the Coralogix MCP server, or start a new session. |
Learn more
Next steps
Explore every query and management tool the MCP server offers in the Tool catalog.