Visualize Traces
Overview
The trace drilldown view provides a comprehensive analysis of trace data, allowing you to understand and explore spans in detail. Each trace header highlights key metrics, including:
- Number of services represented
- Span depth and total spans
- Number of events
- Date and total duration of the trace
How to navigate
- Click on a span/trace of interest, for example in your Explore Screen, to view its underlying spans.
- Select your preferred visualization mode — Dependencies, Gantt, or Flame view — to explore varied views of the span data.
Note
To enhance performance, we only display spans within a 30-minute window before and after the timestamp of the selected span (or the root span in case of a trace). To obtain a different time range, contact our support team for a customized solution.
Dependencies view
Toggle between Service and Span views to view the communication between services or the span trajectory underlying an operation in your application.
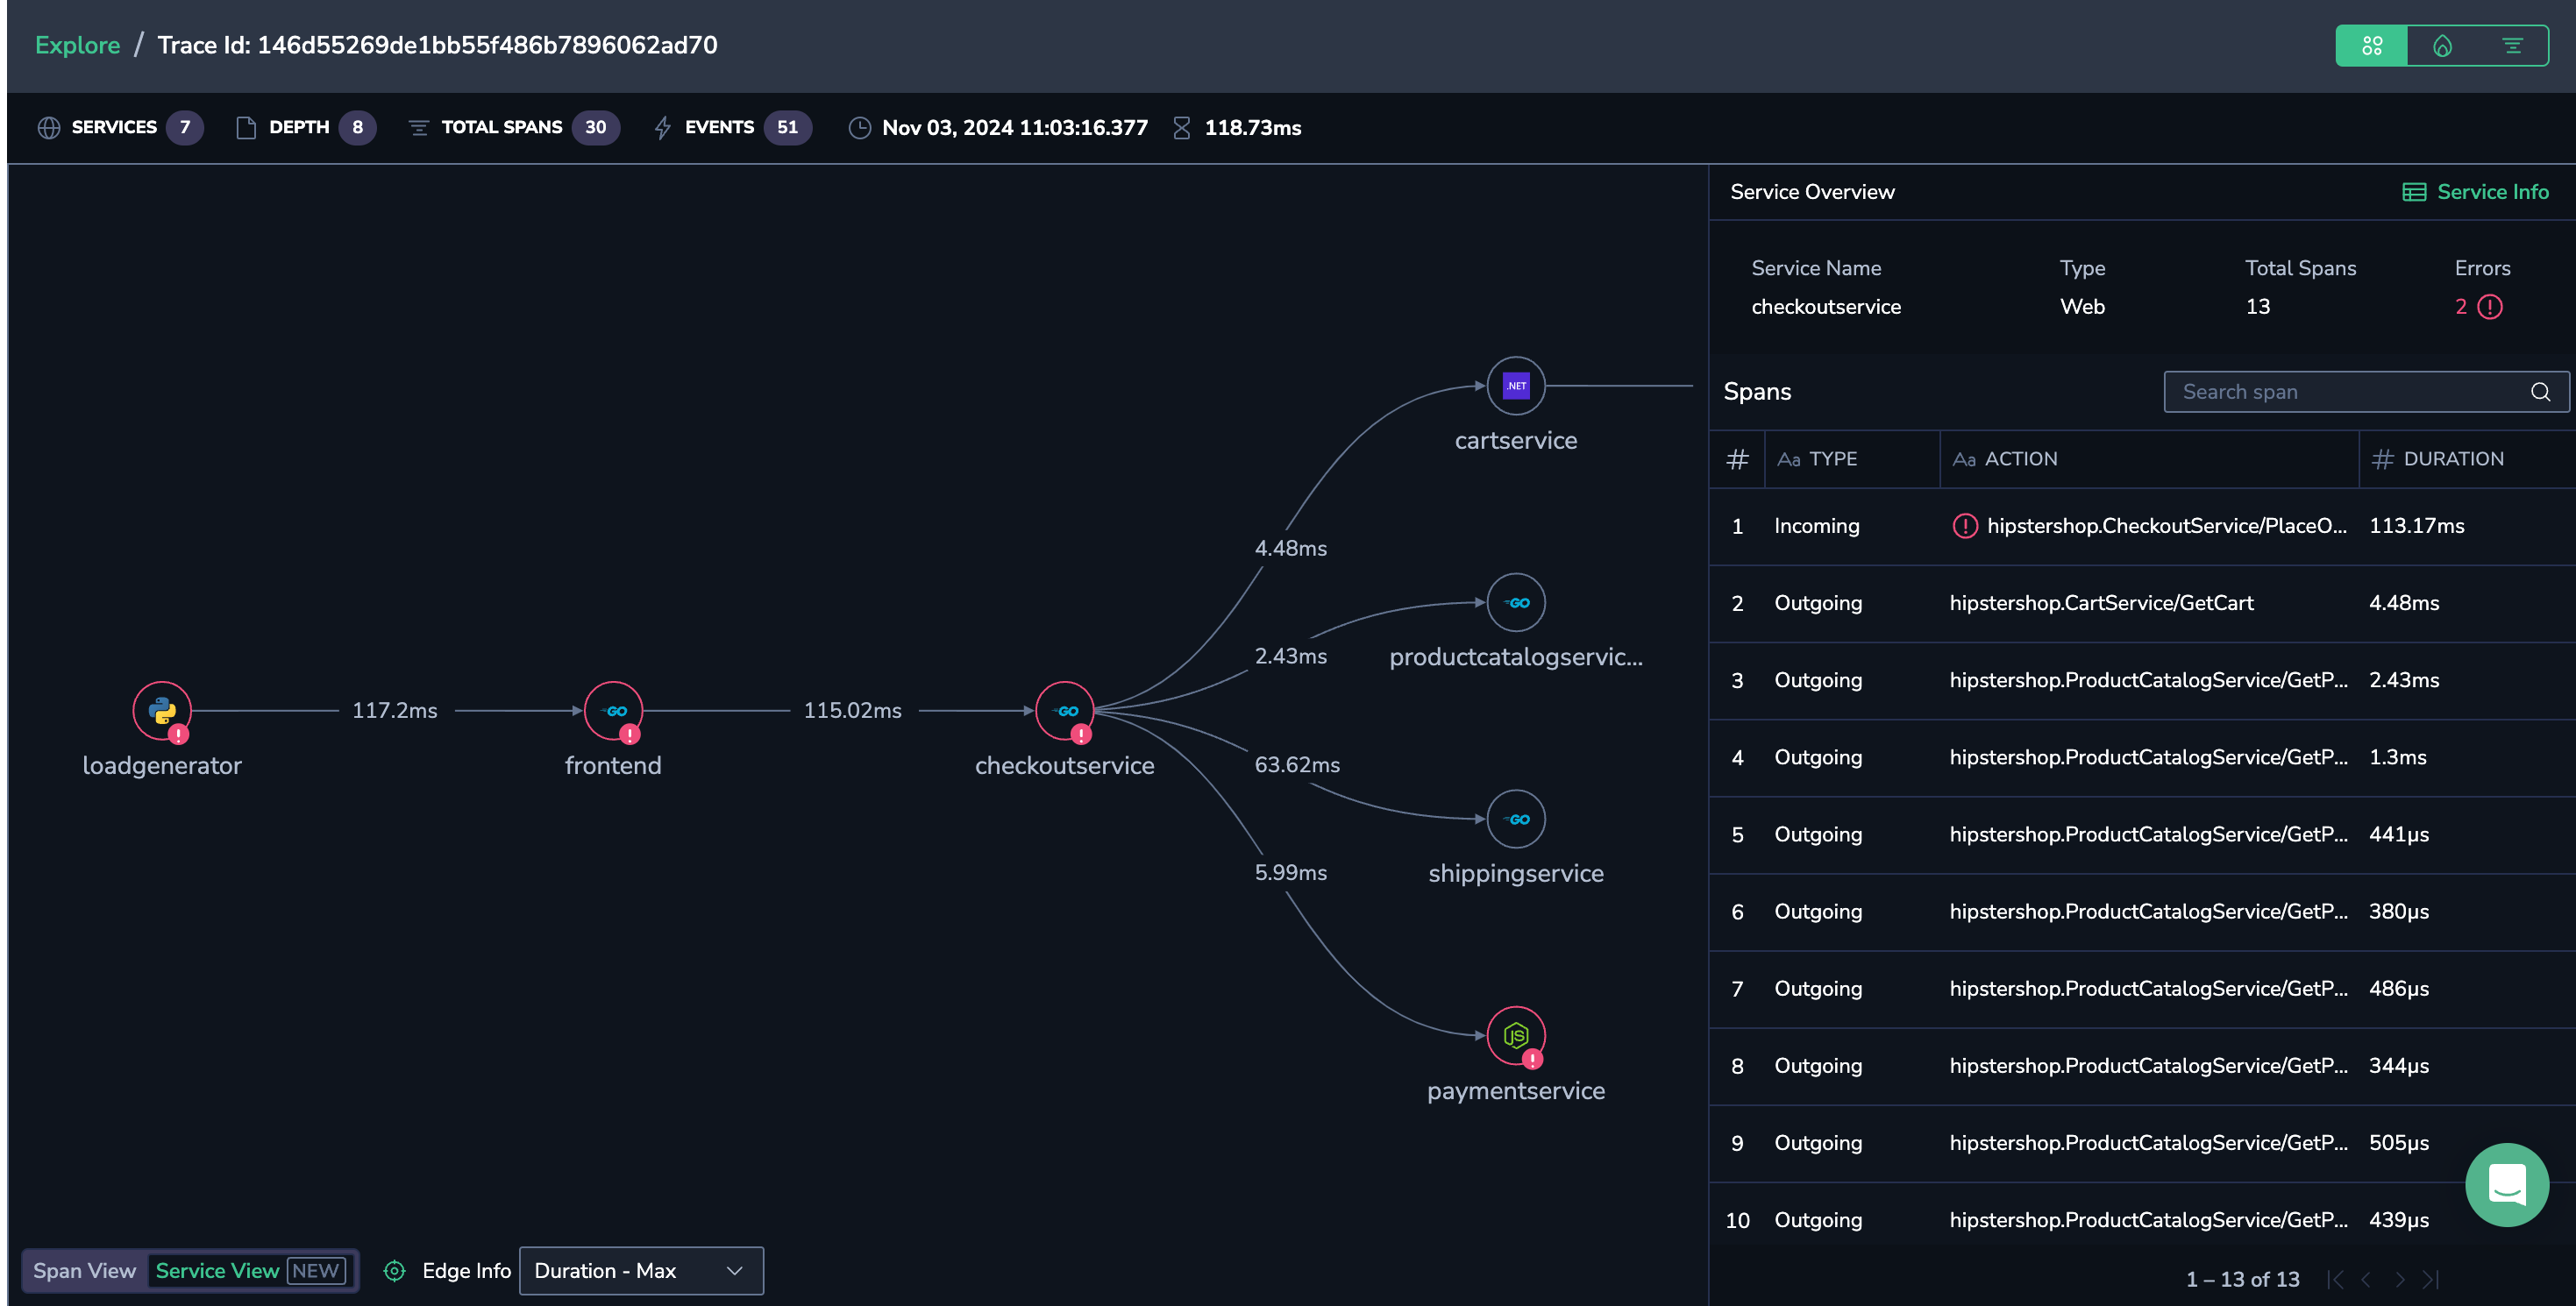
Service view
Visualize the relationship between services, understand the order of activities in a trace, and gain a clear picture of the application's architecture. On a high level, Service view will showcase how related operations across multiple microservices connect in a single trace and will display the entire route of any message sent through Kafka, RabbitMQ, SQS, and other message brokers.
To explore each step more fully, click on the relevant node to reveal all of a service’s spans (internal, incoming, and outgoing) in the right-hand Service Overview panel. Click on a specific span to view information about its service requests and responses, errors, span attributes, events, and correlated logs for the service operation.
Select the type of information to be displayed on the span edges in the drop-down menu on the bottom left of the screen (e.g., max span duration or number of calls per service).
Note that non-instrumented services are displayed with perforated lines and lack metadata.
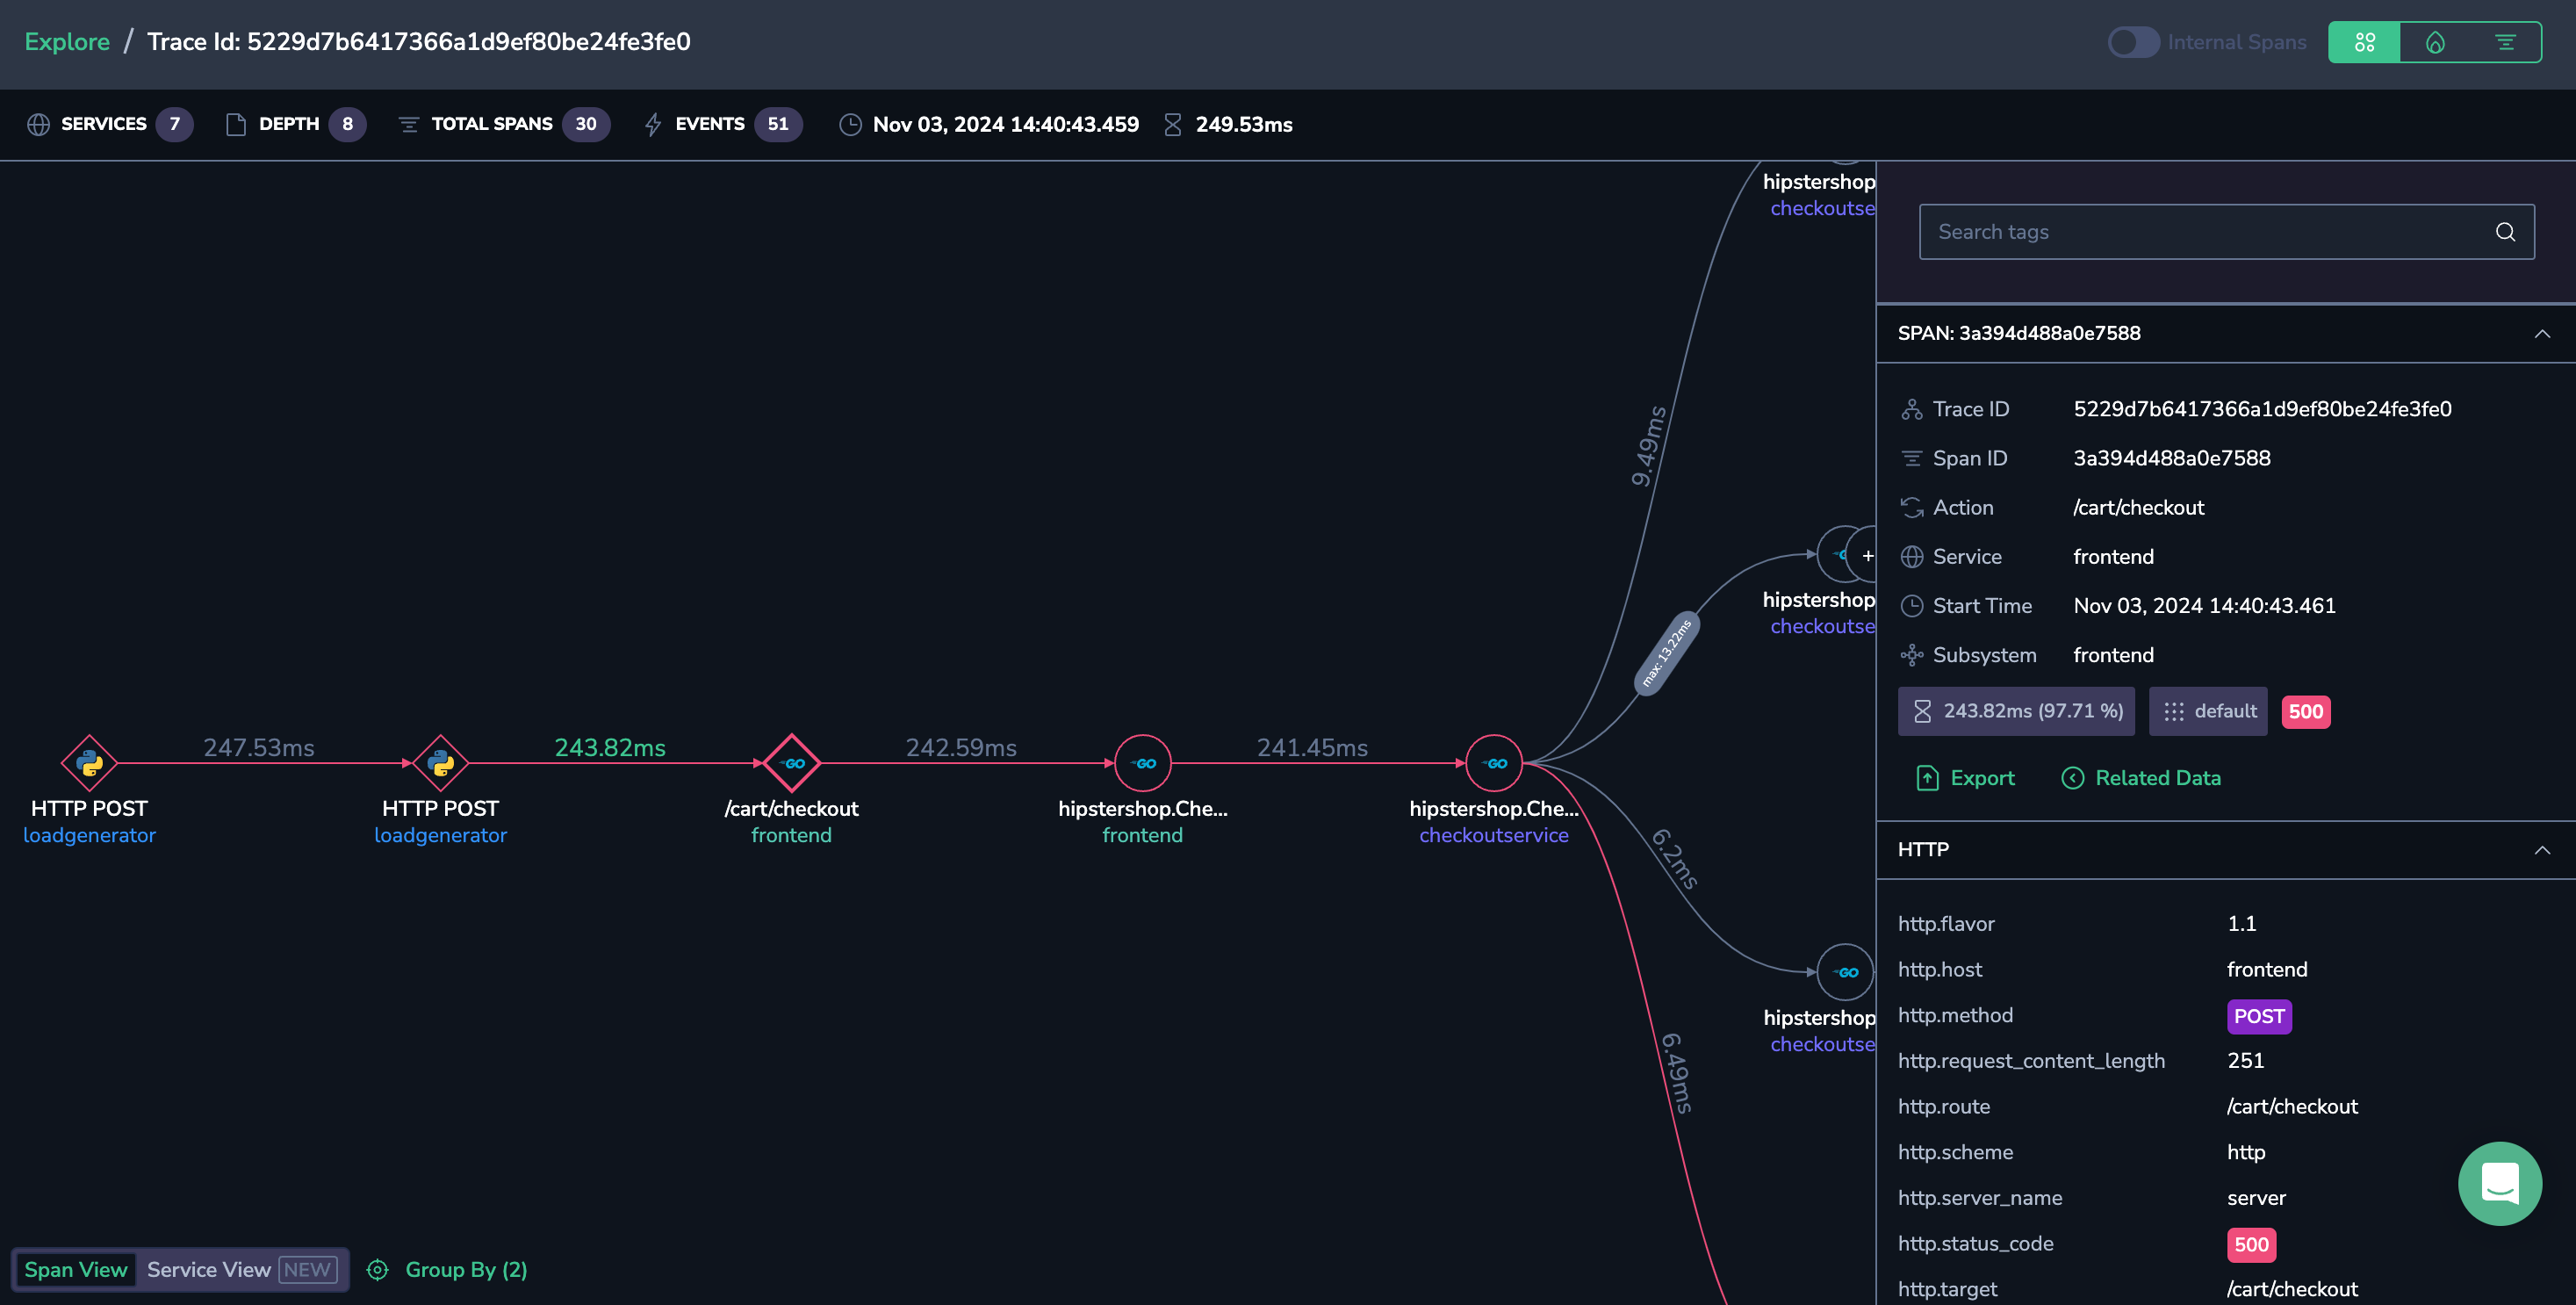
Spans view
View a mapping of the span trajectory for your trace.
Hover over a span action to view the service name, along with its operation name, application, duration, and subsystem.
Click on a span link to view all of the occurrences and their respective durations.
Select a tag from the GROUP BY menu in the bottom left-hand corner of the screen. When you select tags to group by, you must also select the aggregation type (min, max, avg, sum).
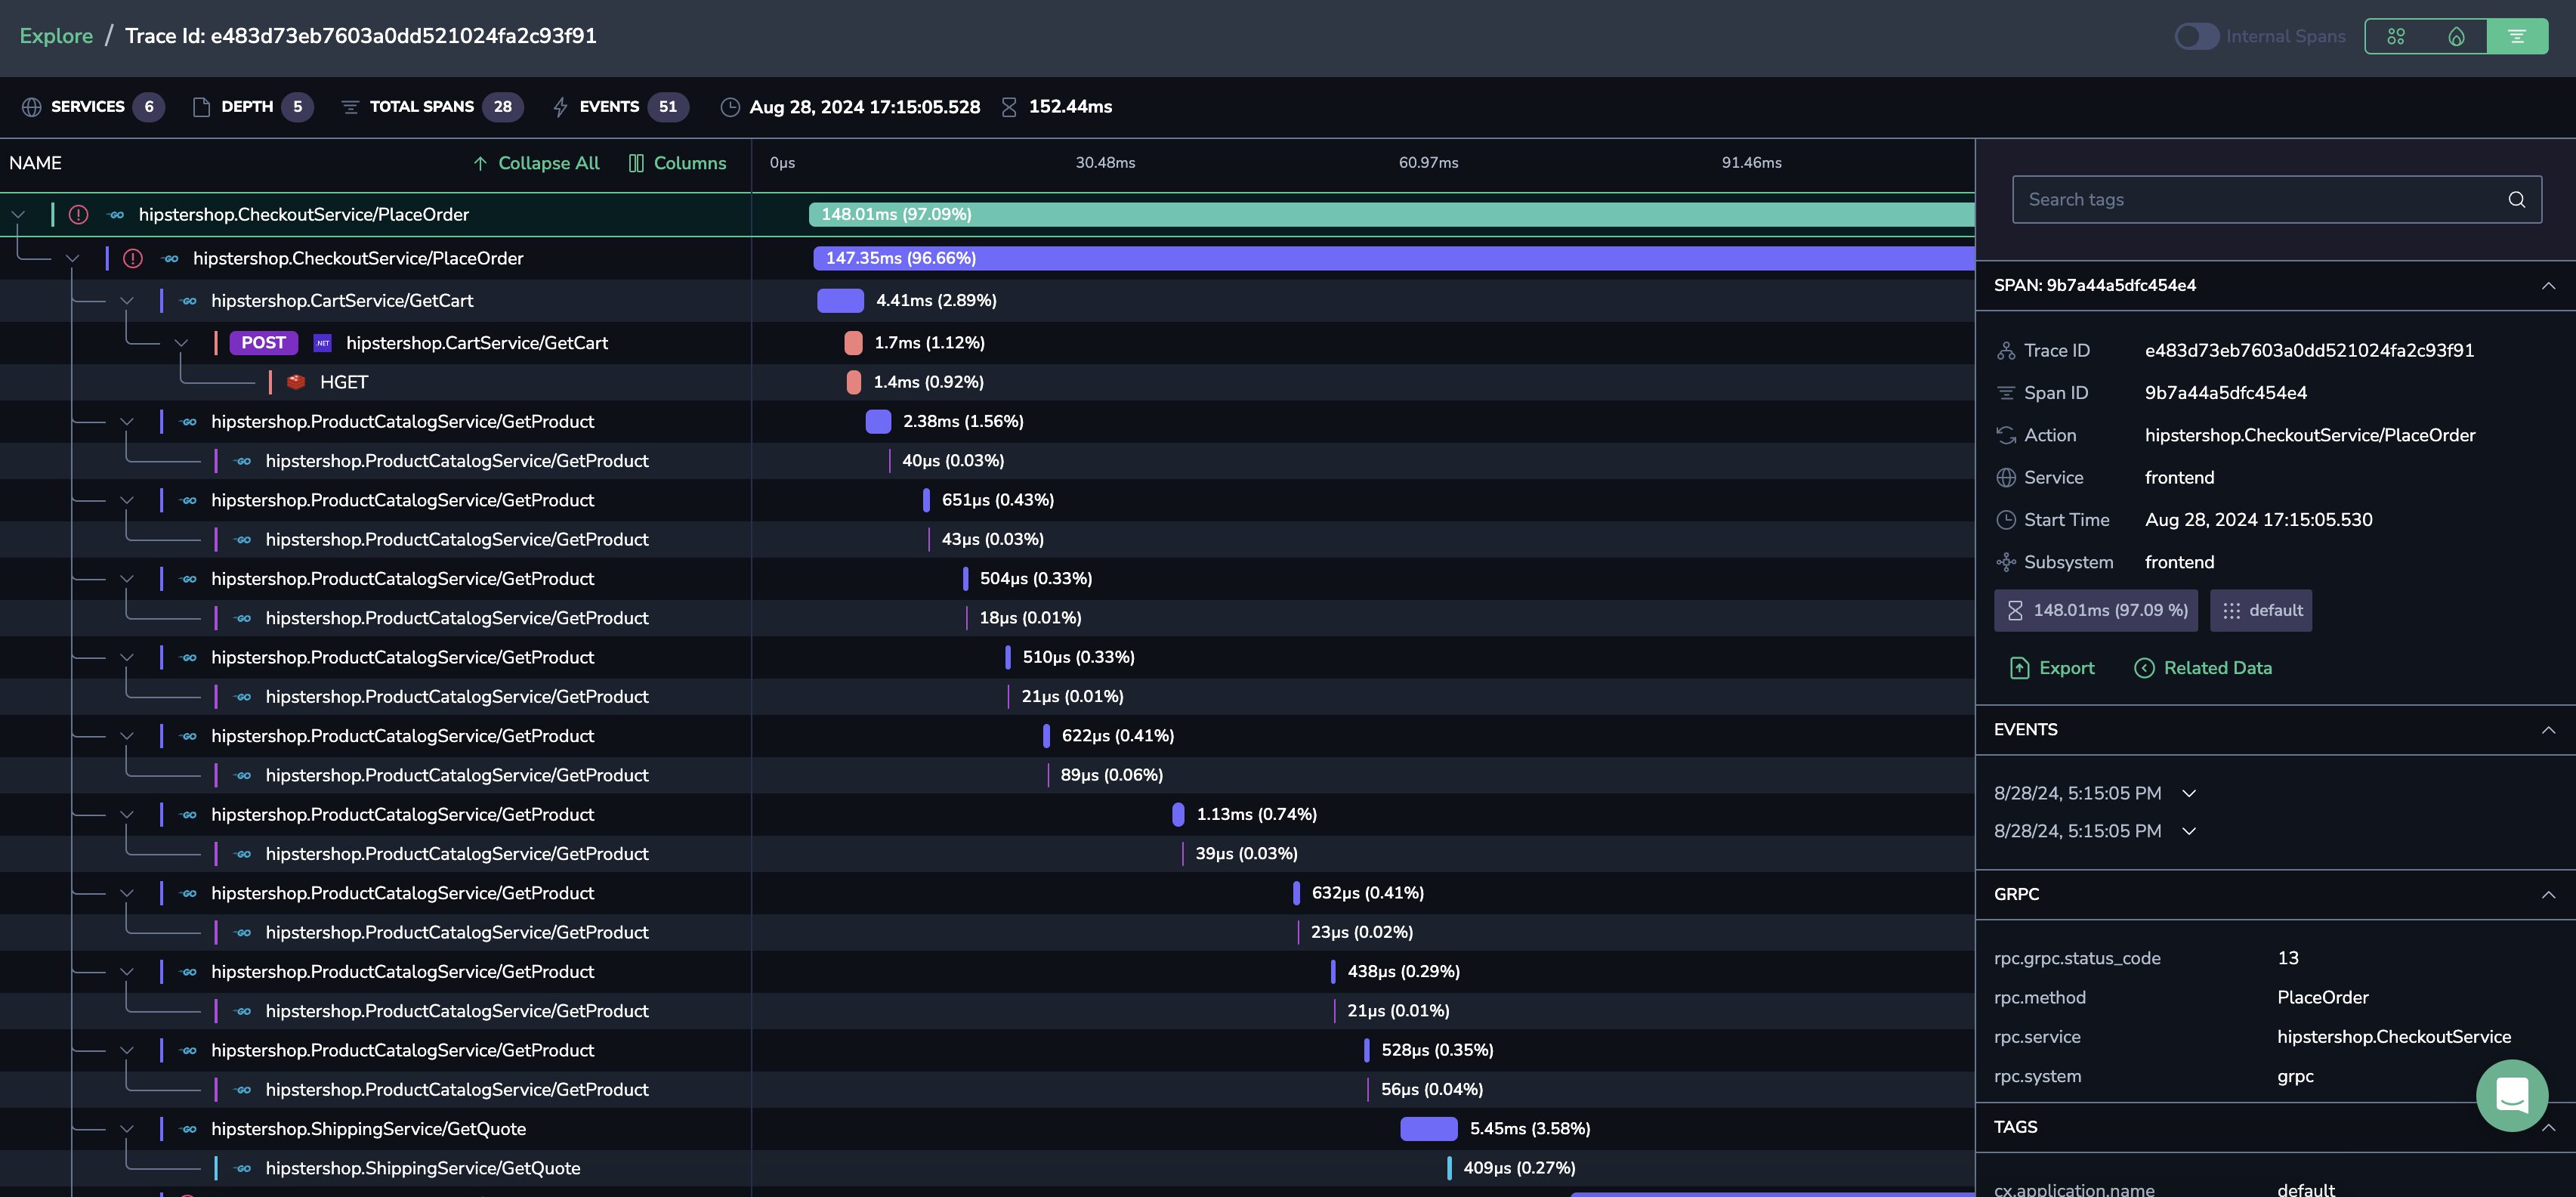
GANTT view
Visualize spans as horizontal bars along a timeline. The timeline illustrates the relationship between components and shows the sequence in which each activity occurred, along with its duration. This visual representation helps you quickly spot bottlenecks and delays that may be causing performance issues in your application.
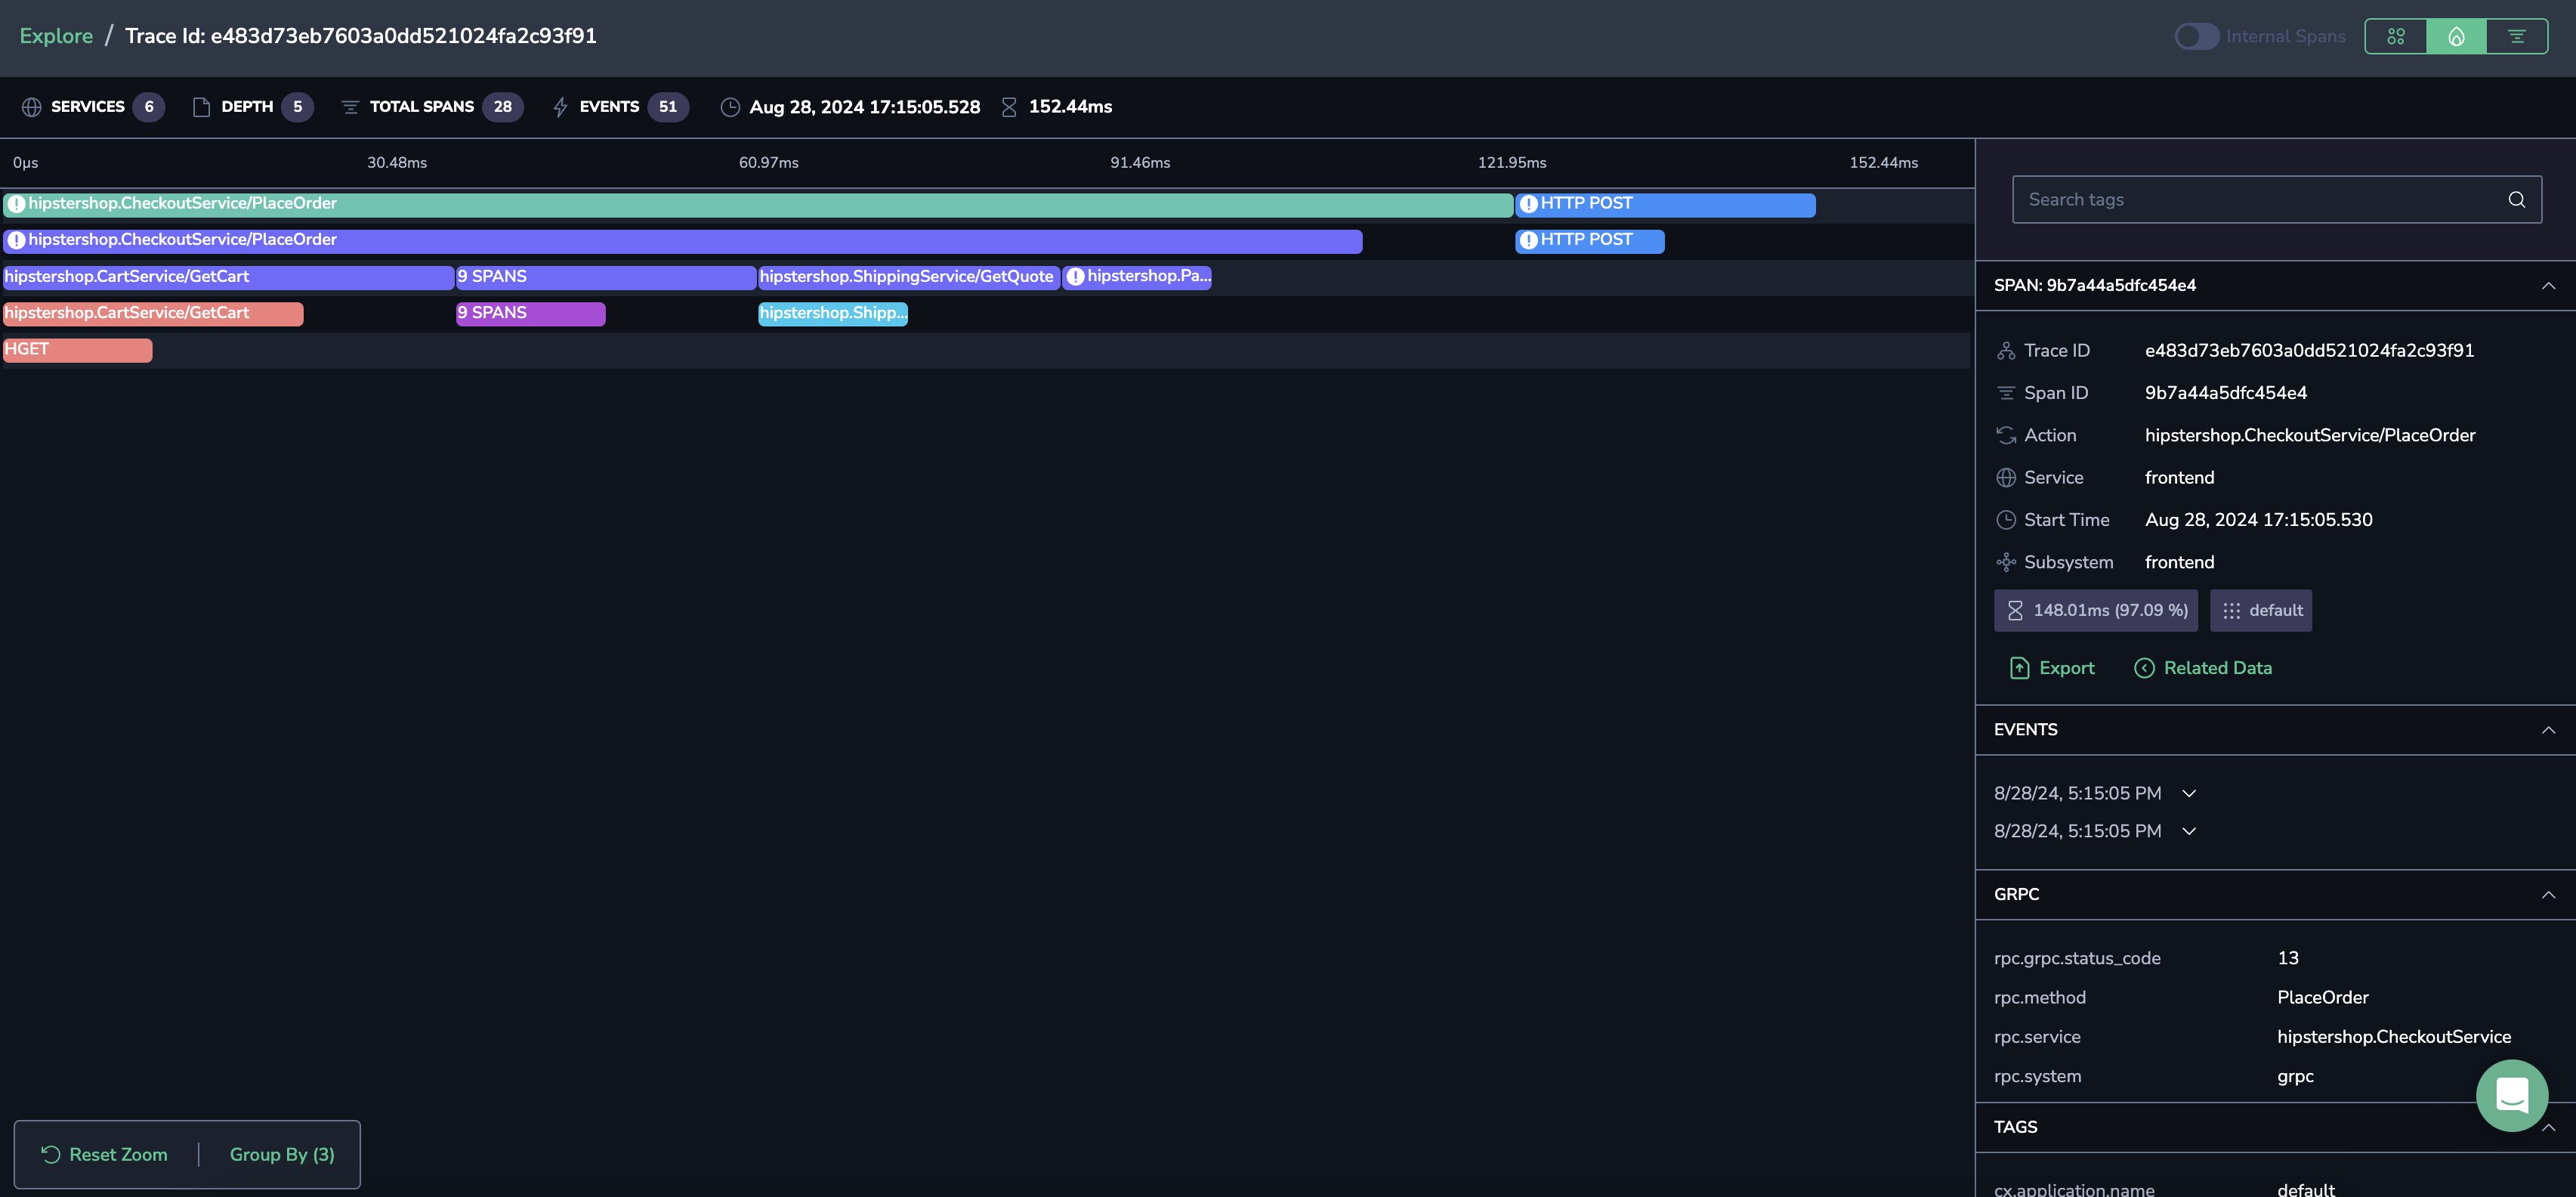
Flame view
View your trace’s spans as horizontally stacked rectangles, visually representing their duration and relationships within a trace.


