Filter with fields
Use the Fields panel to discover which fields exist in your current Explore results and to take common actions without manually typing field names into the query.
The Fields panel replaces the old "filters" concept, which was a closed list of predefined fields. Fields is an open list: it surfaces all detected fields from the current results, and lets you favorite the ones you care about most.
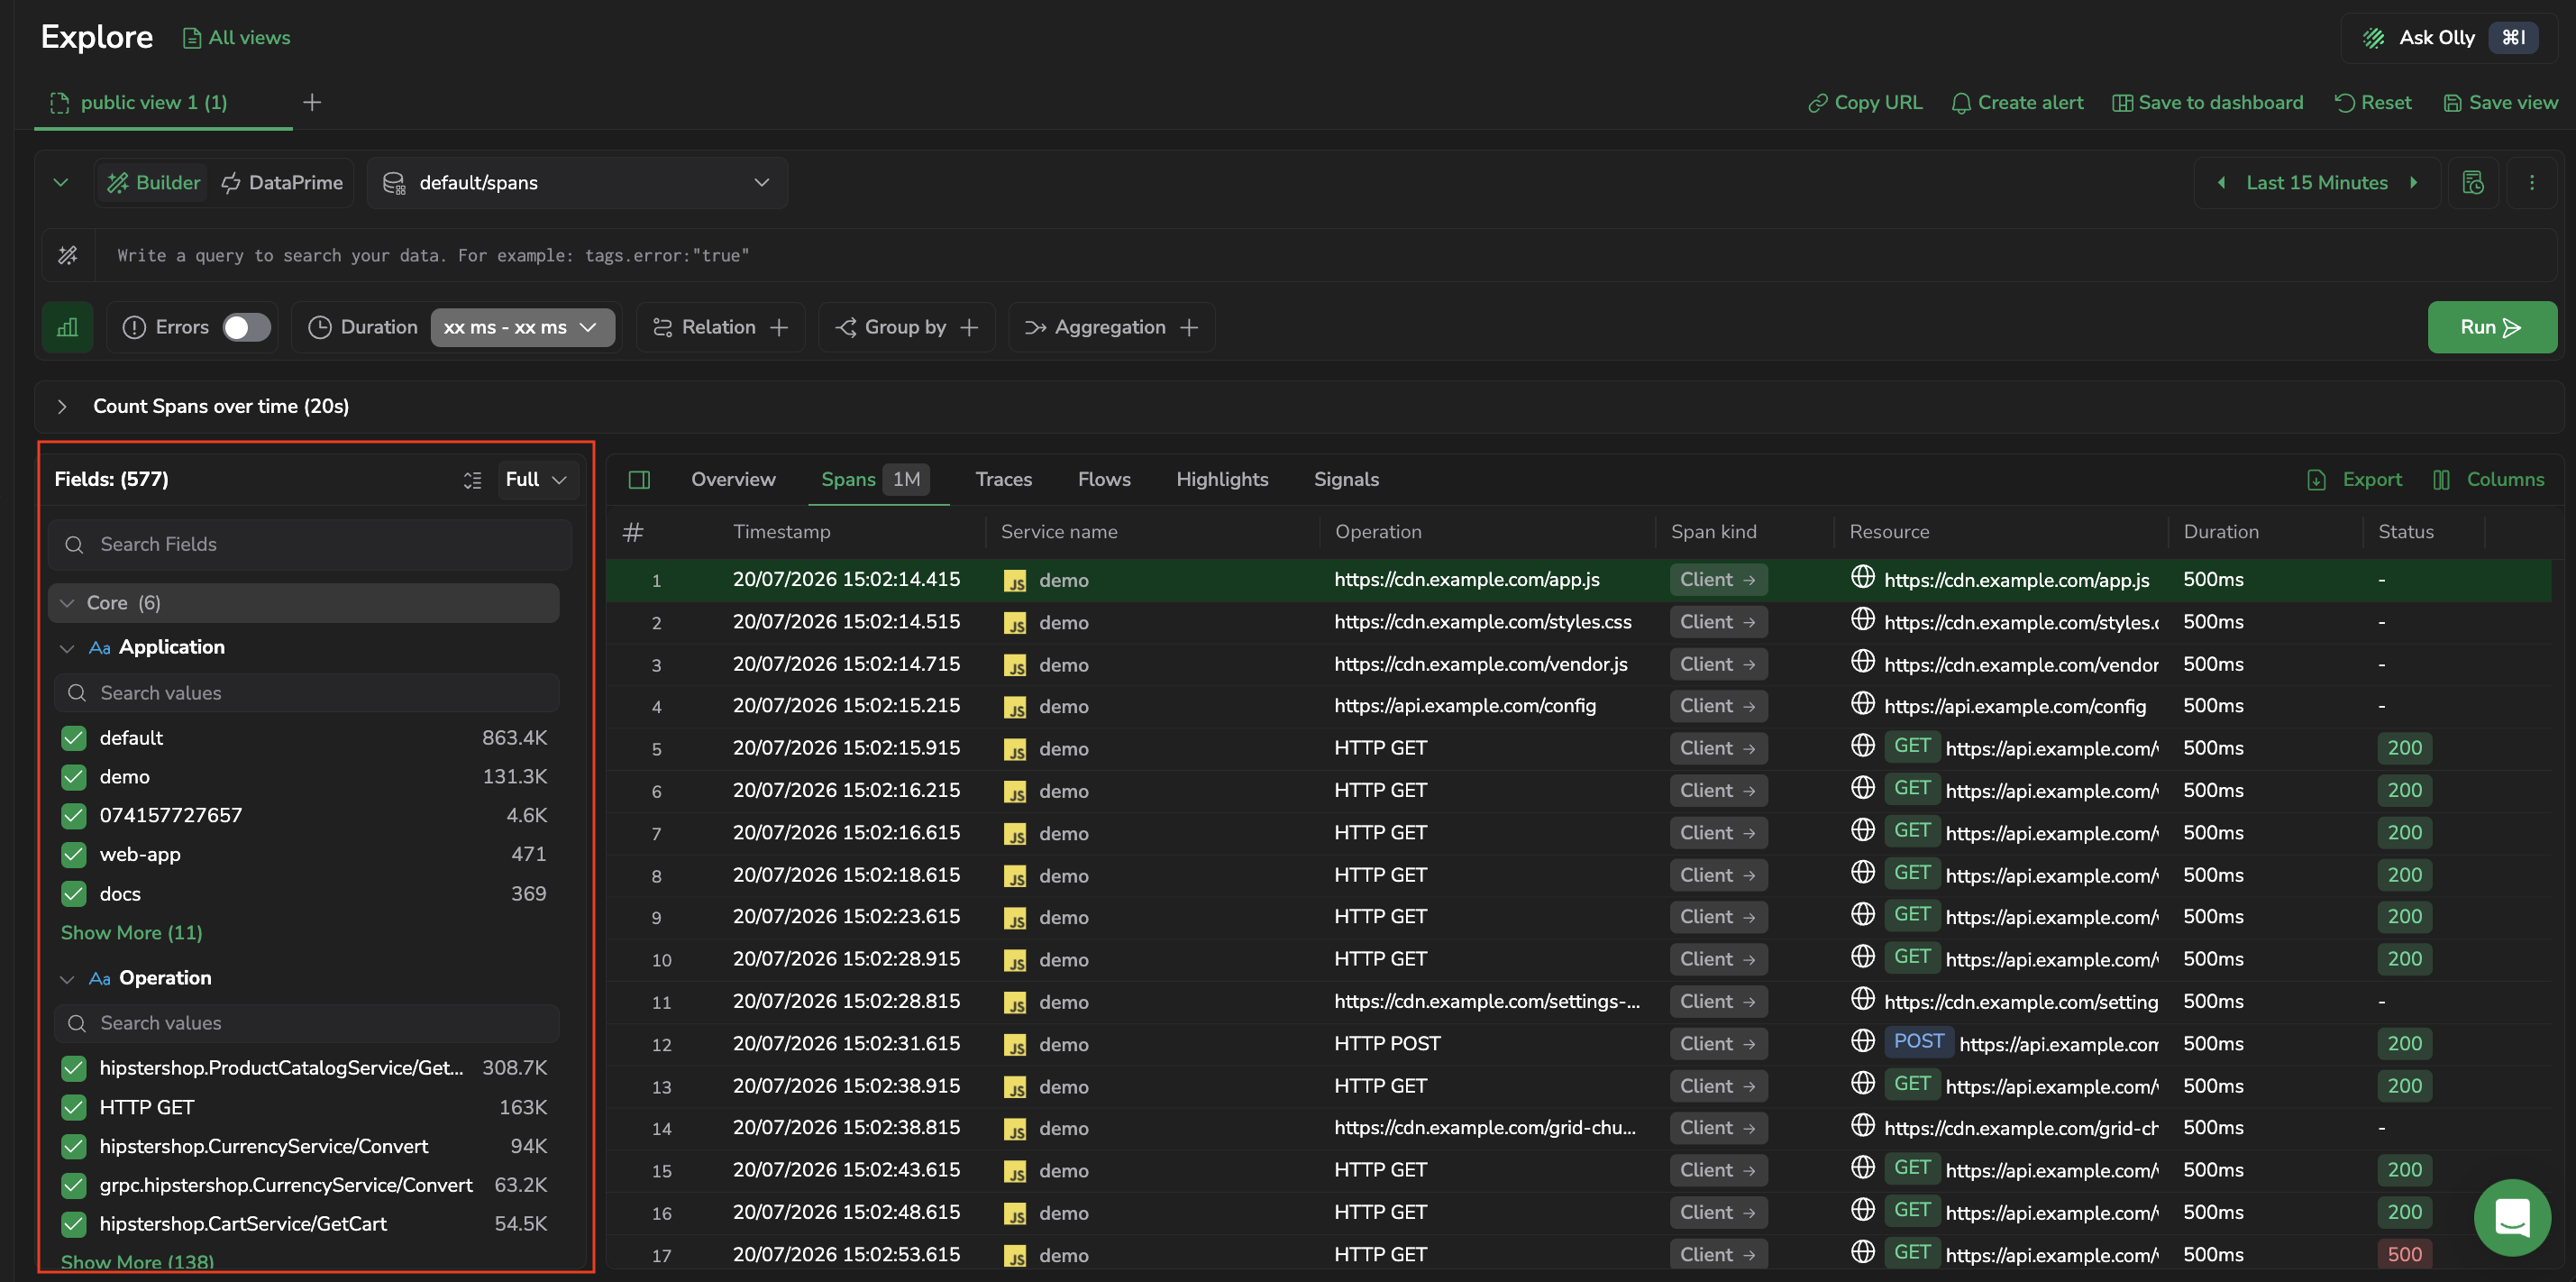
Open the Fields panel
Select the filter icon next to the query builder to open or close the Fields panel. After your first query on a tab the panel opens automatically. To close it, select the X in the panel header. Use the Expand all / Collapse all toggle in the header to open or close every section and category at once.
A strip of active-filter chips at the top of the panel aggregates the filters currently applied per field. Select Show in list on any chip to scroll to the matching field.
What a field is
A field is a key found in your logs. Each log event can include many fields, and the Fields panel lists those detected in the results you are currently viewing.
How the fields panel updates
The Fields panel reflects the current Explore context:
- Your query
- Your time range (for example, the last 15 minutes)
- The results returned for that context
As you change the query or time range, the panel updates to match the current results. It surfaces all detected fields from the current results, and lets you favorite the ones you care about most.
It does not represent every field across all historical logs.
Display mode
The Fields panel runs in Full mode by default. Full mode fetches and displays the full per-value counts and field statistics. The Fields panel keeps your choice for the current session. Fast mode skips per-value count statistics on first load so the panel stays responsive on large result sets — value distributions and field popularity are not fetched until you switch to Full.
Switch between Fast and Full from the mode select at the top of the panel.
How filtering works
Filtering is synchronized between the Fields panel and the query bar:
- When you add a field or value from the Fields panel, it is added to the query bar.
- When you edit the query bar, the Fields panel updates to reflect those selections.
This prevents mismatches where one UI control applies a constraint that the other does not show.
Field search flow
Goal: Allow the user to discover fields and add field-value filters to the query.
Use the following flow to find a field, select a value, and filter the results:
- Open the Fields panel.
- Search for a specific field by name.
- Add the field to the selected area.
- Select the field to expand it.
- Select one of the field values.
- Confirm that the value is added to the query.
- Run the query.
As you add or remove filters, the Fields panel and the query bar stay in sync, so you can validate what is applied from either place.
Panel sections
The Fields panel uses a tree structure. Expand any section to browse its fields, and expand a field to see its value distribution and statistics.
On the logs dataset, the Fields panel is organized into four sections:
Favorites
A personal list of fields you want to keep at the top of the panel, scoped per dataset.
- Select the star icon on a field to add it to favorites; select it again to remove it. Favorites pin to the top of the panel for quick access.
- Explore stores favorites per
(source, dataspace, dataset). Starring a field underlogsdoesn't pin it underspansor a user-defined dataset. - Favorites support "my fields" workflows, where different users care about different keys.
- A favorite that no longer appears in the current schema still renders in the Favorites list with its last-known metadata. Remove the pin to clear it from the list.
Metadata
Coralogix internal metadata fields. These fields align with how metadata is referenced in DataPrime queries (for example, metadata commonly appears under $m).
Metadata fields aren't broken out as key/value rows in the Log details panel — they appear only nested in the panel's JSON and Raw views. To view one in the table, add it as a column from this section — or search for coralogix. in the Logs tab's Columns panel. To query metadata programmatically, use DataPrime's $m.<field> access mechanism; see Access mechanisms.
User labels
Custom labels attached to your logs at ingest time. These fields align with the $l namespace in DataPrime queries.
All fields
All other detected fields from your log data.
Spans dataset sections
On the spans dataset, the Fields panel uses OpenTelemetry semantic-convention sections instead — Core, Exceptions, HTTP, gRPC/RPC, GraphQL, Messaging, Database, Cache, GenAI/LLM, RUM/Frontend, Object Storage, Serverless, Spark/Airflow/DBT, Infrastructure, Network, Runtime, Checkly, OTel, Events, CloudEvents, and Other. Favorites remain at the top of the panel and follow the per-dataset rule above.
Field actions
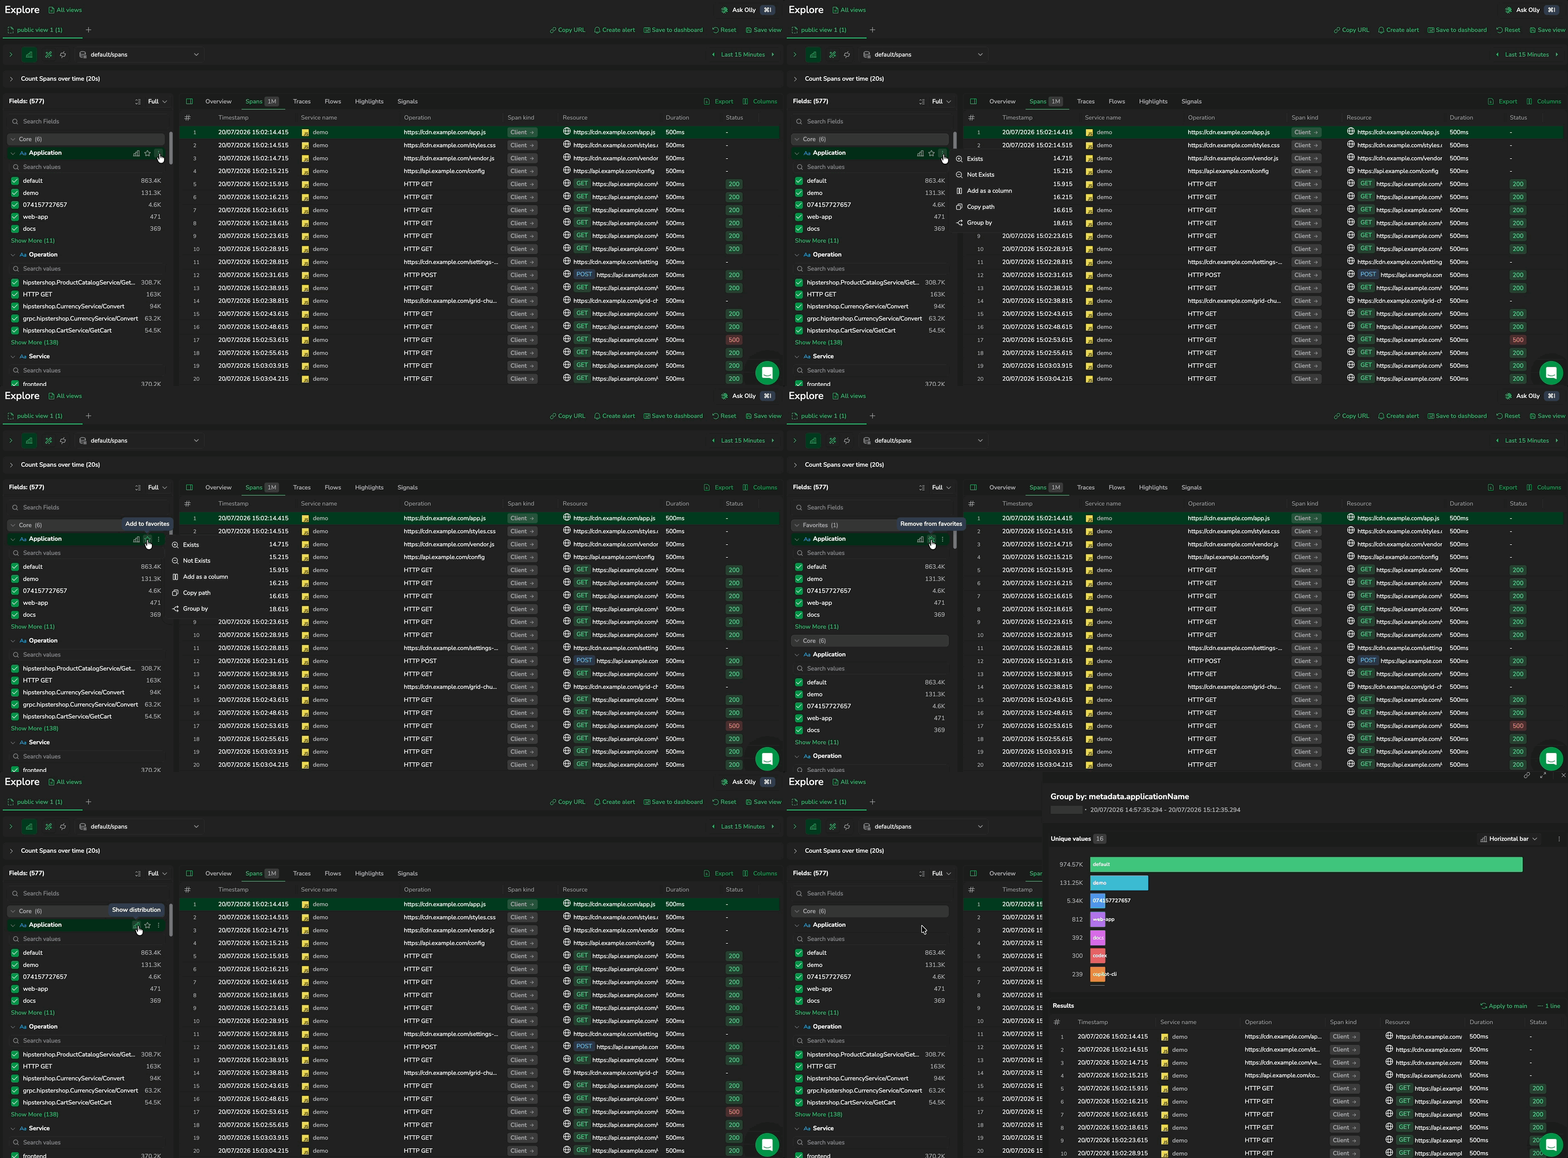
Open the more actions menu on any field for these actions:
| Action | What it does |
|---|---|
| Exists | Adds a field-existence filter on the current query (Lucene _exists_:<path>). |
| Not Exists | Adds a field-absence filter on the current query (Lucene NOT _exists_:<path>). |
| Add as a column / Remove from columns | Adds or removes the field as a column in the results table. |
| Copy path | Copies the field's full path (for example, coralogix.metadata.severity) to the clipboard. |
| Group by | Adds the field to the Grouped by clause in the query builder. See Group by for the resulting view. |
Each field also has a Show distribution icon and a favorite (star) icon on its row, separate from the more actions menu.
The menu's Exists / Not Exists are field-existence filters — they include or exclude rows based on whether the field is present at all. To filter on a specific value, expand the field and use its value rows, described in Filter by value.
Expand a field in the Fields panel to see its value distribution inline — the count of logs per value within the current result set, sorted by count (highest first). A small data-type icon next to each field name shows whether the field is string, numeric, boolean, or another type. Fields defined as reserved fields also carry a reserved label in the query builder's field suggestions. The distribution updates as you change the query or filters.
When the query updates, the per-value counts swap to a translucent skeleton while new counts load — value rows stay in place and don't reorder. The value list excludes the field's own selected values from its counts, so picking one value won't shrink the others away.
Long value lists paginate with Show more / Show less controls. The severity field is a special case: it renders color-coded swatches per severity value with no Show more control.
Filter by value
Expand a field and use the checkbox on each value row to include or exclude it. The Fields panel and the query bar stay in sync as you go:
- With no filter on the field, every value is checked. Clear a checkbox to exclude that value, and the query gains a matching exclusion clause.
- Select Only on a value to narrow the field to that value alone. This clears any other included or excluded values for the field and keeps just the one you selected.
- Once the field has an included value, selecting a checkbox adds that value to the set and clearing it removes the value. Clearing the last included value returns the field to its unfiltered state, with every value checked again.
The checkbox state is the filter state: a checked value is included, a cleared value is excluded. When a field is part of an OR group in the current query, its value checkboxes are disabled — edit the query directly to change how that field is filtered.
Show distribution
Select the Show distribution icon on a field to open a drilldown drawer that groups your current results by that field.
The drawer header reads Group by with the field name (for example, metadata.applicationName) and has two parts:
- Unique values: a chart of the field's distinct values, each with its count. It opens as a horizontal bar chart; use the chart-type dropdown to switch the visualization.
- Results: the rows that make up the grouping.
Use this to:
- Quickly assess the distribution of a field without building a full query
- Identify which values dominate a field
- Pivot into a subset without leaving your current investigation
Select Apply to main to carry the grouping into the main Explore view. This is the same drilldown drawer you get when you select a row in grouped results.
Group by
Select Group by to add the field to the Grouped by clause in the query builder. The table transforms from individual log rows into aggregated groups, showing each unique value and its count.
This provides a shortcut to group results by a field directly from the Fields panel without opening the Grouped by dropdown. After grouping, select any group row to open a drilldown panel for focused investigation of that group.
Field statistics
Each field shows the following statistics, calculated from the current result set:
- Field popularity: the percentage of logs in the current result set that contain this field. For example, if 20 out of 100 logs contain the
statusfield, its popularity is 20%. - Data type (shown as an icon next to the field name)
- Number of values
- Selected values indicator: shows the selected count alone when the field is collapsed and
selected/totalonce the field is expanded
Expand a field to see its value distribution: a breakdown of the count of logs per value within the current result set.
Example for the application field:
app1— 45 logsapp2— 30 logsapp3— 25 logs
Both field popularity and value distribution update dynamically when you change the query or time range.
Order within the panel
The Fields panel doesn't have a sort menu. Fields are grouped by section (Favorites, Metadata, User Labels, All fields on logs; OpenTelemetry semantic-convention sections on spans), and the All fields tree is organized by field path. Within an expanded field, the value list is sorted by count (highest first).
Troubleshooting
If adding a filter returns no results:
- The filter combination might be too narrow for the current time range.
- Remove one filter and reapply filters one at a time.
If a field does not appear in the Fields panel:
- The field might not be present in the current results for the selected time range.
- Widen the time range or adjust the query to bring relevant logs into the results.
If the Fields panel does not reflect the query you expected:
- Verify that the value you selected appears in the query bar.
- Clear and reapply the filter from either the query bar or the Fields panel.
Next steps
Write more advanced queries with Coralogix's pipeline syntax in DataPrime query.