Funnels
A funnel measures how users move through an ordered flow (the pages they view, the actions they take, and the conversions you care about) for example, view apm/service-catalog, then its drilldown/overview, then drilldown/logs. Product Analytics shows how many users reach each step so you can find and fix the point where a flow loses the most people.
A worked example: you ship a redesigned product page to replace an older one, and you want to know how many users land on the new page only to return to the legacy one. A funnel that steps from the new view to the legacy view puts that drop-off in front of you.
Funnels are built on the sessions, views, and actions your RUM SDK collects. See the data model for how these events work.
What you need
- The
PRODUCT-ANALYTICS:READpermission to view and build ad-hoc funnels. - The
PRODUCT-ANALYTICS:MANAGEpermission to save, rename, and delete funnels.
Build a funnel
- In Product Analytics, open the Funnels view, and select the application to analyze from the applications selector at the top.
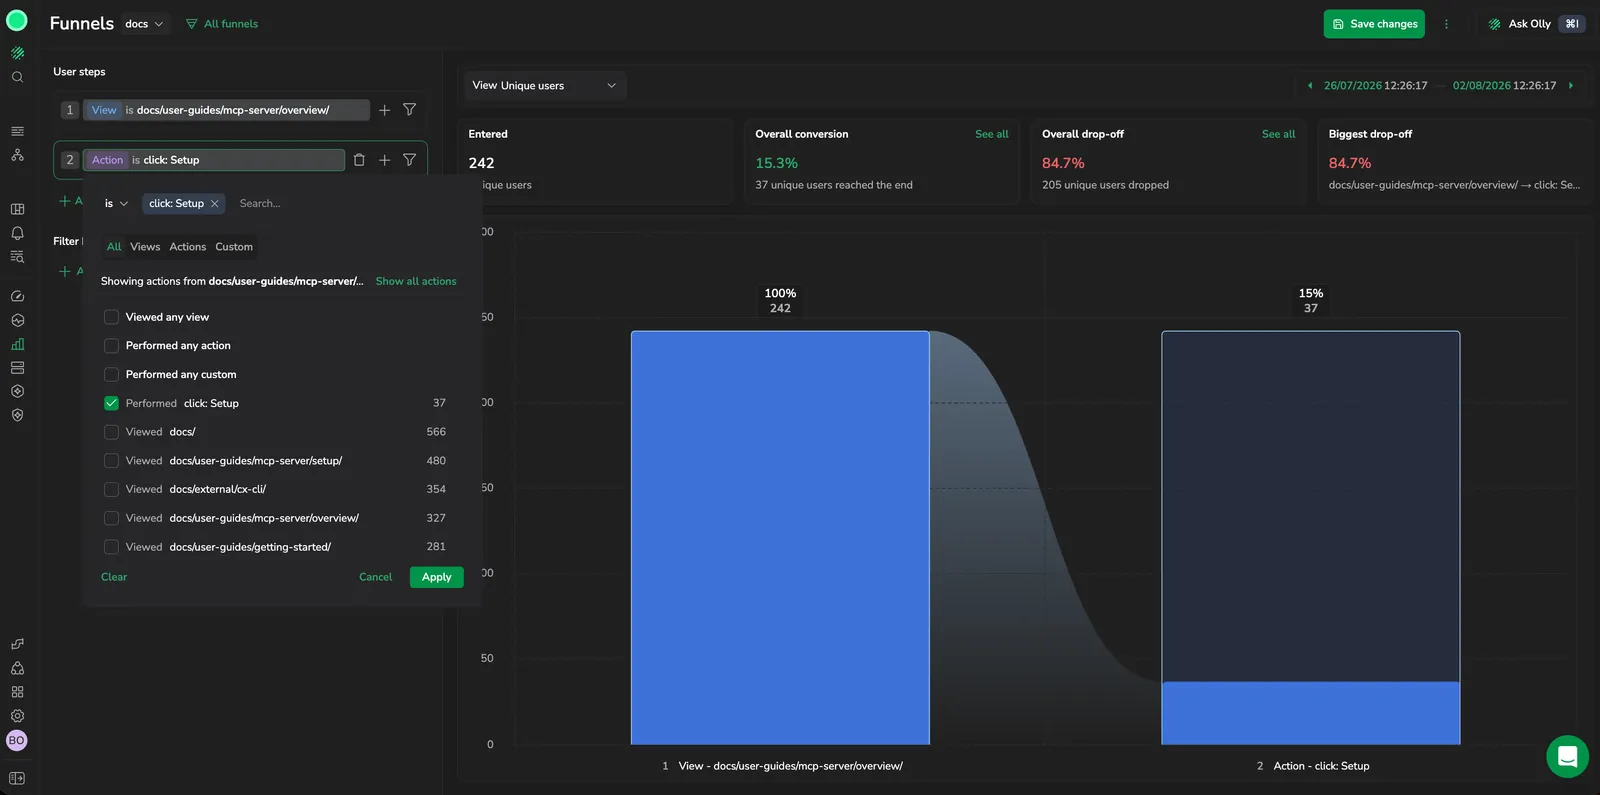
- Under User steps, select the step trigger (Select a step) to open the step picker. Browse the All, Views, Actions, and Custom tabs, or search for an event, then select it. A defined step reads as its type, an operator, and the event, for example
View is /home; change the operator to negate the match (is not) or use comparisons such as contains. The three event types are:- View: a page the user lands on, identified by its path.
- Action: a specific interaction on a page, such as a click.
- Custom: a custom event your application sends through the RUM SDK, such as
Hello World.
- Select Add step to add the next step, and repeat until the flow is complete. Add at least two steps to measure conversion from one to the next. Steps evaluate in order: a session must complete an earlier step before it counts toward a later one. Drag a step by its handle to reorder it.
- Set the period to analyze with the time range picker.
Actions are identified by the name the RUM SDK resolves for the element behind them. If the interaction you want to step through is hard to find, or carries no meaningful name, use the Coralogix Analytics Tool to see what the SDK reports for that element and give it a stable name.
The funnel renders as a conversion chart as you build it.
Filter a step
Each step can carry its own conditions, so it counts only when the view also matches a filter. Select the filter icon on a step and choose an attribute to constrain it. Available attributes include Browser, OS, Device type, Platform, Country, City, URL path, URL domain, URL host, Referrer URL, User email, Account ID, Account name, App version, and Environment. Select the values to keep (each value shows its event count) then select Apply. The step then shows the condition it carries, such as where Browser is Chrome, Edge, Safari, Firefox.
Combine events in a step

A step can accept more than one event as a match. Select the add (OR) control on a step to add an alternative, so the step is satisfied when the session matches any of the listed events. Use this when several pages represent the same intent, for example, two entry points that both start the same flow.
Filter the whole funnel
To filter every step at once rather than a single step, use Filter by below the steps and select Add filter. A funnel-level filter applies to all steps together.
Group by a session attribute
Break one funnel into a funnel per attribute value, so you can compare conversion across groups instead of reading it only in aggregate: the same flow per browser, per country, or per app version.
Under Group by in the step panel, select Add group by to open the attribute list. Search or scroll the list, then select an attribute. You group by one attribute at a time, and the remove (X) control on the committed row clears it. The available attributes are Platform, Device type, OS, OS version, Browser, App version, Environment, SDK version, Country, City, Continent, Account ID, and Account name.
You can group only on attributes that hold one value for a whole session. Page-scoped attributes such as URL path change from one view to the next, so they work as step filters but not as a grouping.
Three settings appear once an attribute is selected:
- Show top: how many groups to return, either 5, 10, or 20. Defaults to 5. Groups come back ordered by how many users or sessions reached the first step, so the largest groups are the ones you see.
- Stacked: draws one bar per step and splits its fill by group. Turn it off to get a separate mini funnel per group and compare their shapes side by side.
- Scale: switches the axis between Linear and Logarithmic. Use Logarithmic when one large group flattens the smaller ones into an unreadable sliver.
Changing the attribute or Show top re-queries your data. Stacked and Scale only change how the same result is drawn, so switching them costs no query and doesn't mark a saved funnel as changed.
Hover over a group to trace its own flow across every step as a highlighted ribbon while the other groups fade, so you can follow a single value end to end.
A group's conversion rate is relative to the users who entered that group, not to everyone who entered the funnel. Per-group counts therefore won't sum to the numbers the same funnel reports ungrouped. When you measure by unique users, a user whose sessions carry two different values is counted once in each group, so the grouped totals can come out higher than the ungrouped user count.
Sessions with no value for the attribute form their own group, labeled (not set). That group is a real answer, the sessions with no account or no detected city, rather than a set of dropped rows.
Read the conversion chart
Summary cards above the chart give the headline numbers at a glance: Entered (how many reached the first step), Overall conversion (the share that completed every step), Overall drop-off (the share that didn't finish), and Biggest drop-off (the step that loses the most people).
When a grouping is active, these cards give way to a comparison of the groups: Best converting and Worst converting name the highest and lowest converting group with its rate, and Conversion gap reports the difference between the two.
Each step appears in order as a bar labeled with the share that reached it relative to the first step, along with the absolute count, for example 100% / 26, then 42% / 11, then 4% / 1. The shaded curve between bars shows the drop-off from one step to the next, so you can spot the steepest decline at a glance. Hover over a step to see its event and count.
Drill into a step
Select a converted or dropped-off region of a step in the chart to open a drilldown drawer for that step. Switch between Total converted (users who moved on to the next step), Total dropped off (users who dropped anywhere up to this step), and Step dropped off (users who dropped at this step). Select See all to list the individual users behind a group under Users, up to 100, where each row shows the User, Account, Session date, Platform, and Country. Select the play icon at the start of a row to open that user's session in Session Replay; the icon is greyed out and reads No session replay where no recording exists. Select Download CSV to export the list, which also carries the user's name, email, and ID, and the account name and ID, as separate columns.
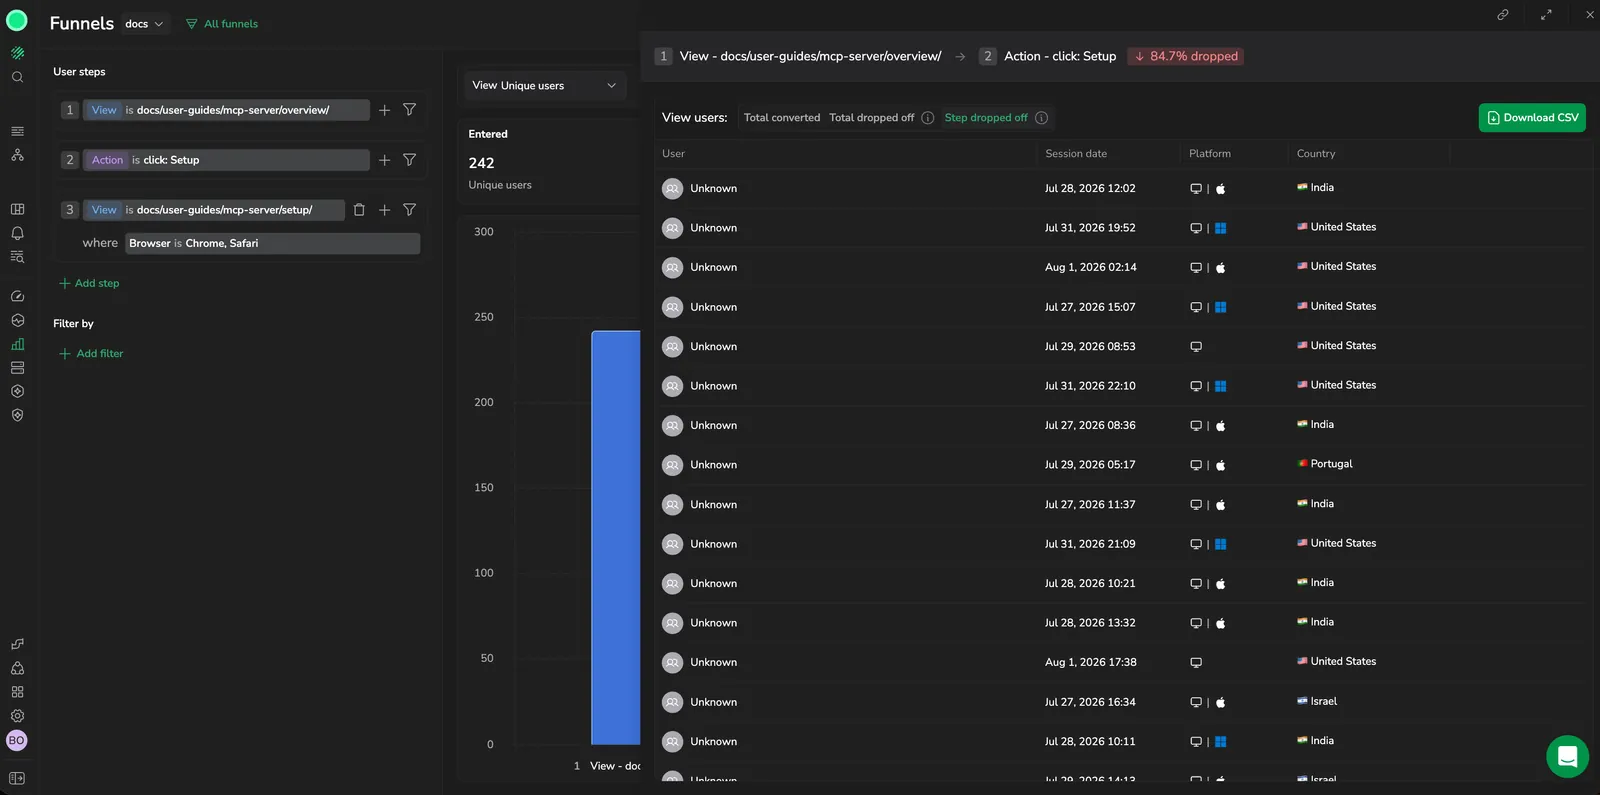
On a grouped funnel, selecting one group's region scopes the drilldown to that group. The drawer carries a badge naming it, such as Browser: Chrome, and the user list covers only that group. Selecting the shared drop-off region of a stacked bar carries no group and opens the drilldown for the step as a whole. The (not set) group can't be drilled into, because it has no value to filter the users by.
Measure by unique users or sessions
A funnel can count progress two ways. Switch between them with the View control at the top of the chart:
- Unique users counts each person once, no matter how many times they ran the flow. Use it to answer "how many people completed this?"
- Sessions counts each visit separately, so one user who returns across several visits contributes more than one. Use it to answer "how many attempts completed this?"
The two can diverge sharply for flows people repeat, a single determined user who retries across many sessions inflates the session count but counts once as a unique user.
Save and reuse a funnel
Once a funnel is useful, save it to keep its steps, filters, and grouping as a reusable configuration, name it on the first save with Save as, and use Save changes to update it afterward. A saved funnel reproduces the attribute it was grouped by and its Show top limit, along with whether it measured unique users or sessions. Stacked and Scale are display choices rather than part of the funnel, so they aren't saved with it. Open All funnels at the top of the panel to load a saved funnel, adjust its steps and save again, rename it, share it by copying its URL (Share funnel URL), or delete it when it's no longer needed.
A saved funnel is visible to everyone with the PRODUCT-ANALYTICS:READ permission. Per-funnel access controls are forthcoming.
Export a funnel
Select Export from the more actions menu in the funnel header to download the current view (the summary cards and conversion chart) as a PNG image, named after the funnel.
Start a funnel from a heatmap
You can also begin a funnel from a heatmap: from an element on the page, start a funnel seeded with the first steps, then refine the steps here in the Funnels view.