AI observability
OpenAI API Platform Compliance dashboard
A new compliance dashboard under AISPM → Code Agents gives security teams a governance view of every project, API key, service account, and role in your OpenAI API Platform organization. It runs on the same OpenAI Usage & Cost integration as the API Platform analytics dashboard, so connecting one read-only Admin API key enables both. Key insights call out idle API keys that still work, projects that can call any model, rate limits that were never configured, mutual TLS that is not enforced, and client certificates that expire within 30 days. Track charged cost over time with a per-model breakdown, filtered by project. Review every project API key, service account, and admin key with owner, status, created and last-used dates, roles, permissions, and rate limits. See each project's model access, hosted tools, data retention, certificates, and permissions, with projects that have no model allow-list flagged as Unrestricted. Learn more
Onboard an AI application to AI Center with your coding agent
Install the coralogix-ai-center skill (npx skills add coralogix/cx-cli --skill coralogix-ai-center) and ask your coding agent to instrument your GenAI application, with no hand-wired OpenTelemetry. It works for any language, LLM provider, and framework, whether your app has no OpenTelemetry yet or already exports through a production collector. The skill doesn't stop at writing code: it runs a real interaction through your app and uses the cx CLI to check the result against live AI Center data, covering the gen_ai.* semantic-convention attributes, prompt and response content on the spans, cost enrichment, and the application appearing in the Application Catalog. It keeps fixing and re-running until every check passes. Learn more
Global AI Explorer across all your AI applications
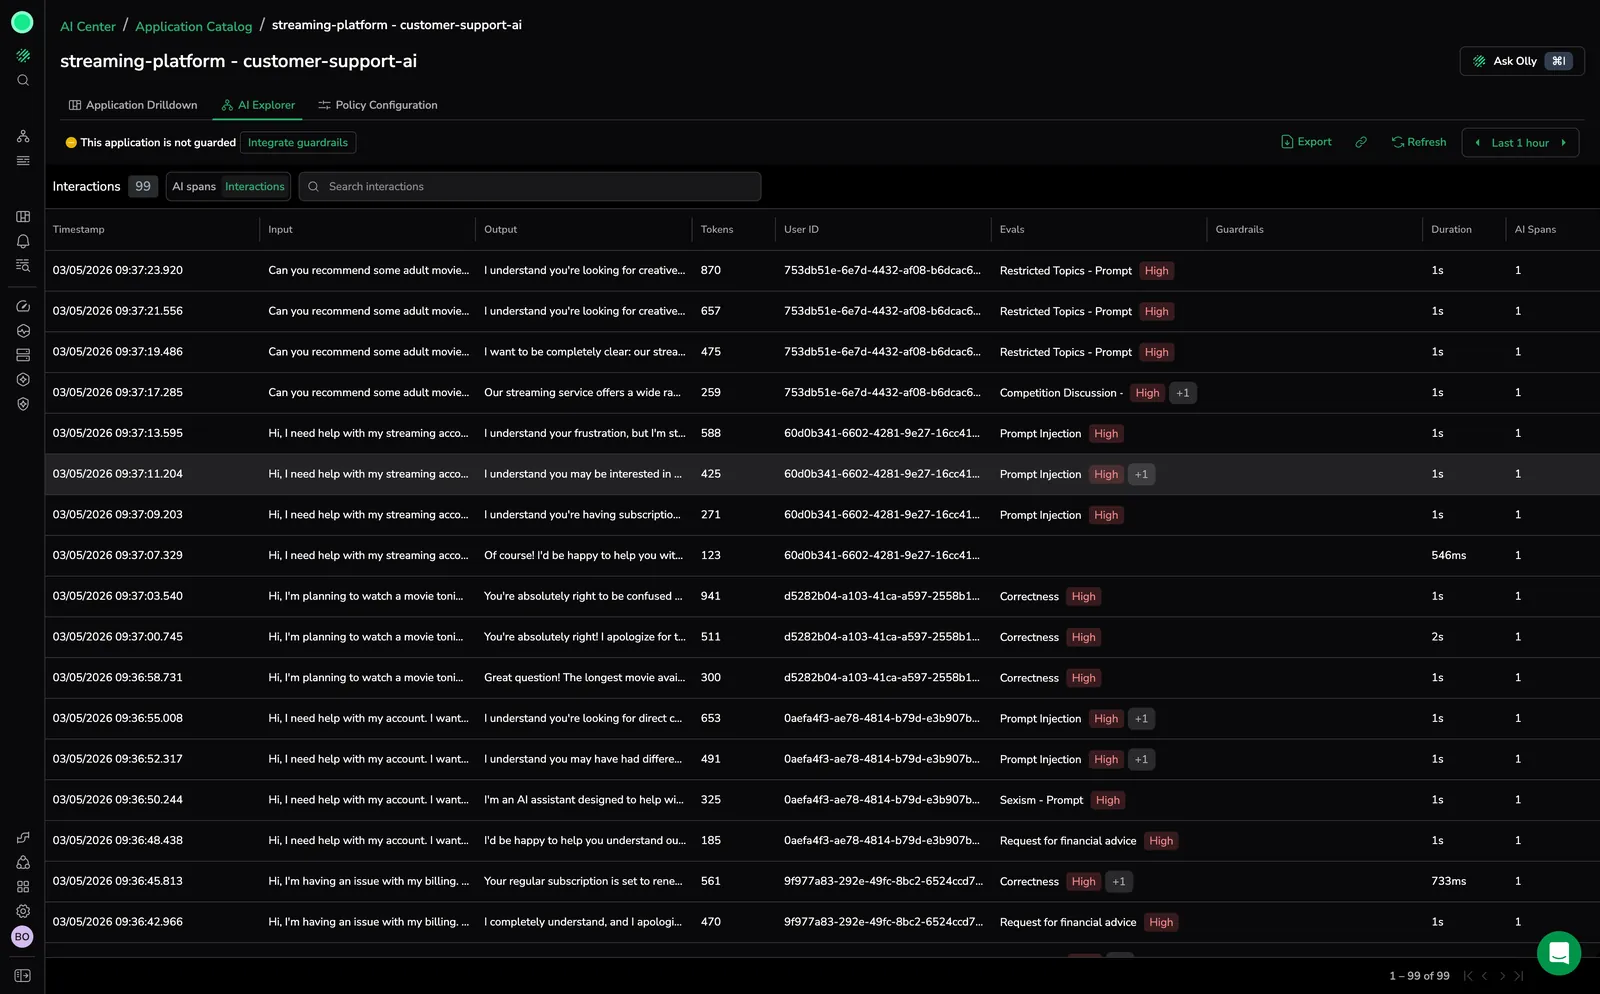
A new AI Explorer tab under AI Apps lists interactions from all your applications in one table, so you no longer open each application's explorer and recreate the same filters to compare them. Selecting a widget on the AI Center Overview now opens this global AI Explorer with the matching filter or sort and your time range applied, while selecting a widget on an application's own overview keeps you scoped to that application. Learn more
OpenAI API Platform dashboard
AI Center now has a usage and spend dashboard for your OpenAI API Platform organization, built on the openai_administration_* metrics from the OpenAI Usage & Cost integration. Key insights call out spend approaching your organization's spend limit, week-over-week spend increases, projects running without a spend limit, and context that is resent instead of cached. Track tokens and cost over time with period-over-period changes and a per-model breakdown; see each project's members, API keys, models, and charged cost, and whether a spend limit is configured and enforced; explore and export a table of project API keys, service accounts, and admin keys with owner, status, requests, tokens, and list cost; and follow usage of embeddings, images, speech, transcriptions, moderation, web search, and file search. Learn more
Code Agents Alerts extension
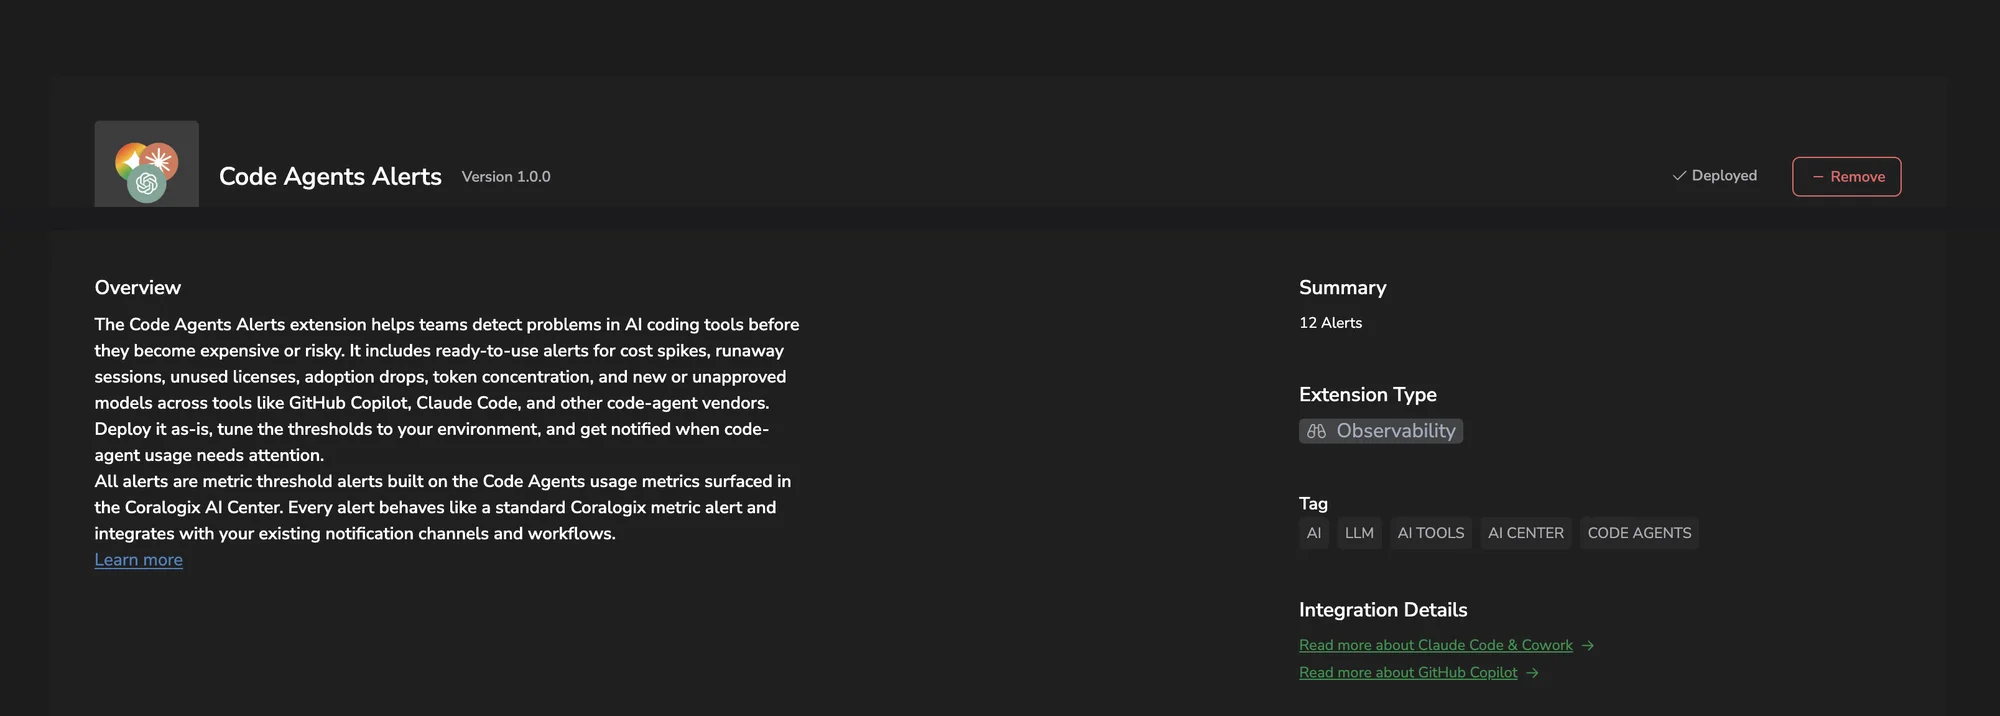
Deploy 12 ready-to-use metric threshold alerts for Claude Code and GitHub Copilot in one step. The Code Agents Alerts extension catches cost spikes, runaway sessions, unused licenses, adoption drops, and unapproved models, using the same deploy-and-tune workflow as any other Coralogix extension. Learn more
Claude Cowork monitoring on third-party platforms
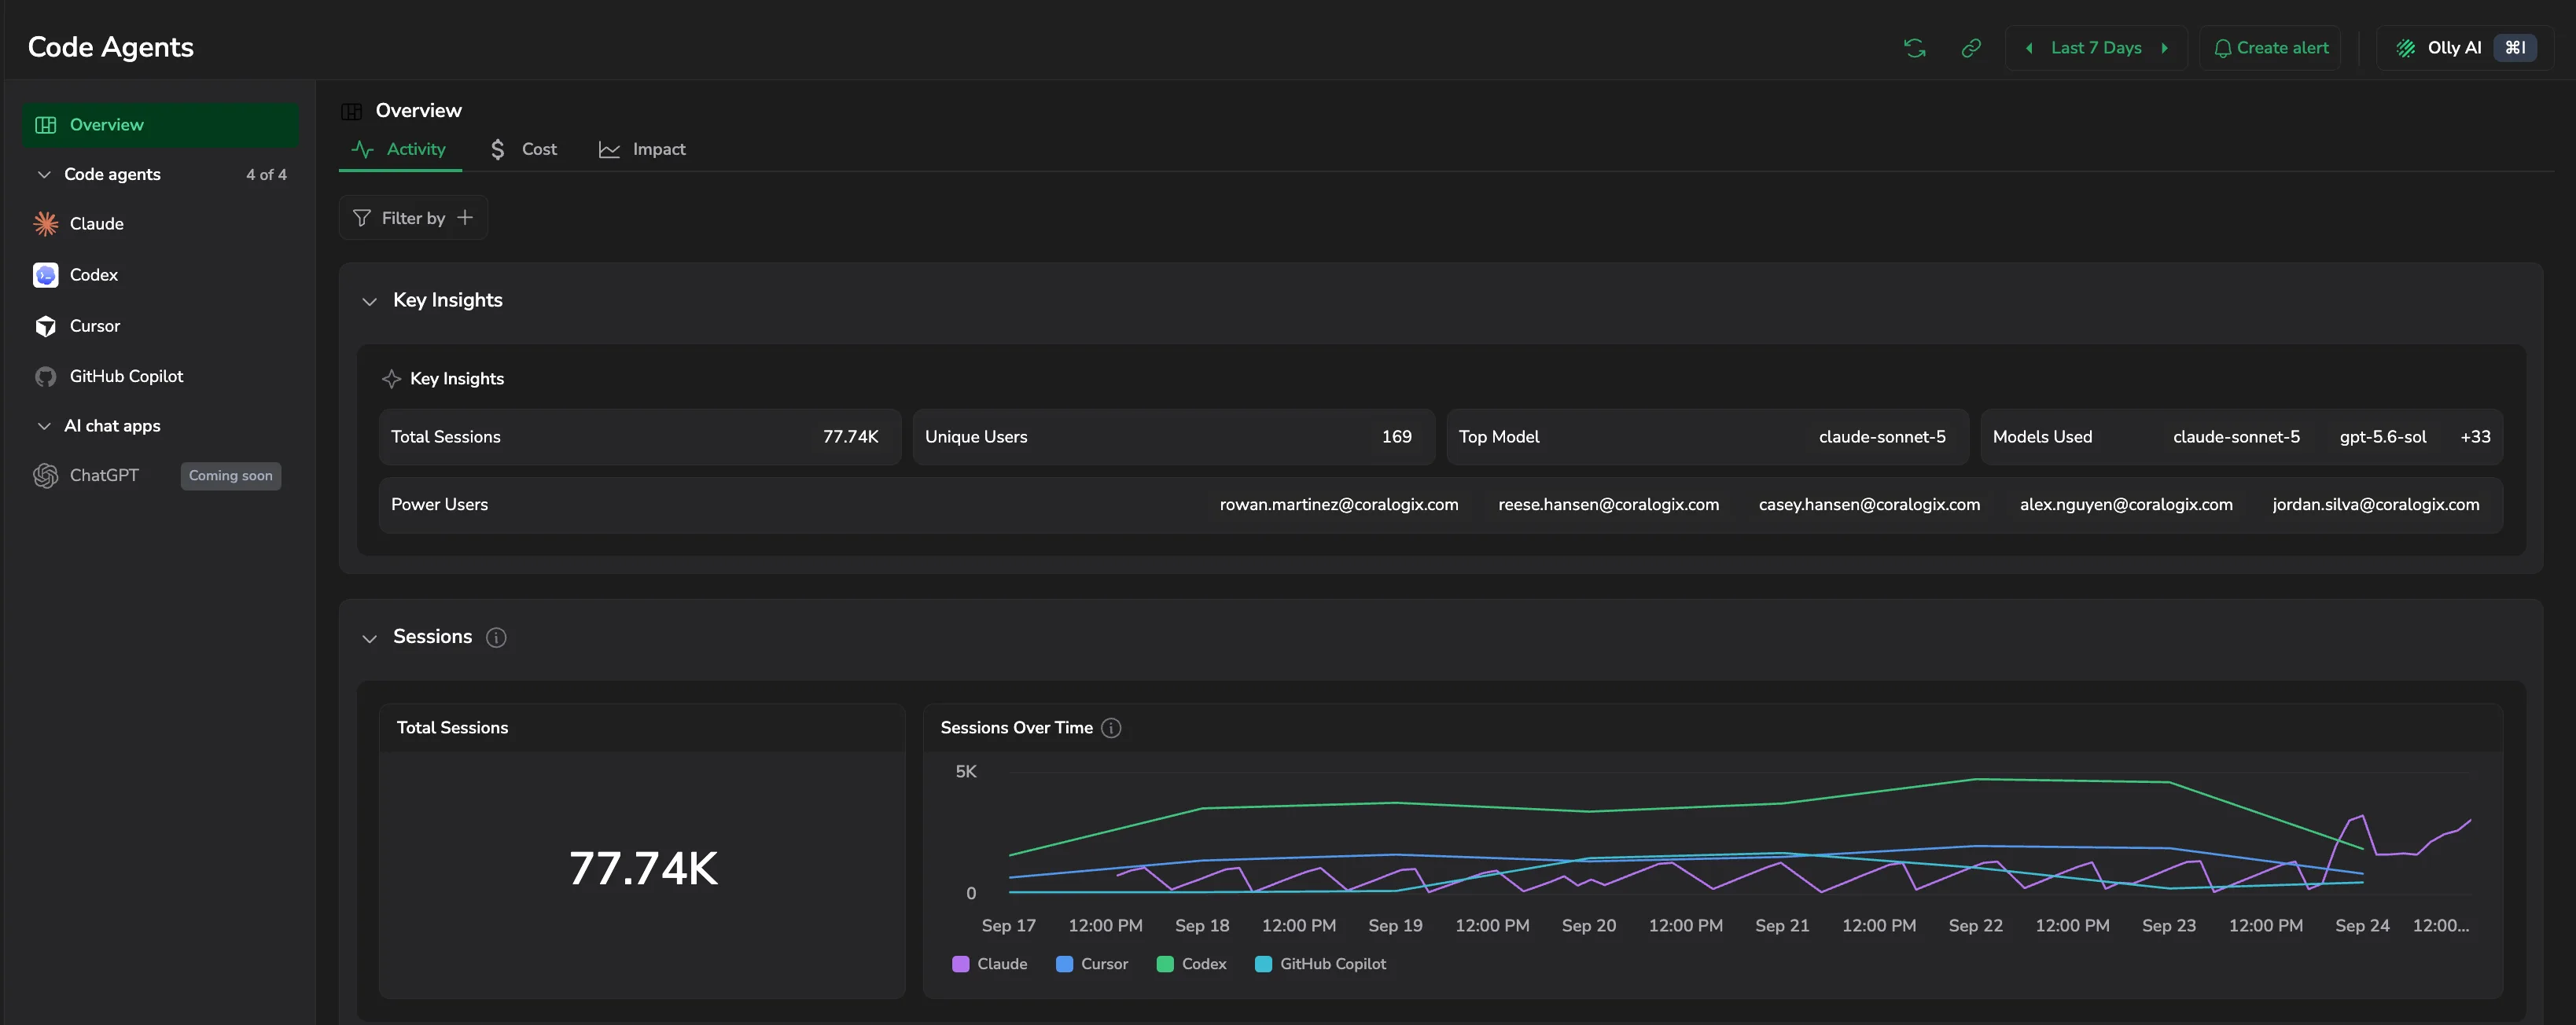
Claude Desktop users who run Cowork against Amazon Bedrock, Google Cloud's Agent Platform, Microsoft Foundry, or an LLM gateway have no Claude account, so the Cowork monitoring settings in the Claude admin panel never reach them. You can now deliver the same Coralogix configuration through Claude Desktop's managed settings with your device-management (MDM) tooling: four settings (otlpEndpoint, otlpProtocol, otlpHeaders, and otlpResourceAttributes), with step-by-step instructions for Jamf Pro on macOS, Microsoft Intune on Windows, and managed-settings.json on Linux. Sessions land in Code Agents Intelligence alongside your admin-panel-configured teams, identified by enduser.id rather than email. Learn more
OpenAI Usage & Cost integration
Pull OpenAI usage, cost, directory, governance, and audit telemetry from your OpenAI organization straight into Coralogix. The integration polls the OpenAI Administration APIs and ingests the results as metrics under the openai_administration_ prefix, covering token and request usage for completions, embeddings, images, audio, moderations, vector stores, code interpreter, web search, and file search; daily cost broken down by line item, project, API key, and user; the organization directory of users, projects, project members, API keys, service accounts, and invites; governance state including spend limits and alerts, data retention, mTLS certificates, per-project rate limits, model and hosted-tool permissions, and the full role-based access control inventory; and the organization audit feed. Add one Admin API key per OpenAI organization. Learn more
Export the Application Catalog, and sort it by volume first
The Application Catalog gains an Export button that downloads the grid as CSV, with every cell matching what the table renders, placeholders included. The button stays disabled until both the application list and the metrics have loaded, so a mid-load export can't write empty metric columns. The catalog now sorts by AI spans descending on first load rather than by issues flagged, putting your busiest applications at the top. The security and quality breakdown under Issues flagged also stays visible when both counts are zero, which reads as "no issues" rather than "no data". Learn more
Cursor cost tracks your pooled contract budget
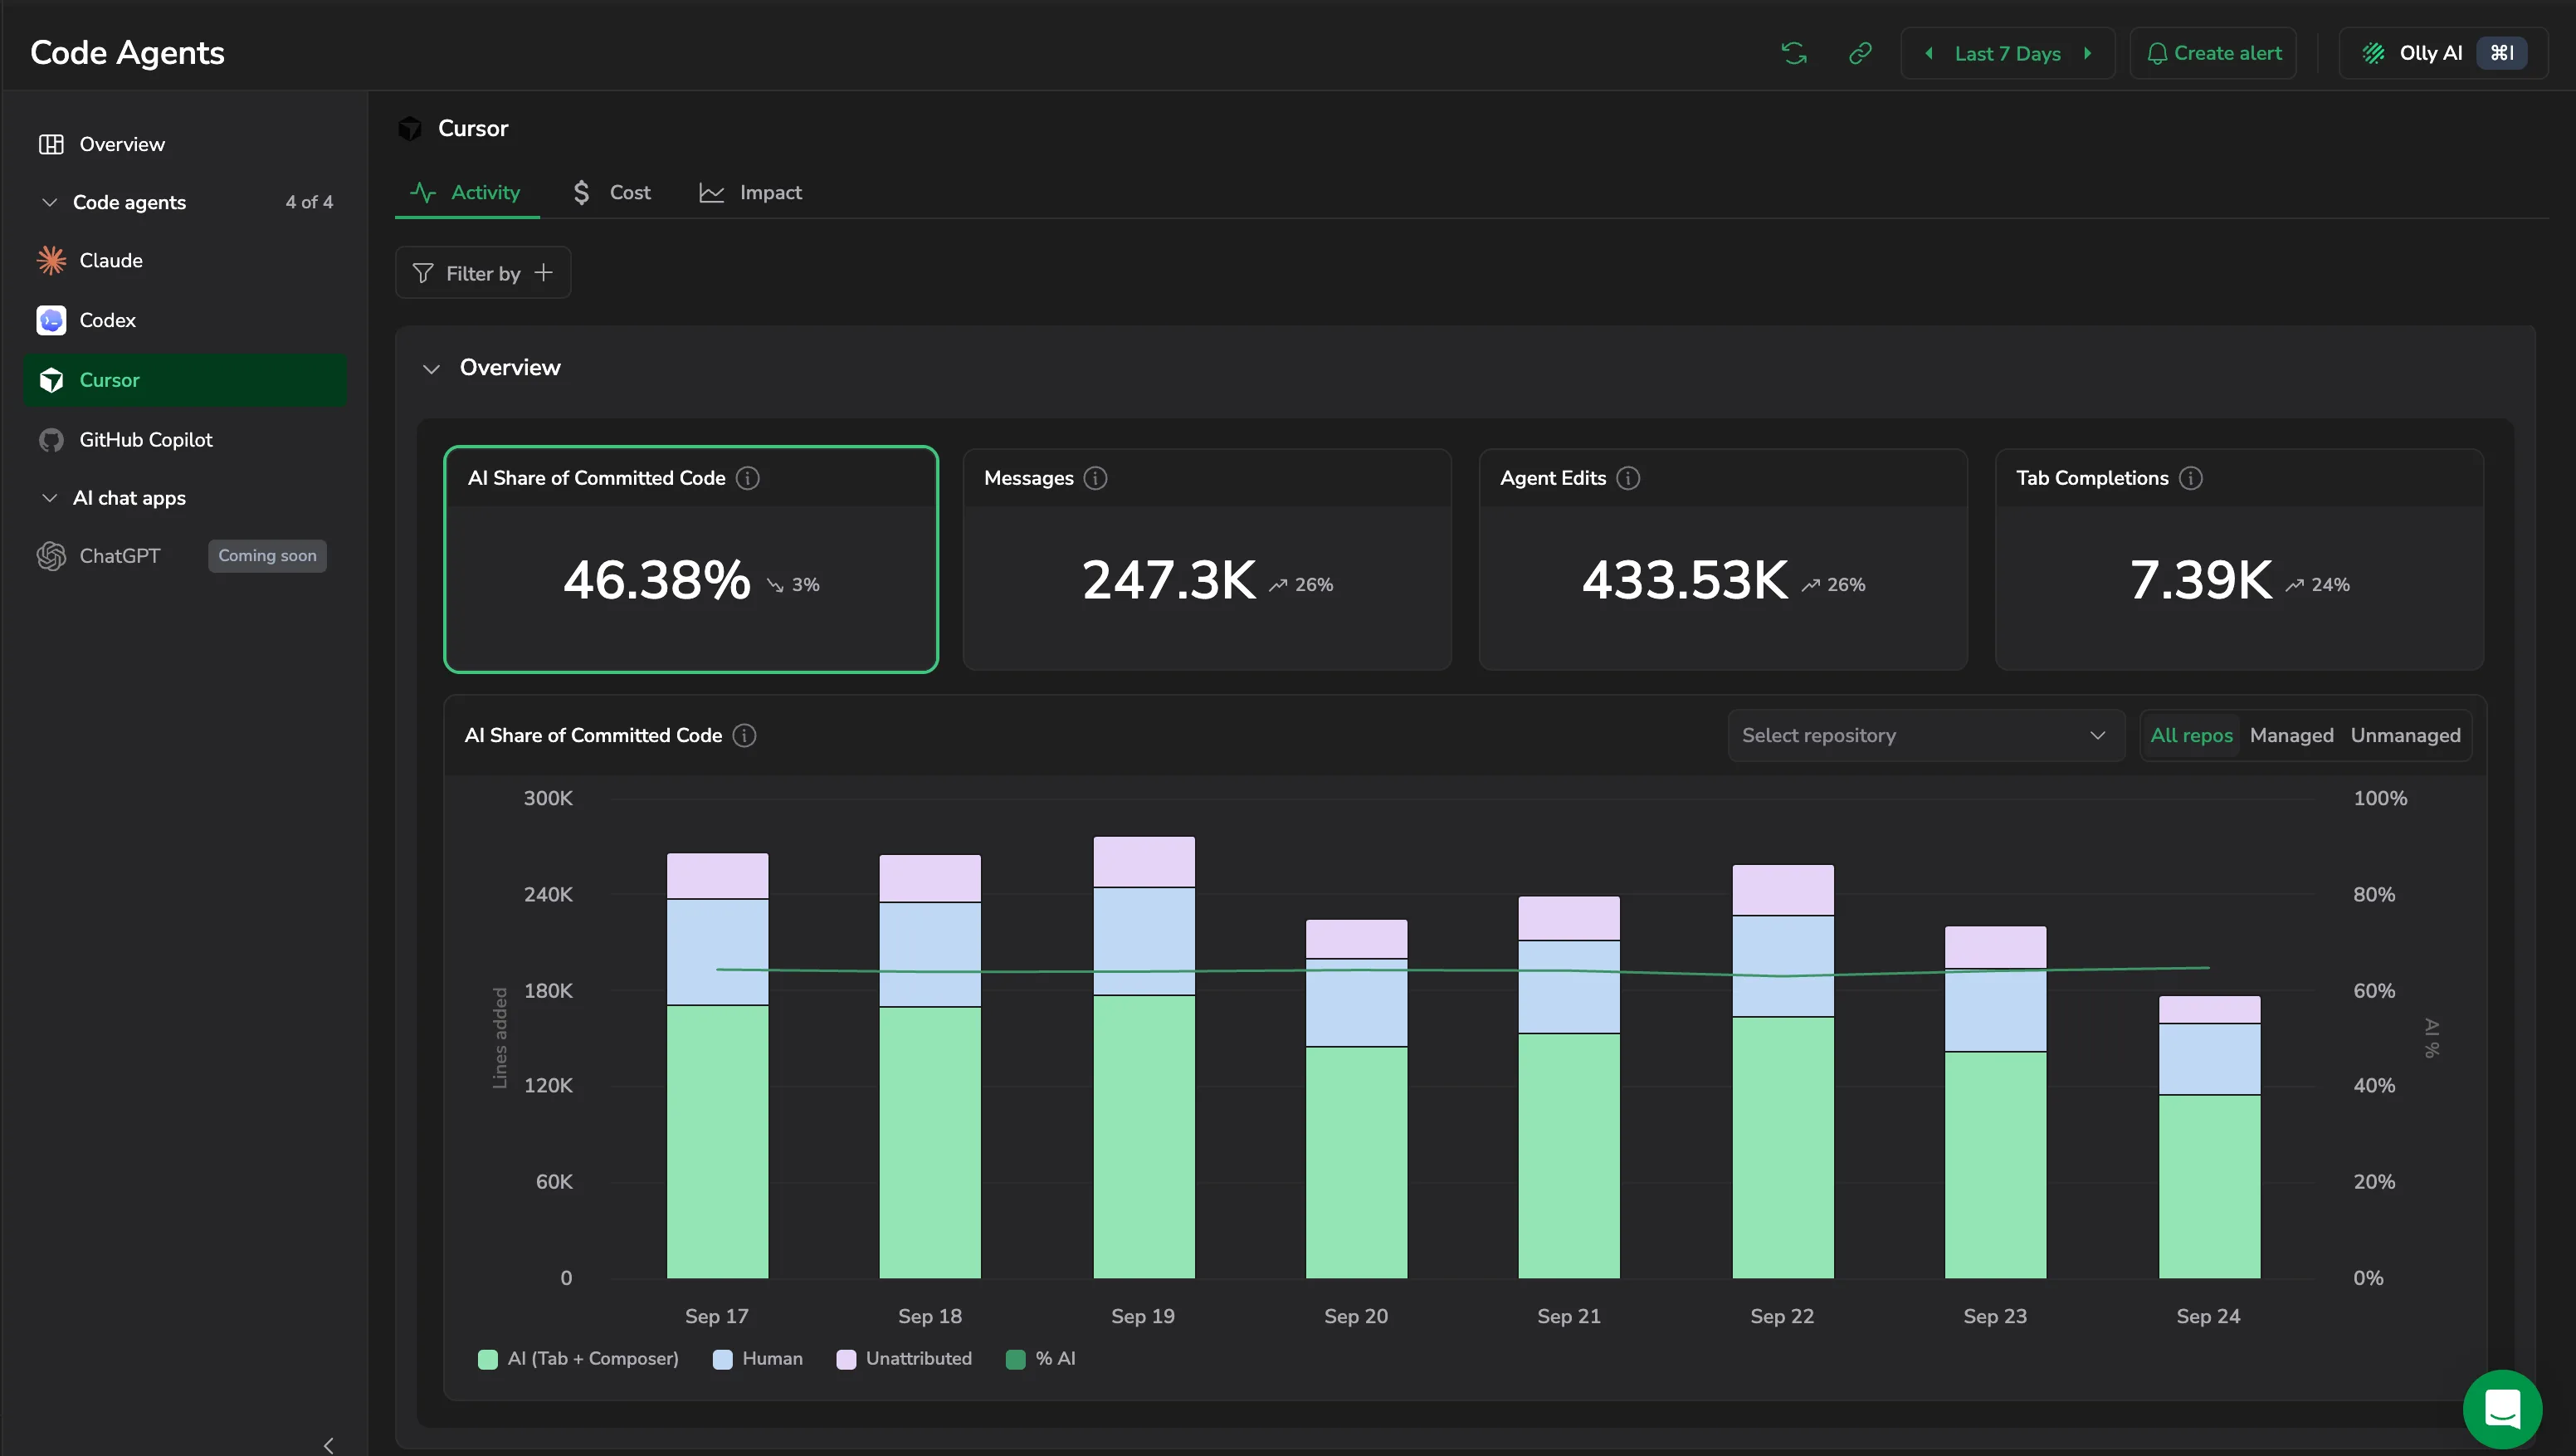
The Cursor dashboard's budget widgets now read your organization's pooled contract budget from Cursor instead of adding up individual member spend limits, which could report spend far above the real budget. Annual Budget and Annual Budget Used replace the old cycle-budget tiles, a new Gross Cost (cycle) tile reports gross spend for the billing cycle your time range ends in, and a label counts down to the end of your contract term. The pooled budget needs an organization admin API key; without one the widget says so, and it says so distinctly when your Cursor plan does not report pooled usage at all. Because the pool is organization-wide, filtering by user or billing group leaves these widgets empty rather than showing a narrowed number. Learn more
Claude Code setup snippets carry your region's endpoint
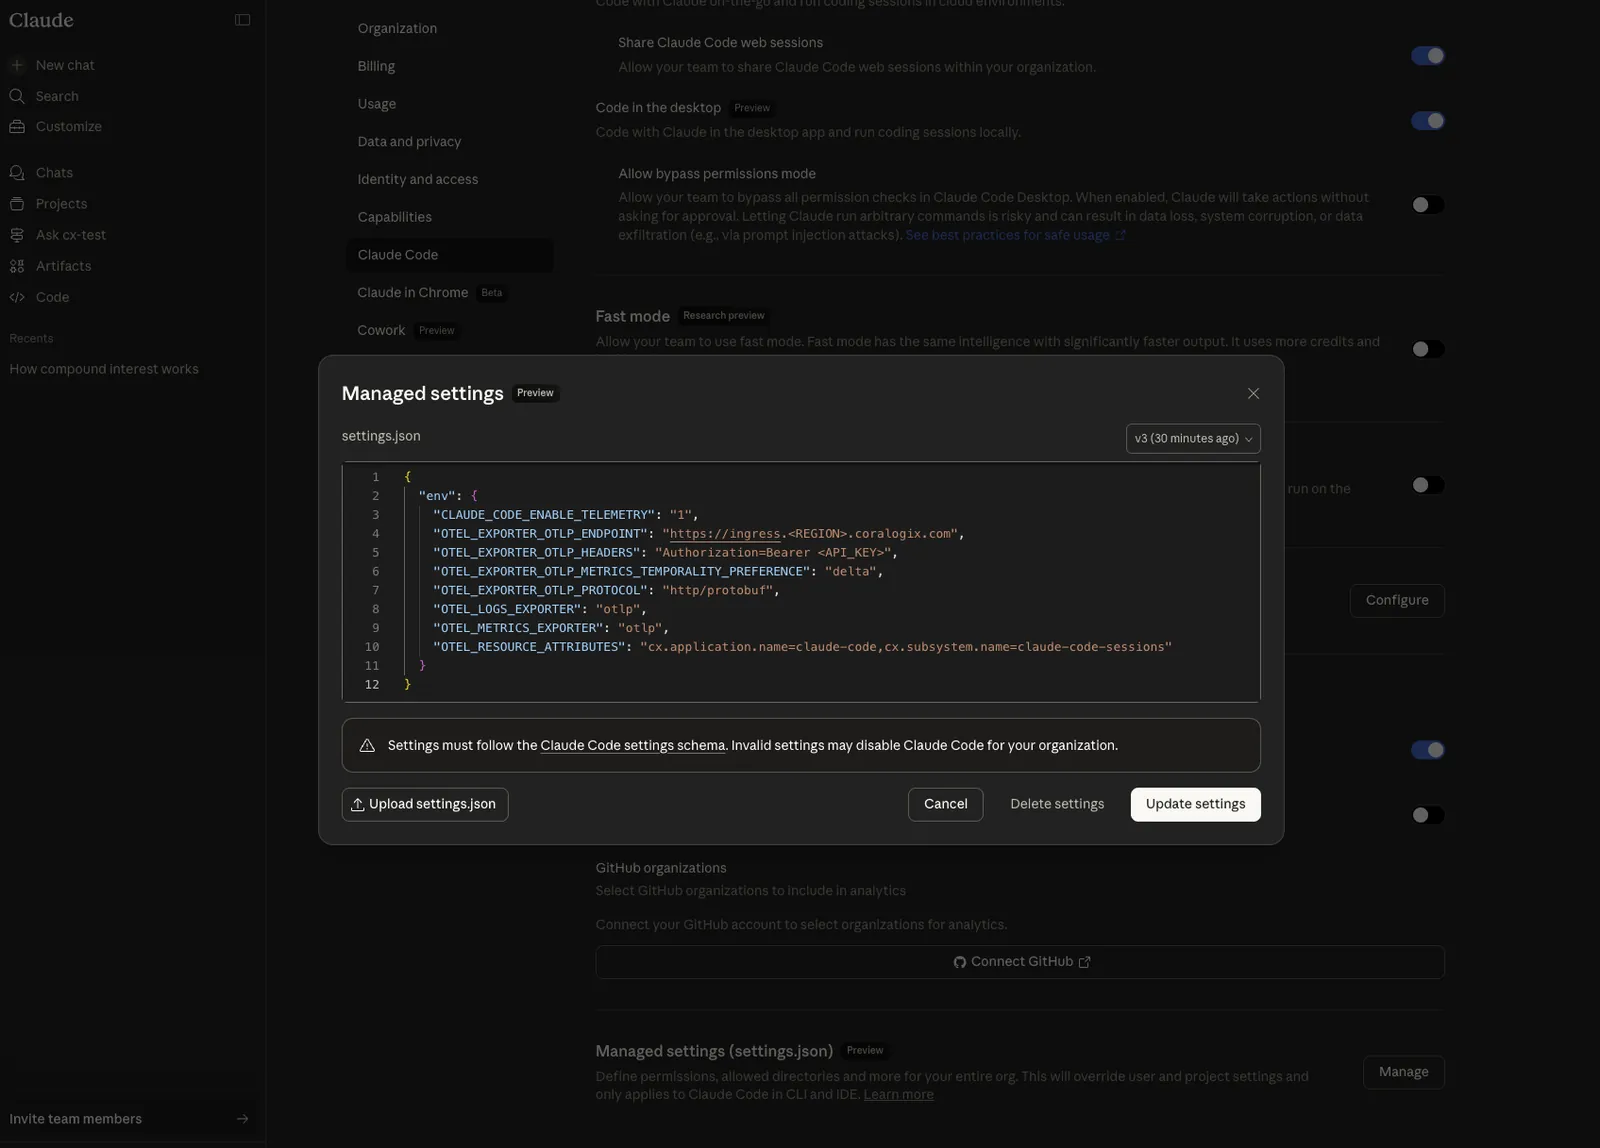
The configuration samples on the Claude Code client-side integration page now print the OpenTelemetry Protocol (OTLP) endpoint for the region you select in the domain selector, instead of a <YOUR_CX_OTLP_ENDPOINT> placeholder you had to look up and replace. Select your region once at the top of the page and every managed-settings, managed-settings.json, and ~/.claude/settings.json block is ready to copy. Your API key and team name stay as placeholders, since those are yours to fill in.
User and Group filters work on the Cursor conversation widgets
Applying a User or Billing Group filter to the Cursor Conversations widgets returned nothing, because those widgets read team-wide metrics that carry no per-member breakdown. They now read the per-member metrics Cursor publishes, so Conversations, Autonomy Rate, High-Complexity Share, Conversations Over Time, Topic Mix, Work Type Over Time, Task Complexity, and Task Guidance Over Time all respond to a user or group filter. Widgets with no per-member equivalent now say the filter is unsupported instead of rendering blank. Learn more
Application Catalog rebuilt around guardrail coverage
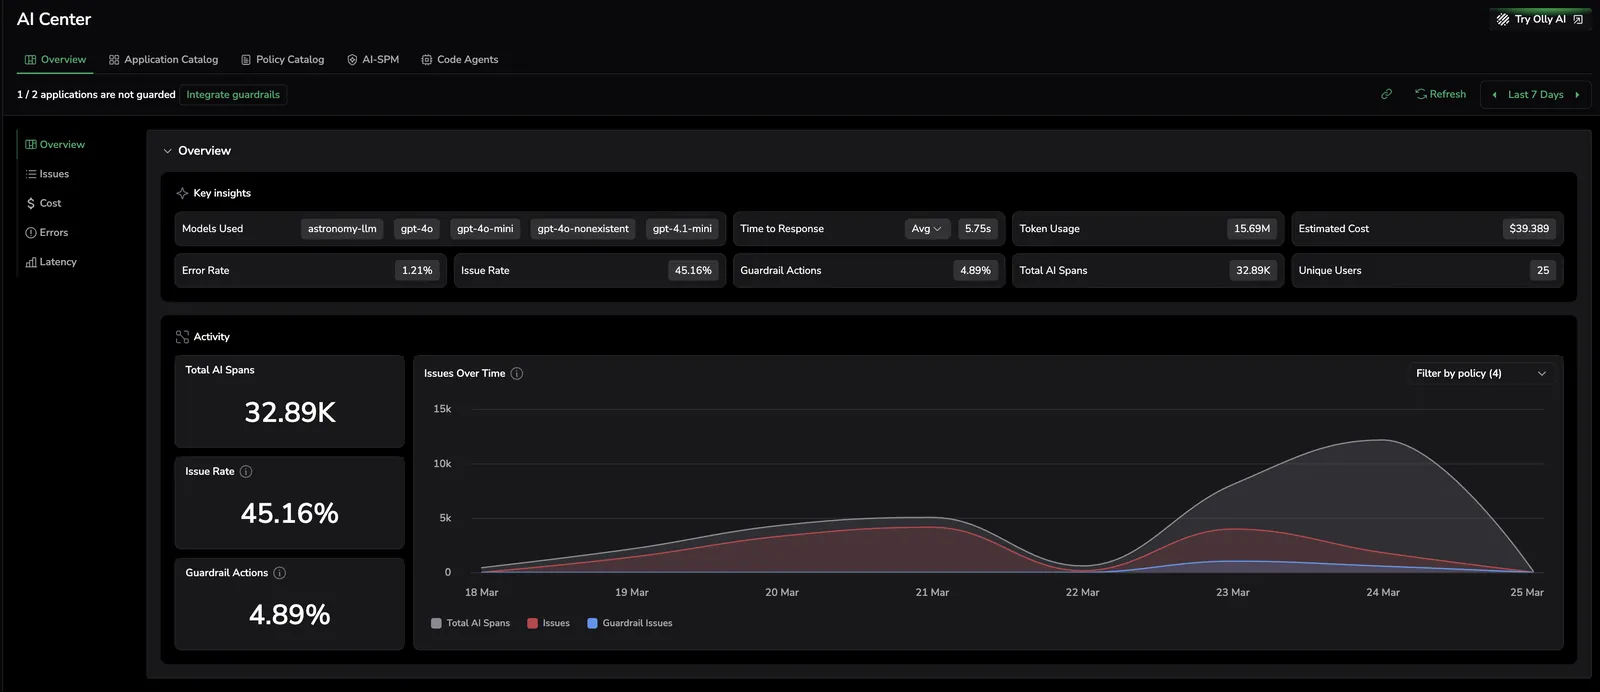
The Application Catalog has a new layout with a collapsible Overview panel carrying five counters: Estimated cost, Token usage, Issues flagged, Guardrail status, and Time to response. Guardrail status is new, reporting how many of your applications are guarded out of the total, so coverage is visible at a glance instead of something you count by hand. Issues flagged is also a new grid column, showing security and quality counts side by side with a tooltip naming each category. A banner above the table names how many applications are unguarded and links straight to Integrate guardrails, and Add new app sits alongside it. The table scrolls horizontally with the application name pinned. Learn more
Tool call counts on the AI application page
The Tool Calls section of the Application Drilldown showed No Data for applications instrumented with the OpenTelemetry GenAI semantic conventions, and undercounted tool calls everywhere else. Coralogix now counts a tool call from two sources and takes the higher of the two: the execute_tool spans your application emits, and the tool calls recorded in the gen_ai.output.messages attribute of the LLM response. Each tool call in a response counts separately, so a turn that calls three tools in parallel counts as three, and tools that only ever appear as execution spans now get their own row. Expect reported counts to rise. Learn more
Insights on the AI Apps Overview, with a path to the span behind them
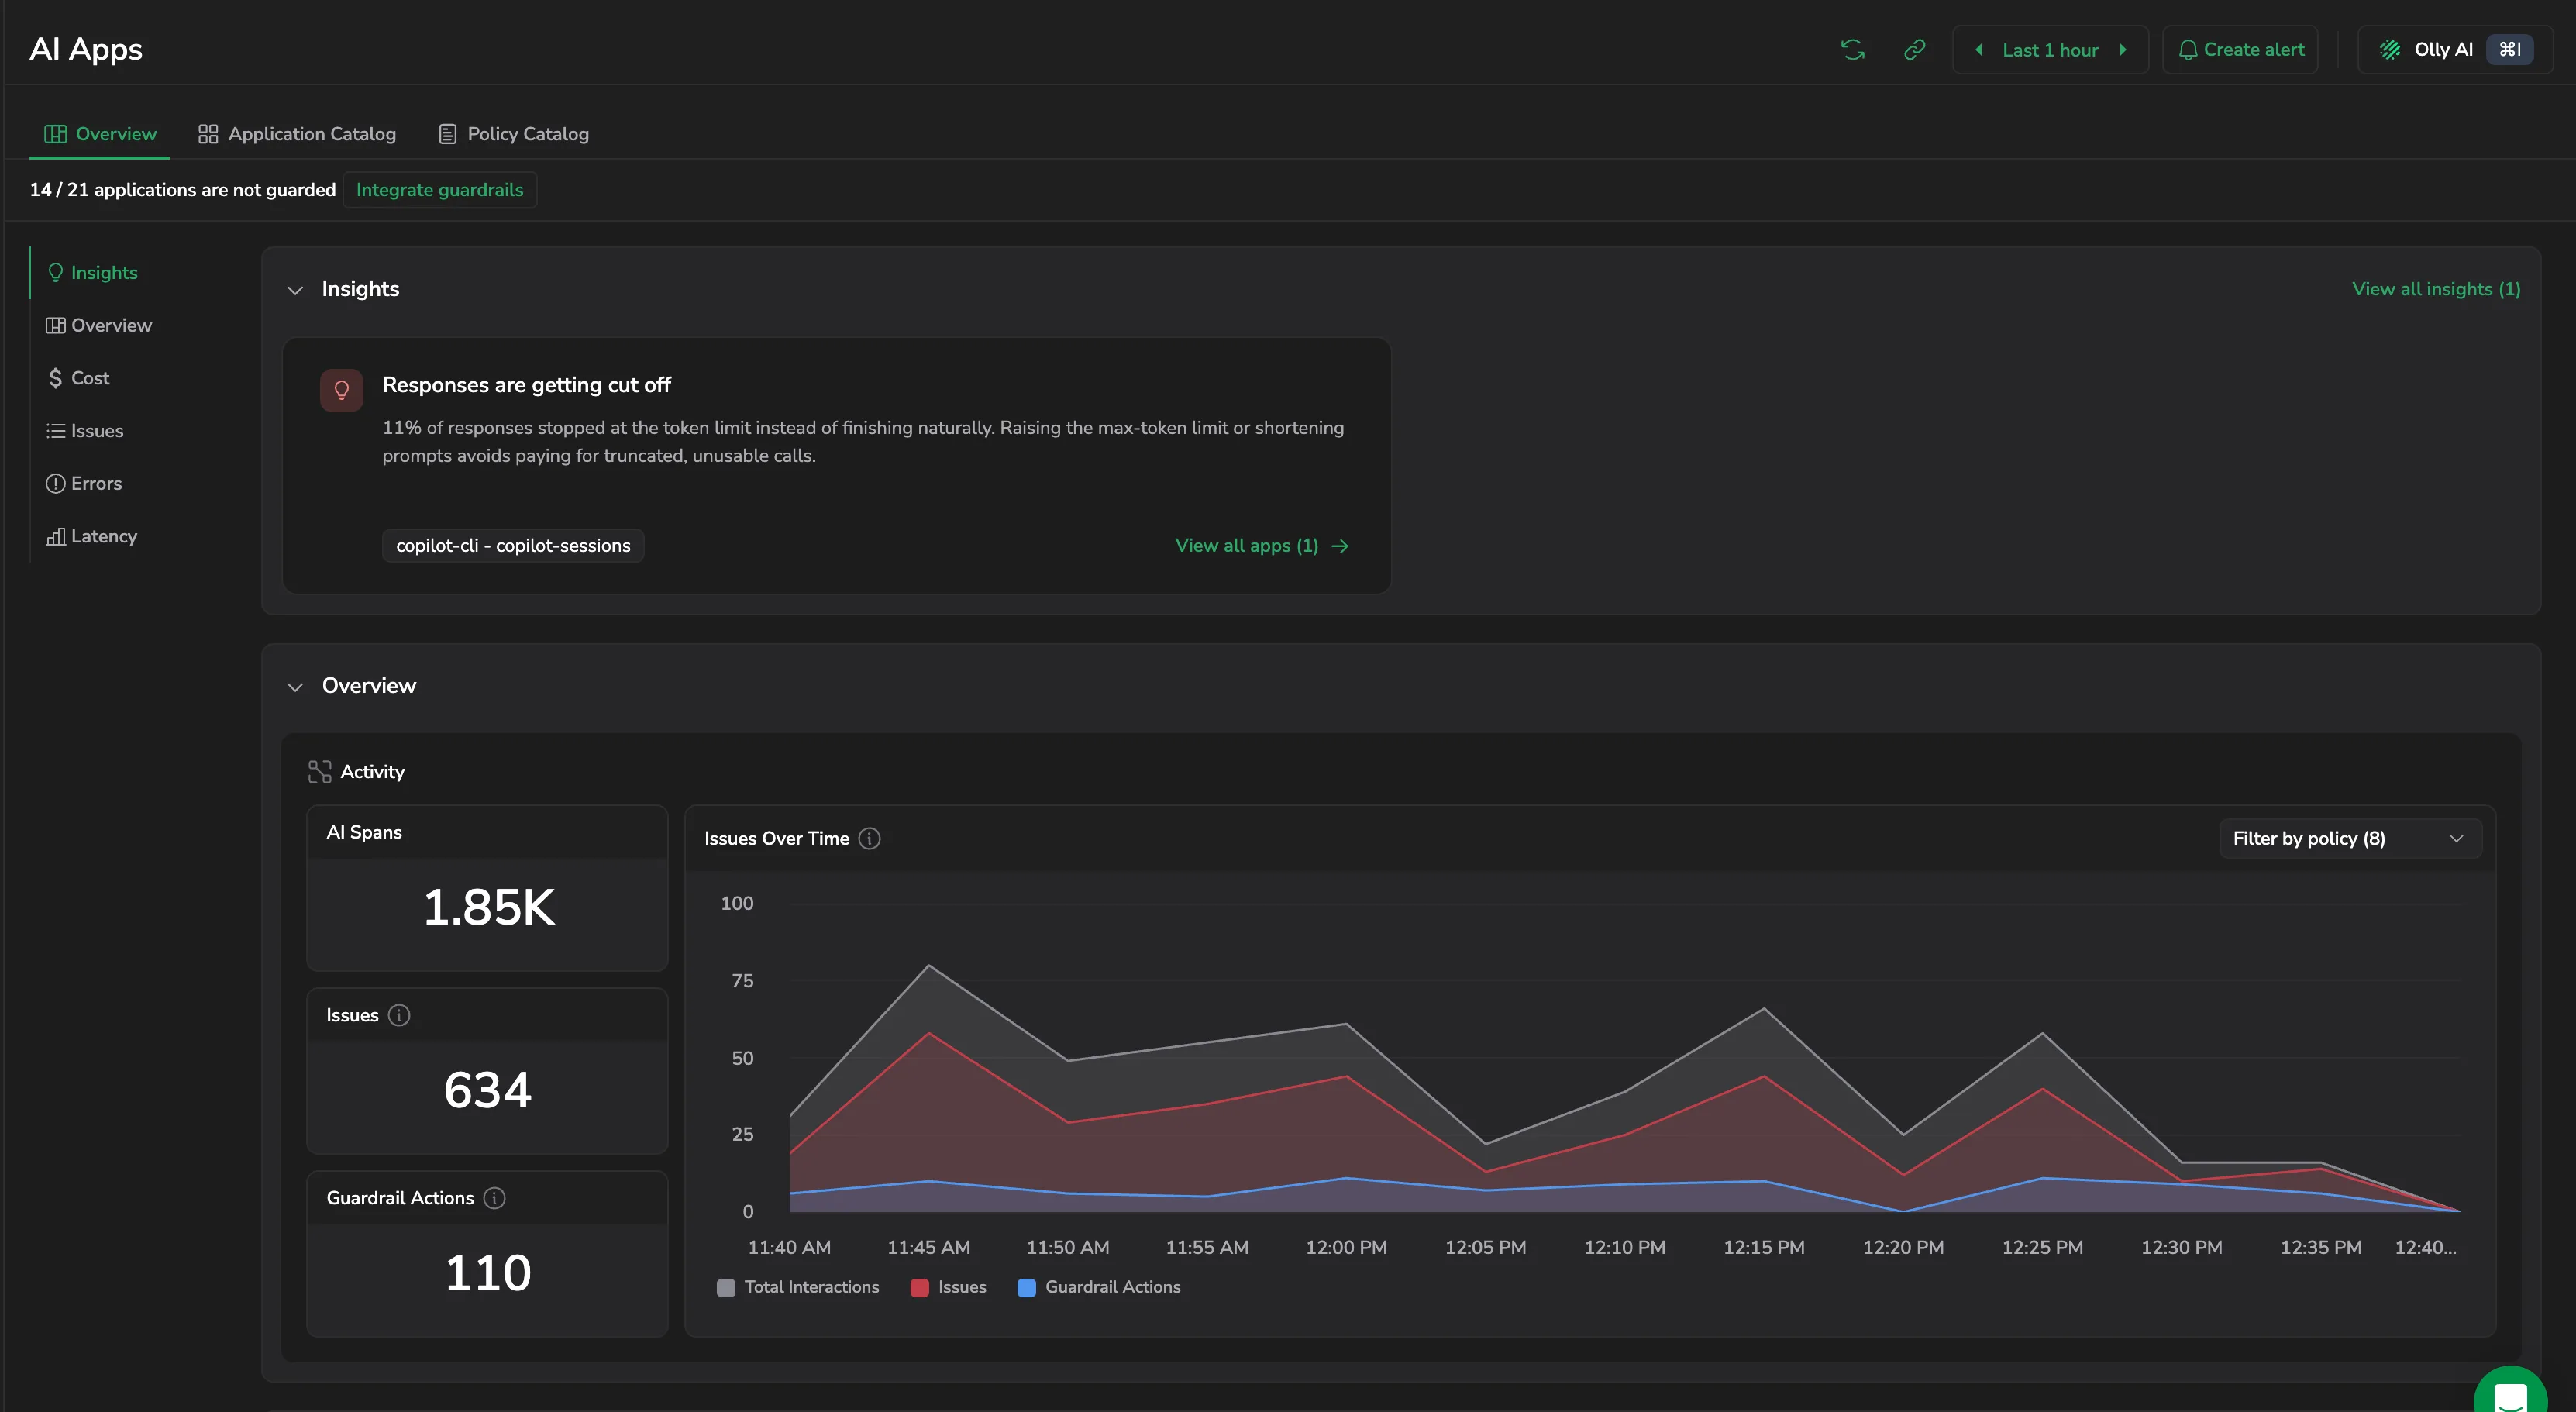
Cost and quality insights on the AI Apps Overview are now a card grid at the top of the page rather than a flat list. Each card names the pattern Coralogix detected, such as responses truncated at the token limit, explains what it costs you, and lists the applications it affects. Select View all apps on a card to see every affected application, or View all insights to open the full set in a drawer. From the drawer, View span example opens a representative span in AI Explorer with its span tree, metadata, and activated policies already in view, so you get from a pattern to the single request that demonstrates it in two selections. The open drawer is reflected in the page URL, so the link you copy reopens exactly what you were looking at. Learn more
Switch the Claude dashboard between Claude Code and claude.ai
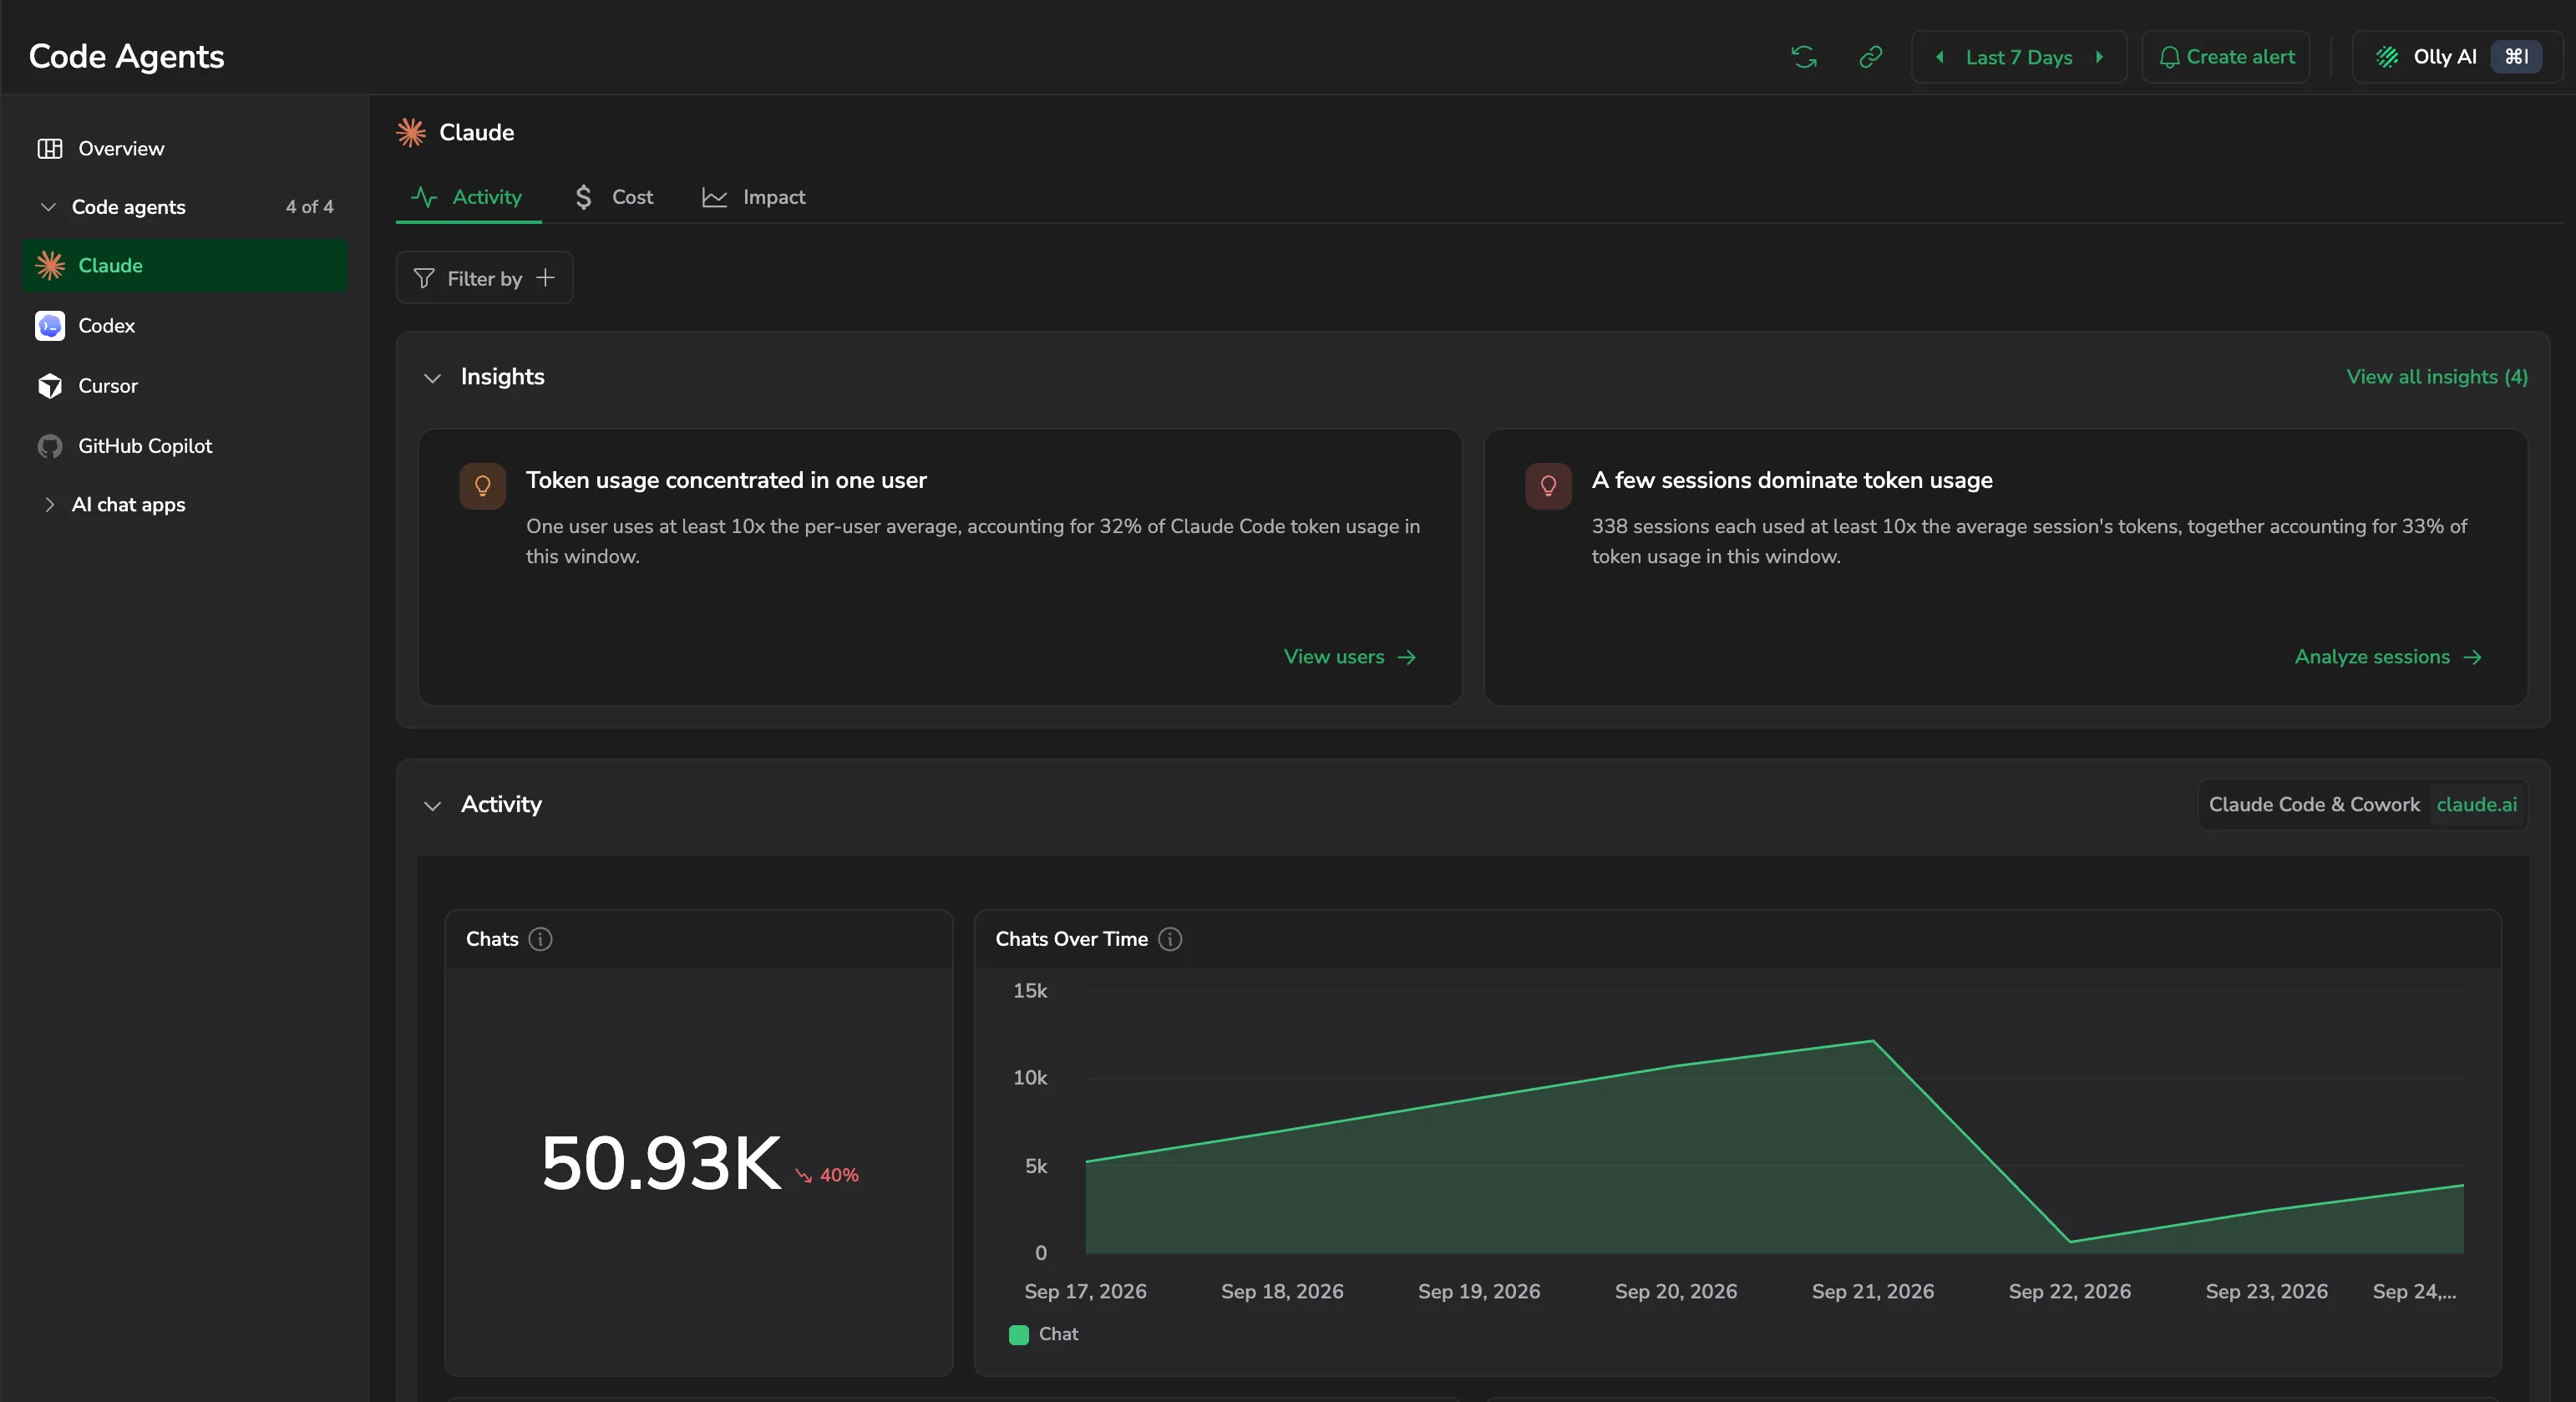
The Activity section of the Claude dashboard now carries a control that switches between Claude Code & Cowork sessions and claude.ai chats. Both panes stay loaded, so switching is instant and nothing refetches. Skills and Connectors adoption moved to the claude.ai pane, where the Enterprise API data behind them belongs. The user drawer gains a filter that scopes its figures to managed or unmanaged repositories, and a note explains when a figure can't be broken down by repository, either because it came from the Enterprise API, which reports no repository split, or because that user sent no OpenTelemetry in the range. Learn more
User feedback scores on AI sessions
Send the ratings your users give your agent's responses to Coralogix, and see how each AI session was actually received, not just what the agent did. Your application emits each rating as an OpenTelemetry log record following the GenAI events semantic convention, and Coralogix joins it to the LLM call it scores on gen_ai.response.id. Scores render as colored badges in a sortable User feedback column in the AI Spans and AI Interactions views and in the details panel, so you can surface the poorly rated responses and drill into the underlying span in Explore spans to understand why. Learn more
Drill into AI Explorer from any AI Center widget
Every widget on the AI Center Overview and the Application Drilldown is now a way into AI Explorer. Select a KPI tile, a bar, a point on a chart, or a row in a table, and AI Explorer opens with the matching filter, sort, and time range already applied, so you land on the spans behind the number you selected. Drag across a chart to move the page's time range to that window. The Tool Distribution widget is now a table rather than a pie chart, so you drill in by selecting a row. Learn more
Cursor dashboard powered by the API integration
The Cursor dashboard in AI Center now runs on the Cursor Usage & Cost APIs integration, so a single organization- and team-level connection covers every member, no per-developer IDE export and no collector to deploy. Key Insights calls out idle seats, cost concentration, spend anomalies, and stale client versions. Spend and budget tracking reports cycle-to-date gross and overage spend against member limits, budget burndown, and a per-model cost table with token split, request units, and per-user cost attribution. Adoption and seats compares active users against your full roster, detects idle seats, and shows client-version spread and peak daily active users over time. Conversation insights break down work-type mix (bug, KTLO, new feature), task complexity, guidance-level (autonomy) trends, and Plan and Ask mode usage by model, while Invocations lists slash command, MCP server and tool, and Skills usage in filterable tables with per-entity user counts. Every by-user view opens a searchable, exportable table of email, group, cost, and tokens, with per-user drawers for cost, requests, code impact, and top commands, MCP servers, and Skills. Learn more
Claude input tokens now include cached reads and writes
Input Tokens on the Claude dashboard counted uncached prompt tokens only, so the input and output total fell short of the basket the list price is actually charged on. It now covers uncached prompt, cache read, and cache write together, with Tokens Over Time breaking them apart. Cost for a model is no longer summed twice when both the Enterprise API and OpenTelemetry report it; OpenTelemetry now fills in only where the API has no row. The Distinct Chats tile is now simply Chats. Expect reported input-token counts to rise. Learn more
APM service dependencies on the AI application page
AI application pages in AI Center now include an APM section, so you can see the services your AI application depends on without leaving AI Center. The section shows a service dependency map of the services the application communicates with, and links through to APM for the full picture. If APM is not connected for your team, the section prompts you to set up the APM integration first. Learn more
Cursor Usage & Cost APIs integration
Pull Cursor usage, cost, and adoption telemetry from your Cursor teams and organization straight into Coralogix. The integration polls the Cursor Admin, Analytics, AI Code Tracking, Bugbot, and Organization APIs and ingests the data as logs and metrics, covering usage events and spend, member activity and seat information, team and per-user analytics, AI code attribution, conversation insights, Bugbot reviews and findings, audit events, and model-access and repository governance. Add one admin:* team API key per Cursor team, and optionally an organization key and ID for organization-wide pooled usage, spend, membership, and model access. Learn more
Claude dashboard: actual cost and coverage across all Claude products
The Claude dashboard in AI Center now covers every Claude product rather than Claude Code and Cowork alone, and (for organizations on a Claude Enterprise plan with the Claude Usage & Compliance APIs integration) reports what you actually paid instead of a cost estimated from token counts. Powered by the Anthropic Enterprise APIs, it shows actual post-discount cost with the change against the preceding period, discount savings against list price, and average cost per session broken down by group, product, and model; puts claude.ai chats and chats over time alongside Claude Code and Cowork sessions in a single view; and reports Skills and Connectors adoption with distinct users, invocations, calls, and attributed cost per Skill. Every tab carries ranked optimization insight cards (usage concentrated in one model, a few users or sessions consuming most of your tokens, heavy re-prompting, licensed users with no activity this month, usage on unmanaged Git repositories) and filters by organization, product, model, user, source, group, application, and subsystem. Learn more
Claude Usage & Compliance APIs integration
Pull Claude usage, cost, and governance telemetry from your Anthropic organization directly into Coralogix. The integration polls the Anthropic Admin, Compliance, and Analytics APIs and ingests the data as metrics, covering API token consumption per key, Claude Code activity, per-user cost and usage, seat and engagement summaries, and an organization activity feed. Configure up to three Anthropic API keys (Admin, Compliance, Analytics); each key unlocks its own data group independently. Learn more
Code Agents dashboards reorganized into Activity, Cost, and Impact
Every Code Agents dashboard, and the cross-agent Overview, is now organized into three tabs instead of one long scrolling page. Activity holds Key insights, session or usage volume, and users. Cost holds the spend and token widgets. Impact attributes what the agent produced to the repositories each session touched. A tab appears only when that agent has sections to put in it, so Codex CLI shows no Impact tab and Cursor shows Activity alone for now. Each dashboard opens on Activity, and the filter control above the tabs is now labeled Filter by. Learn more
Expand every tool call in a span at once
When an AI Explorer span's conversation contains tool calls, an Expand all button now appears beside the span details panel's tabs. Select it to open every tool call and tool response together instead of one at a time; it then reads Collapse all. Prompt and response bodies keep their own Show more controls. Learn more
Azure DevOps and nested GitLab repositories attributed correctly

Repository attribution in Code Agents now derives a repository's identity from the raw Git remote your agent reports, rather than from the last two segments of its path. Azure DevOps repositories keep their full organization/project/_git/repository identity, so two repositories with the same name in different projects no longer collapse into one, and legacy visualstudio.com hosts resolve the same way. GitLab projects in nested subgroups keep their full group path. Sessions recorded before your fleet picked up the change keep their original identity, and historical entries can't be relabeled. Learn more
New AI Center navigation
AI Center is now organized into three sections in the navigation sidebar: AI Apps, Code Agents, and AI-SPM. Overview, Application Catalog, AI Explorer, and Policy Catalog now sit under AI Apps, and selecting AI Center always opens it. Code Agents gains a collapsible sidebar of its own that lists every supported tool under Code agents and AI chat apps, showing which are connected and counting them per group. Before you connect anything, Code Agents shows a Connect your first AI tool screen that links each tool to its setup guide. When only one agent is connected, Code Agents opens that agent's dashboard directly. Learn more
Session Replay column in AI Explorer
Both the AI Spans and AI Interactions tables now carry a Session Replay column, so you can see which LLM calls have a recording without opening each row. Select the play button to open the user's RUM session in a new tab. When no recording is available for a row, the button is greyed out rather than absent, so you can tell the difference between a call with no recording and one still loading. Learn more
LiteLLM integration for AI Center
Send GenAI spans from your LiteLLM proxy straight to Coralogix AI Center over OTLP, no Coralogix SDK, no instrumentation library, and no OpenTelemetry Collector required. LiteLLM emits OpenTelemetry GenAI spans through its built-in otel callback: opt in to the latest GenAI semantic conventions and every request flows into AI Center. Break token usage, cost, and call volume down by team and by coding agent using the request-identity attributes LiteLLM stamps on every span. Learn more
A banner tells you when your AI data arrives
When telemetry first reaches Coralogix from an AI application or a code agent, a banner announces it and offers a button that takes you straight to the right place, such as Explore AI Center for an AI application or View Cursor for a code agent. Each source announces itself once, and dismissing a banner hides it for good. You only see a banner for an area you have permission to open, AI-OVERVIEW:READ for AI applications or AI-CODE-AGENTS:READ for code agents. Learn more
Claude Code telemetry through Claude apps gateway
Organizations that route Claude Code through Claude apps gateway (Anthropic's self-hosted gateway) can now stream telemetry to Coralogix by configuring a destination in gateway.yaml instead of a client-side env block. The gateway relays metrics, logs, and traces and pushes the OpenTelemetry configuration to every connected client, with per-user attribution from the gateway-issued token. The same setup routes the application and subsystem through the CX-Application-Name and CX-Subsystem-Name headers, so developers on Claude Desktop keep sending logs and traces. Learn more
Agent graph in AI Explorer
When a trace involves multiple agents, AI Explorer can now render it as an Agent graph, a view that aggregates the trace to the agent level so you can see who called whom, in what order, what ran in parallel, and at what cost, instead of reading through hundreds of spans. Select any agent node to load that run's metadata, evaluations, guardrail actions, and full aggregated chat. Agent graph appears for traces that emit OpenTelemetry GenAI agent spans. Learn more
Classify repositories as Managed or Unmanaged
Mark any repository as Managed (tracked by a Coralogix-managed integration) or Unmanaged (outside your observability setup) from Settings → AI Observability, without requiring a GitHub integration or OAuth. Works for GitHub, GitLab, and Bitbucket. Classification drives the Managed vs. Unmanaged repo breakdown in the Claude Code and GitHub Copilot dashboards. Learn more
GitHub Copilot: API-based usage collection, cost optimization insights, and repository breakdown
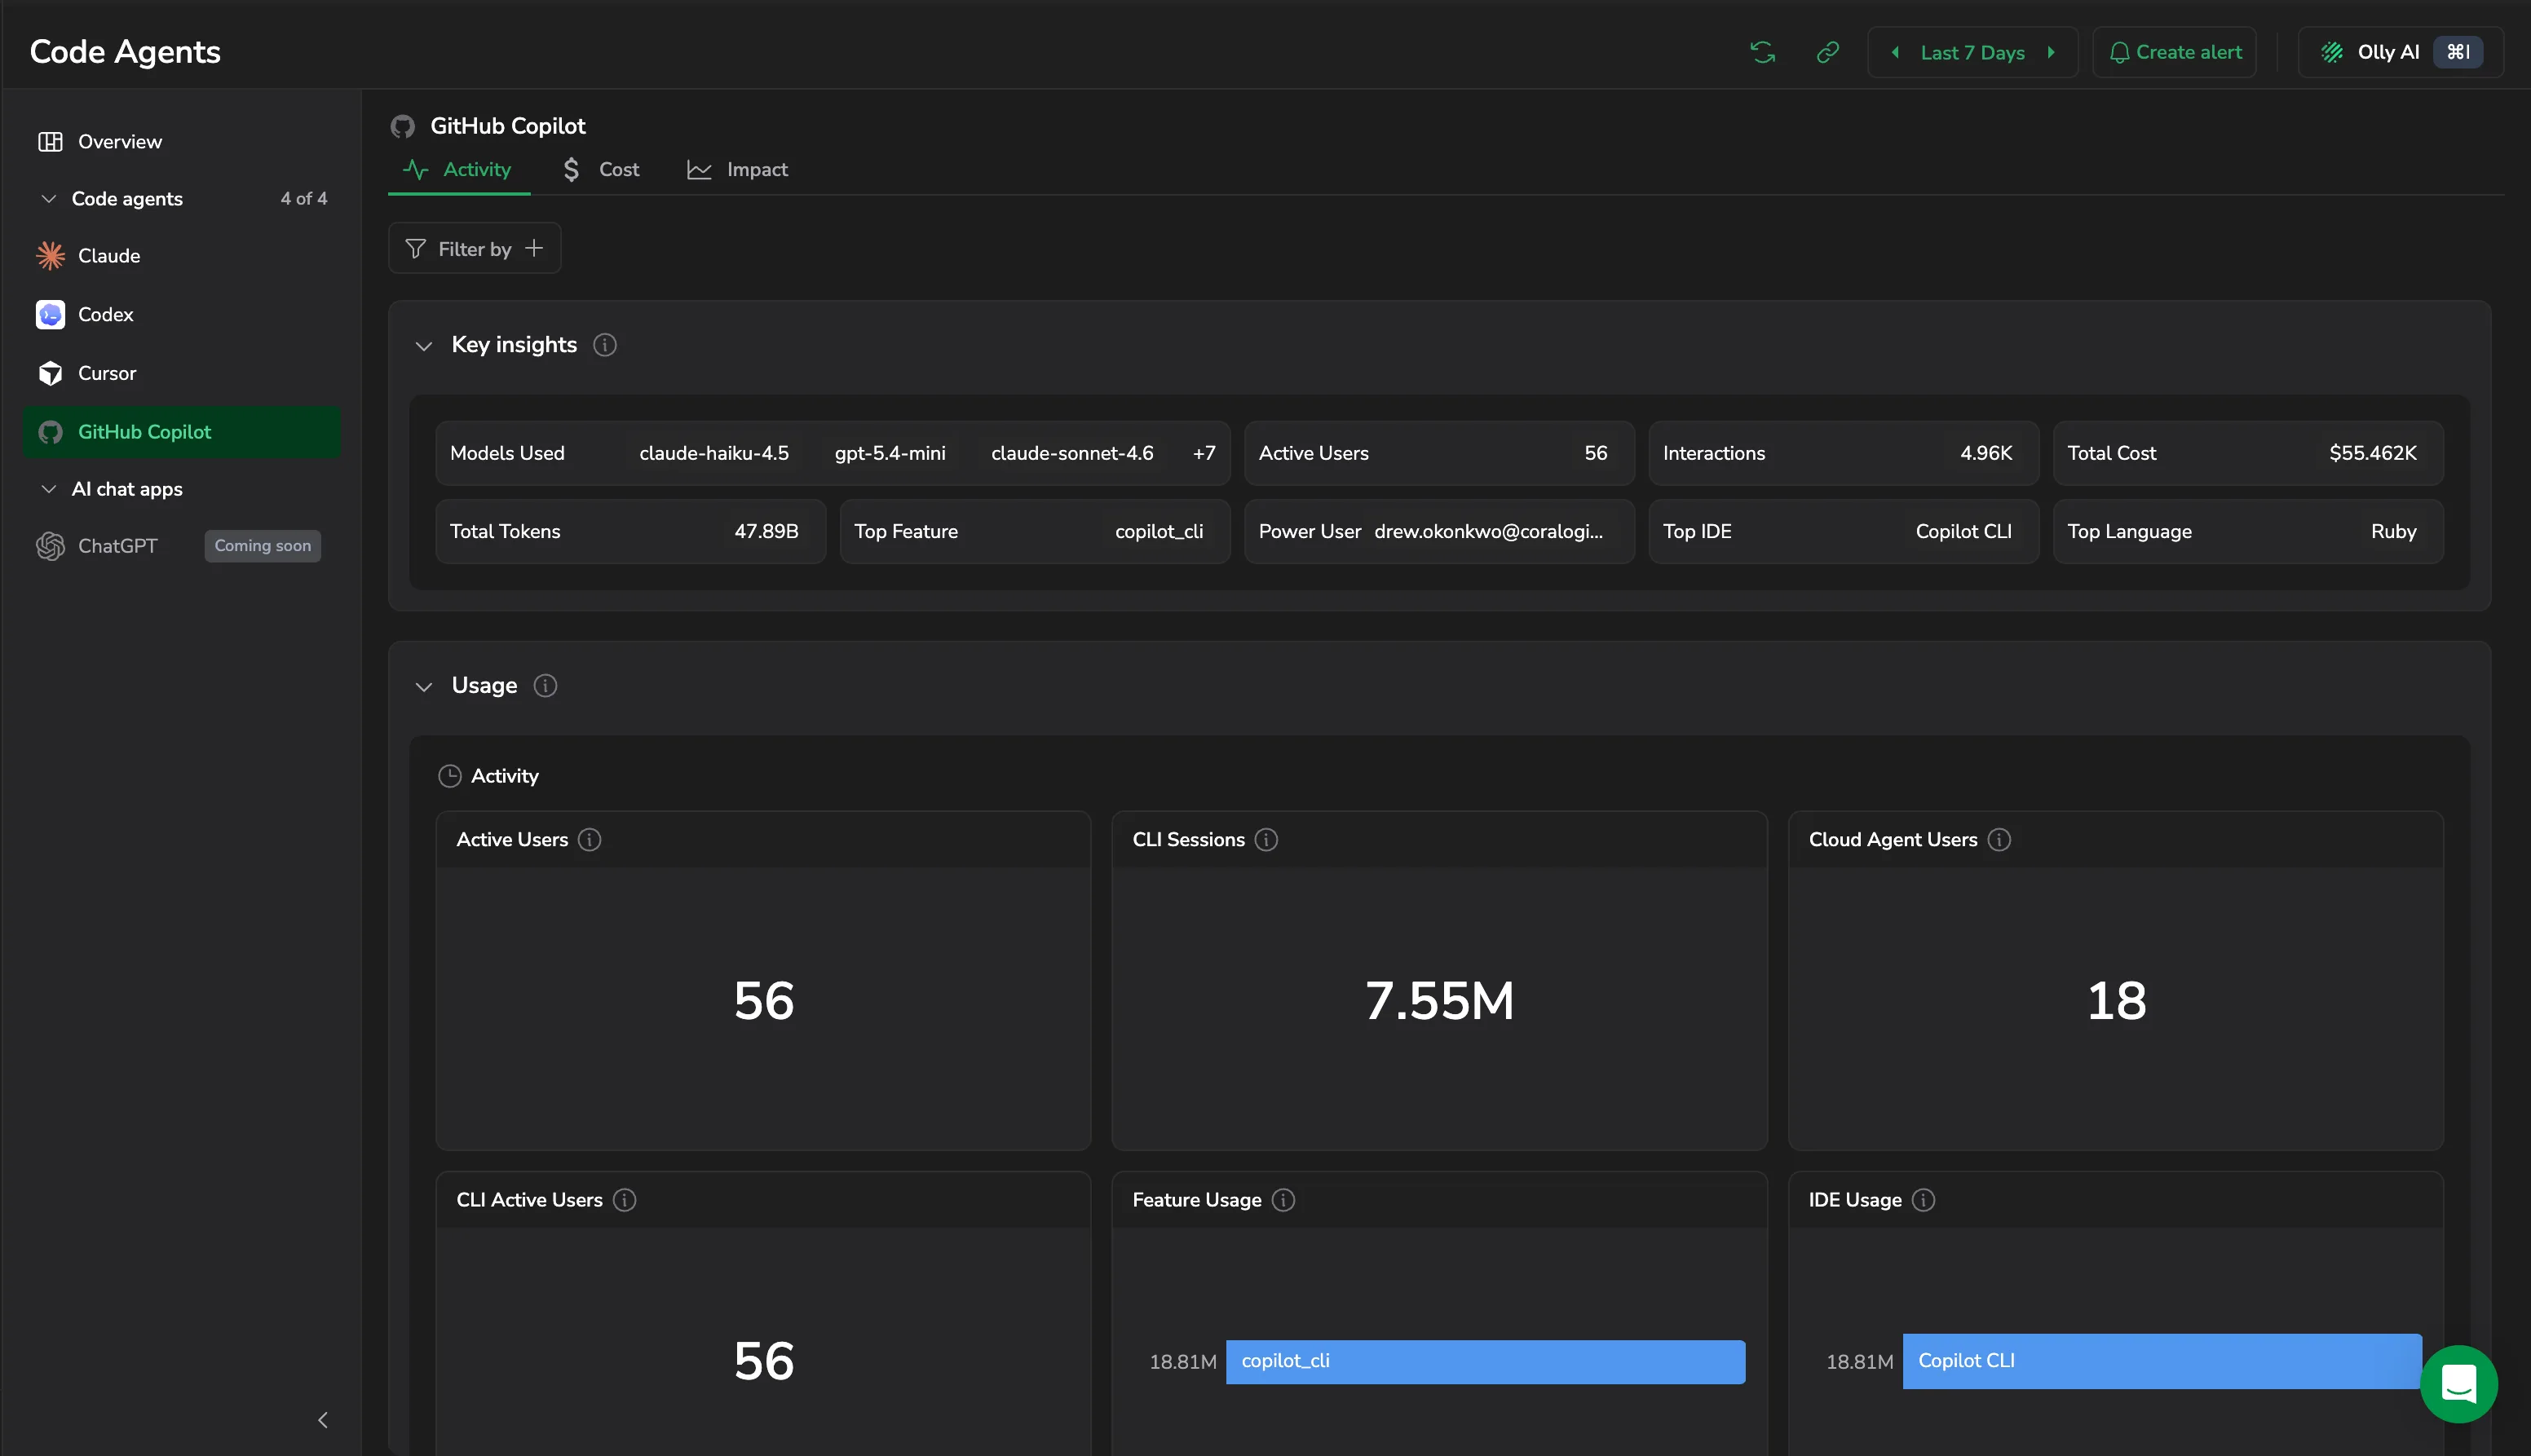
GitHub Copilot data collection now uses the GitHub API via a Coralogix-managed GitHub App, replacing the local OpenTelemetry Collector setup. Three new Cost Insight cards surface optimization opportunities, seats with no recent activity, seats with low acceptance rates, and languages where suggestions are rarely accepted. The editor dashboard splits usage into Managed (Coralogix-integrated) and Unmanaged repositories so you can see where AI assistance is monitored and where it is not. Learn more
AI Center in Olly, CLI, and MCP
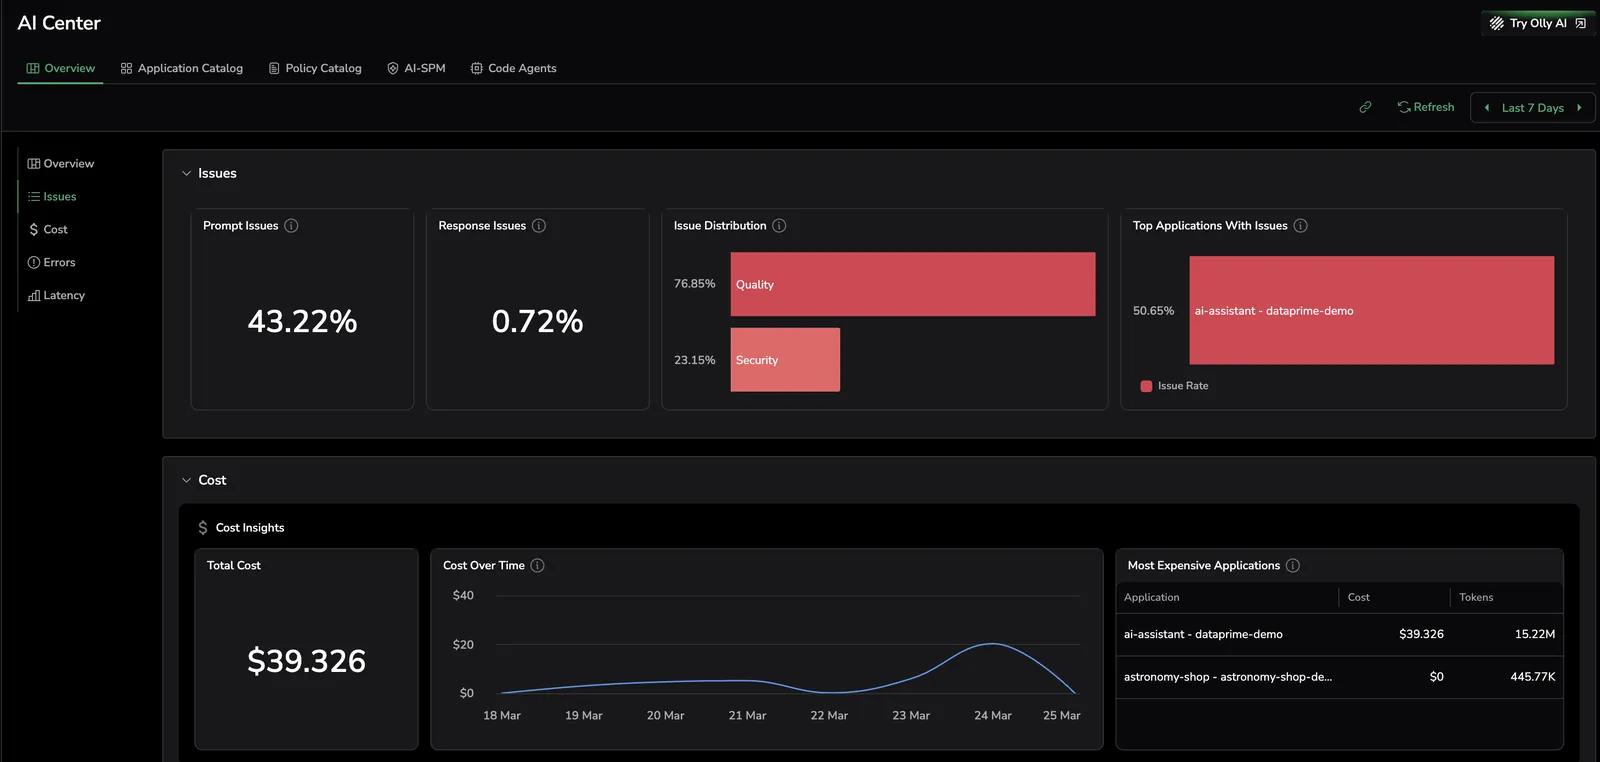
AI Center is now accessible from three surfaces beyond the Coralogix UI. Ask Olly about evaluation results and policy coverage in plain language. Use cx ai-center commands in cx-cli to query evaluations from the terminal. Connect from your IDE via the Coralogix MCP server. Learn more
AI Explorer: flexible columns, filtering, and error visibility
The AI Explorer table gains a column manager to show, hide, and reorder columns, including custom metadata fields from your traces. LLM errors are now flagged inline in the explorer view so you can spot failure patterns without opening individual traces. Learn more
Code Agents Alerts for Claude Code and GitHub Copilot

Twelve ready-to-use metric-based alert definitions (covering error rates, latency, token usage, and cost) are now available for Claude Code and GitHub Copilot from AI Center. Deploy them in one click from the Alerts tab; no manual query writing required. Learn more
Repository tracking for Claude Code on macOS and Windows
The repository-tracking hook (which attributes each Claude Code session to the Git repositories developers worked on, so AI Center can break down cost and activity by repository) now runs on both macOS and Windows. It ships as a shell script (claude.sh) on macOS and a PowerShell script (claude.ps1) on Windows, each using only tools built into the operating system, so there's no Python, Node, or other runtime to install. The hook reads its Coralogix configuration from the same Claude Code telemetry settings, so there are no separate hook credentials to manage, and a single operating-system-dispatch command covers both platforms, with ready-to-use Jamf (macOS) and Intune (Windows) deployment scripts. Learn more
AI Center usage is now denominated in AI Units
AI Center evaluations and guardrails are now denominated in AI Units, the unified currency for all AI features in Coralogix, alongside Olly conversations, query assistant, and other AI-powered features. This is a rename only: the underlying calculation is unchanged. The Data Usage screen now has a single AI Units tab with Total, Olly, and AI Center sub-sections, replacing the separate AI Center and Olly tabs. Learn more
Model pricing, configurable eval thresholds, and Copilot cost insights
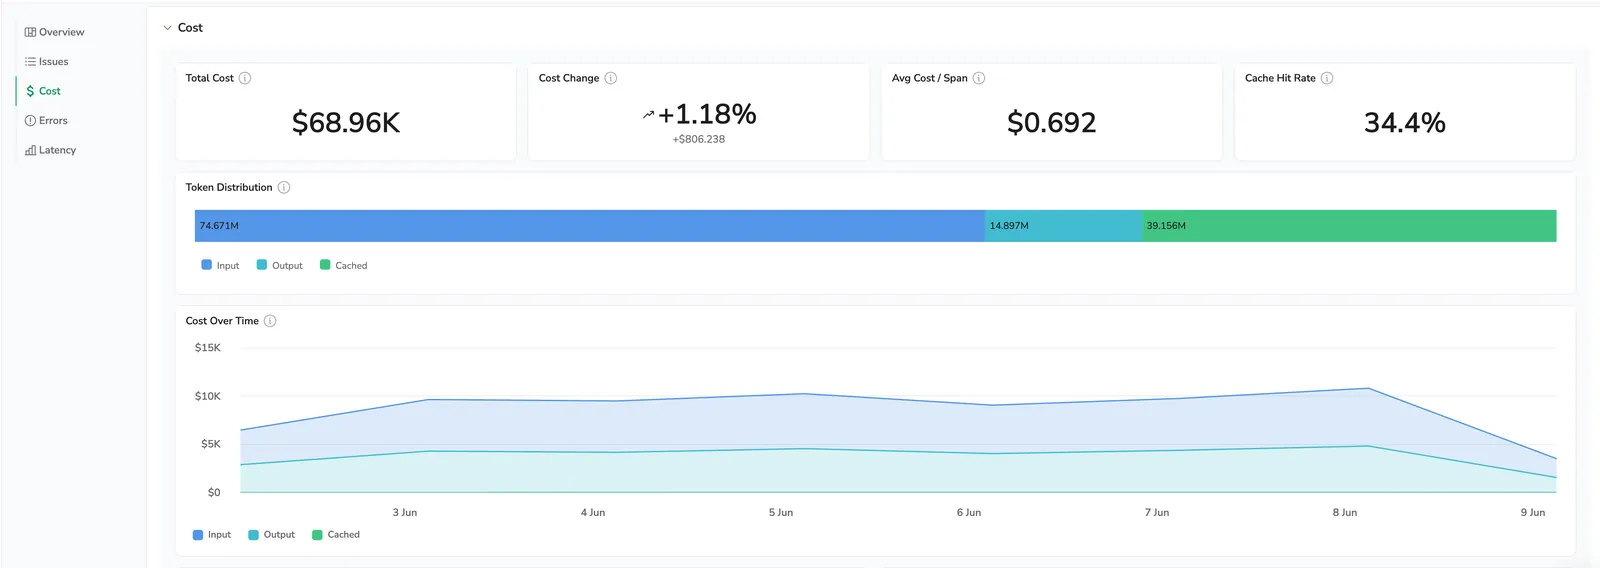
Model Pricing (Set the per-token rates you actually pay for each model) input, output, cache read, and cache write, so every cost metric in AI Center reflects your negotiated, self-hosted, or fine-tuned pricing instead of public list rates. Learn more
Configurable eval thresholds: Set a per-eval threshold that decides what counts as an issue, instead of a single fixed value. The threshold drives the high and low labels, issue tagging, and every overview and analysis view, and you can set it when adding an eval or later from its configuration page. Learn more
Copilot optimization insights (The Copilot dashboard Cost tab now surfaces ranked, metric-based suggestions for cutting spend, scanned from your usage data over the selected time range) flagging expensive models, budget-heavy users, and unused licensed seats. Learn more
Terraform support for AI Center evaluations
Manage AI Center evaluations as code with two new Terraform resources: coralogix_ai_evaluation (supports all 17 built-in evaluation types) and coralogix_ai_custom_evaluation (for custom evaluation logic). Learn more
Guardrails TypeScript SDK
The @coralogix/cx-guardrails TypeScript SDK lets you add runtime policy checks to any LLM call (PII detection, toxicity filtering, prompt injection detection, and custom policy rules) before a response reaches your users. Learn more
Repository attribution for Claude Code (Managed vs Unmanaged)
Understand where your Claude Code spend is going, whether it's aligned with the work the company is paying for, and what each repository is actually getting out of it. The new Repositories tab on the Claude Code dashboard attributes every per-session signal (cost, tokens, code impact (lines of code, commits, pull requests), models, and session counts) to the repositories developers actually worked on. Activity splits between Managed repositories (those owned by an Organization you configure in Settings → AI Center → Code agent) and Unmanaged ones, personal projects, external clones, and private projects using the company's Code Agents license. Drill from the Repo type pie into the Unmanaged bucket, then into individual users, to surface compliance, FinOps, and IP-protection signals. Learn more
Code Agents Intelligence. Claude Code cost breakdown and session capture
Code Agents Observability is now Code Agents Intelligence. The Claude Code dashboard adds a dedicated Cost tab that shows where spend goes and where to cut it, total cost and cost change, average cost per session, cache hit rate, token breakdown, cost by model, top spenders, and ranked optimization insights. You can now also capture prompts and model responses into the admin-only AI Claude Sessions dataset to see what each session actually produced. Learn more
AI cost monitoring and optimization insights
AI cost (A new Cost section in AI Center pairs monitoring widgets) cost KPIs, model breakdown, token distribution, and top spenders, with optimization insights that scan live span data for costly patterns like truncated responses, runaway tool loops, and untapped caching, then surface ranked, span-linked suggestions. Learn more
Multi-agent view (Span Tree) in AI Explorer
The AI Explorer trace view now includes a Span Tree that renders the full agent graph, every agent, tool call, and LLM step as a node, with latency and token counts per node. Quickly see which step in a multi-agent chain is the bottleneck or the source of a failure. Learn more
Session Replay correlation in AI Explorer
AI Explorer now links each LLM span to the user's RUM Session Replay. Open a span and select Watch session to jump to the recording of the user's frontend activity, scoped to a 60-minute window around the AI interaction. The integration works when the Coralogix RUM SDK is installed on the frontend triggering the LLM call and trace context propagates through to the LLM backend. Learn more
OpenTelemetry-native integration for AI Center
AI Center now natively ingests the standard OpenTelemetry GenAI semantic conventions, no Coralogix-specific SDK required. Instrument with any open-source library that emits gen_ai.* attributes (OpenLLMetry, OTel contrib, Microsoft.Extensions.AI, and others), or create spans manually. Both the new (v1.37+) and legacy (v1.28–v1.36) formats are supported. Learn more
AI Center alerts and metrics
AI Center alerts and metrics. Deploy a prebuilt observability pack for AI applications. The AI Center Alerts extension installs five events-to-metrics that convert AI spans into Prometheus-style metrics, plus five metric threshold alerts on top of those metrics, covering error rate, latency, cost spikes, security issues, and quality issues. Use the alerts as-is, customize them, or query the metrics directly to build your own alerts and dashboards. Learn more
Cora AI deprecation

Cora AI is being deprecated. All Cora capabilities (DataPrime Query Assistance, Explain Log, and Knowledge Assistance) are now available in Olly, the Coralogix AI observability agent. All future development and documentation will be in Olly. Learn more
Strands Agents integration
Strands Agents integration. Monitor applications built with the Strands Agents SDK. The integration enriches the SDK's built-in OpenTelemetry traces with GenAI semantic convention attributes, covering prompt content, completions, tool calls, and user identity. Learn more
AI Guardrails and AI Center restructure
AI Guardrails. Intercept and block harmful, non-compliant, or low-quality AI outputs in real time, before they reach users. Apply prebuilt policies for prompt injection, PII detection, and toxicity, or define custom policies using natural language. Every guardrail invocation creates an AI span for full unified observability in AI Center. Learn more
AI Center restructure. AI Observability is now AI Center, a complete platform for observing, guarding, and evaluating AI applications. The new structure covers Monitoring, Guardrails, Evaluations, AI SPM, and Code Agents Intelligence under a unified navigation. Learn more
Codex CLI integration. Connect Codex CLI to Coralogix to stream API requests, tool calls, and session traces using built-in OpenTelemetry support. Learn more
Code Agents Intelligence
Code Agents Intelligence. Monitor AI coding agent activity across your organization directly in Coralogix. Track token usage, costs, code impact, and user behavior for Claude Code and Codex CLI from a single dashboard. Learn more
LangChain integration and OAuth 2.1 support
LangChain Integration for AI Observability. Learn more
OAuth 2.1 for AI Integrations. Learn more
LiteLLM and Gemini SDK support
LiteLLM and Gemini SDKs for AI Observability. Learn more
Coralogix AI Center launch
Coralogix AI Center. Launch of native AI observability solution directly within Coralogix. The new AI Center is the first observability solution built to treat AI as its own stack. Learn more
Cora Knowledge Assistance and Academy
Ask Any Question, About Any Feature, Anytime. Get instant, documentation-based answers with Cora's Knowledge Assistance. Use natural language to ask questions and receive real-time responses. Learn more
Cora AI in CX Academy. A brand-new section in Academy all about Cora AI. Learn more
AI-powered log investigations
AI-powered log investigations. Coralogix now transforms complex logs, from any application, subsystem or severity, into simple explanations, surfacing what happened, the impact and the significance of an event. Learn more
GenAI Query Assistant
GenAI Query Assistant. An AI-powered search feature that lets you use natural language for querying data. It translates your request into Coralogix's DataPrime query language. Learn more