Cases
How far back Cases analytics reaches
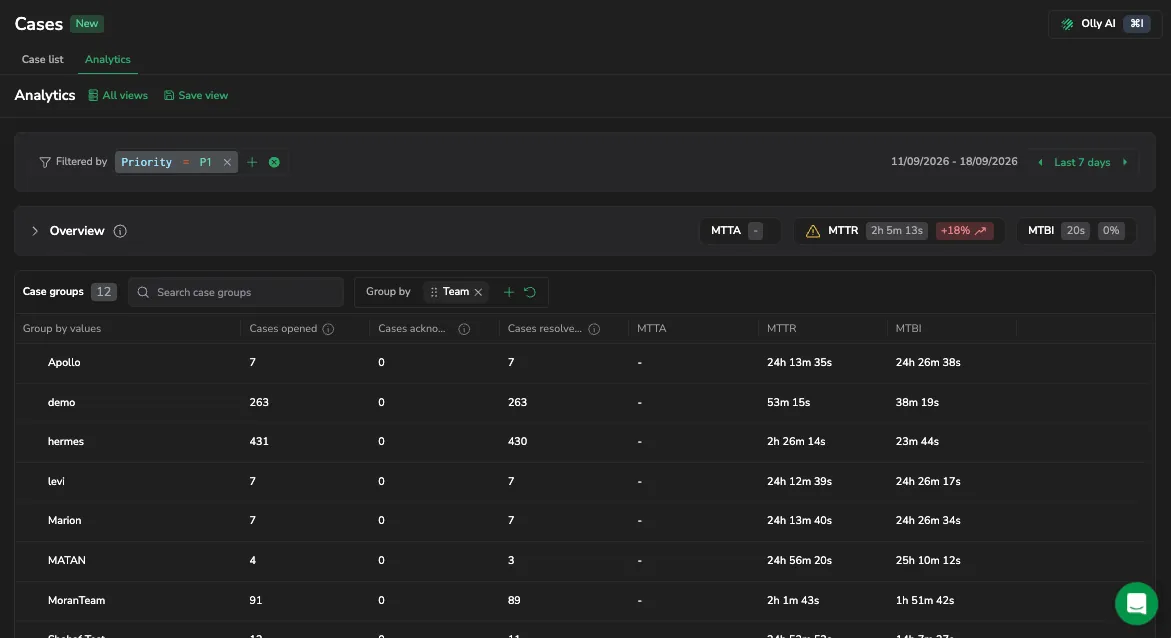
The Cases analytics page now states that analytics began accumulating data on April 16, 2026, so a custom range cannot start earlier. Previously a range reaching further back was simply rejected, with the reason visible only in the error message.
Turn off Case auto-resolution per alert
A Case used to resolve itself the moment its alert stopped firing, which quietly drops work off the queue for investigations that continue after the signal clears. Every alert's Case settings now include an Auto-resolve Case when the alert resolves toggle: turn it off and the Cases that alert opens stay open until a person resolves them, whatever the signal does. Those Cases carry a Manual Resolution Required badge in the case list and the case view once the alert recovers, and the timeline still records that the signal cleared, so you can tell an alert that stopped firing apart from an investigation that is finished. Learn more
Bulk actions, impacted entities, and column controls on the case list
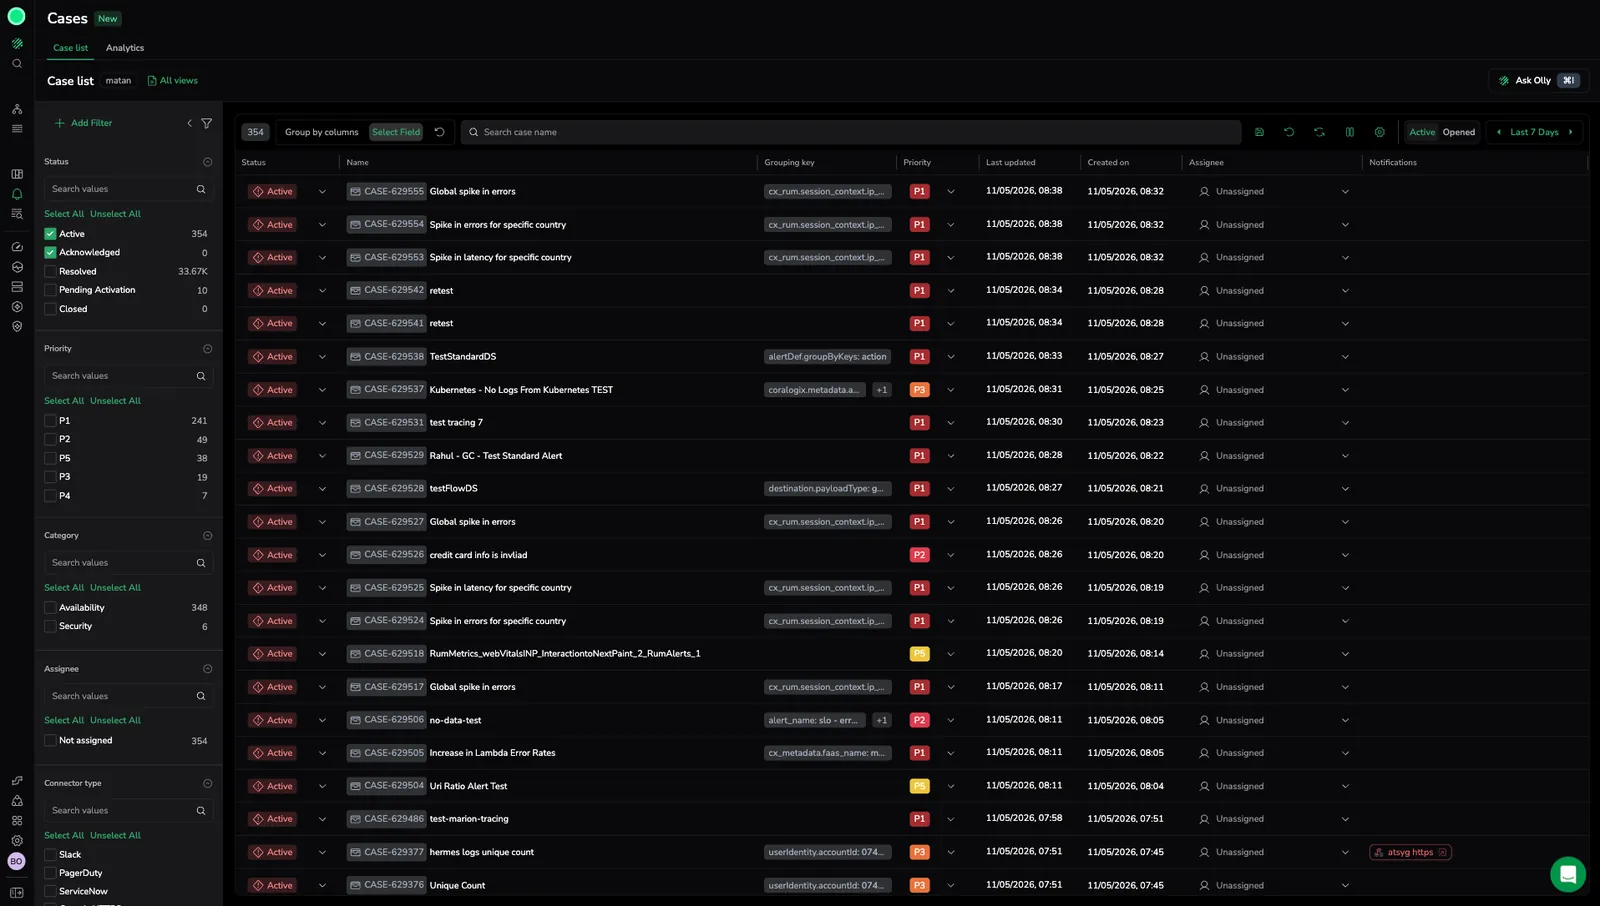
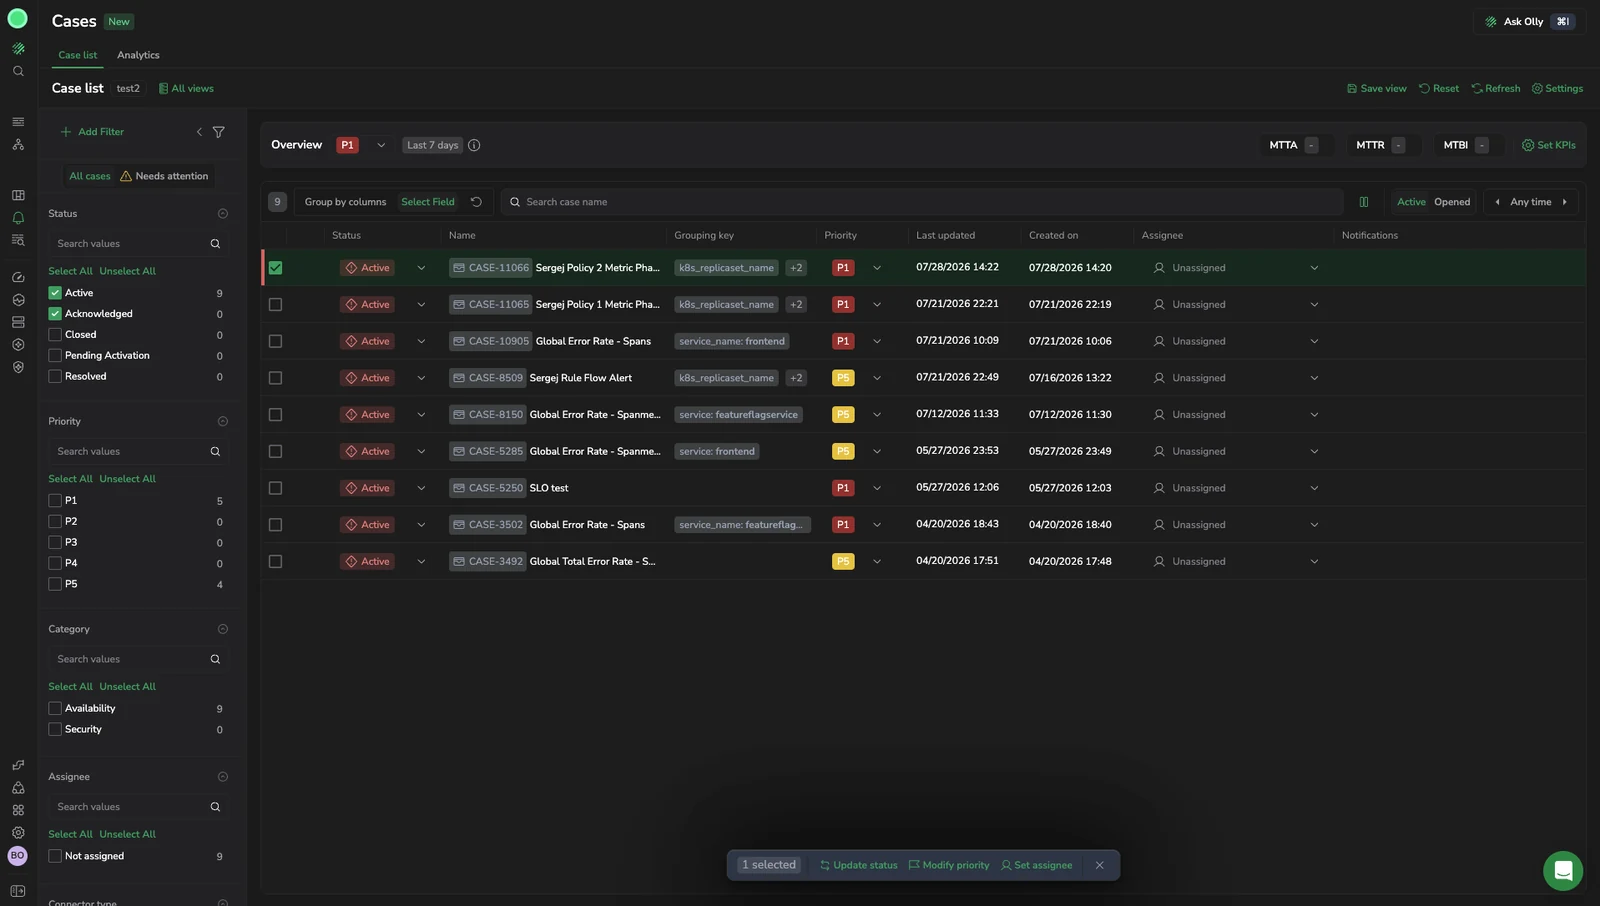
The case list is now a triage surface rather than a queue you work one row at a time. Select any number of Cases and update status, priority, or assignee in a single action. The new Impacted entities column names the APM services and databases each Case affects, with a link into APM, then Service Catalog, scoped to the list's time range, and the new Source column shows what opened the Case. Manage columns now shows, hides, reorders, and pins columns, including any grouping key in your data. A saved view keeps that layout. Learn more
Dynamic Case title and description
Ten Cases from the same alert definition used to read identically, so telling them apart meant opening each one. Template the title and description on the alert definition instead, and each Case is named for the signal that opened it. A title template of [{{ alertDef.priority }}] {{ alertDef.name }} on {{ alert.groups["service"] }} renders as [P1] Checkout 5xx spike on checkout-api. The syntax is the one you already use in Notification Center. Learn more
Time to update KPI
A third response time KPI joins Time to acknowledge and Time to resolve. Time to update sets how long a Case may go without activity, and its clock restarts on every update, so it only breaches when a Case has genuinely stalled rather than when it is simply taking a while. Set a target per priority, up to 15 days. Learn more
Bidirectional PagerDuty sync
Cases and PagerDuty incidents now stay in step in both directions. Connect with a PagerDuty API key and a user email, then acknowledge, resolve, comment, or add a resolution note on either side and the other follows. PagerDuty activity lands on the Case timeline next to Slack and ServiceNow events, and a link in the Case header opens the matching incident. Learn more
Case management from the Coralogix CLI
Run the whole Case lifecycle from your terminal: inspect a Case, acknowledge it, assign it, set priority, comment, resolve, and close, with the timeline and notification history in view. The same skill teaches AI coding agents the lifecycle and its guardrails, and the cases dataset is queryable for mean time to acknowledge (MTTA), mean time to resolve (MTTR), mean time between incidents (MTBI), active counts, and KPI breaches. Learn more
Alert evaluation chart in Slack Case notifications
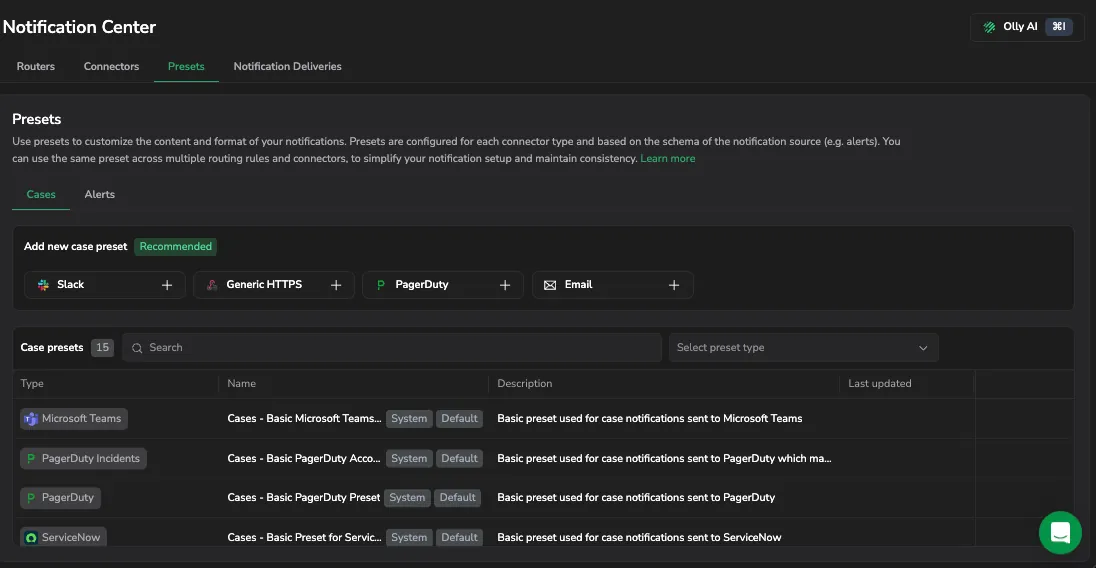
Slack Case notifications now carry the alert evaluation chart as an image, rendered when the Case opens so it shows the behavior that triggered it rather than the state at the time you read the message. Responders can judge severity from the channel before opening the Case. Attached by default; a custom preset controls how much context it sends under Settings, then Attachments. Learn more
Response time KPIs
Set Time to acknowledge and Time to resolve targets per Case priority so the list tells you which open Case is slipping rather than only which is newest. Cases that miss a target collect under the Needs attention filter, record a KPI Breached event on the Case timeline, and carry a KPI status field on routed notifications. Learn more
Resolution reason when you close a Case from Slack
Resolving or closing a Case from Slack now asks for a resolution reason and writes it back to the Case, so the postmortem context is captured where the work actually happened instead of being lost in a thread. Learn more
Cases analytics
The Analytics tab answers how the team is performing over time, where the case list answers what is happening now. It reports MTTA, MTTR, and MTBI against the previous period, breaks the same metrics down by team, service, priority, or another dimension, and drills from any row back into the Cases behind the number. Analytics views save with their filters and time range. Learn more
Slack link previews for Cases
Paste a Case URL into Slack and it expands into a preview with the title, priority, status, owner, and the AI summary when one exists, so nobody has to open the Case just to learn what it is about. Requires Slack integration v0.1.0 or later. Learn more
APM entity links from a Case
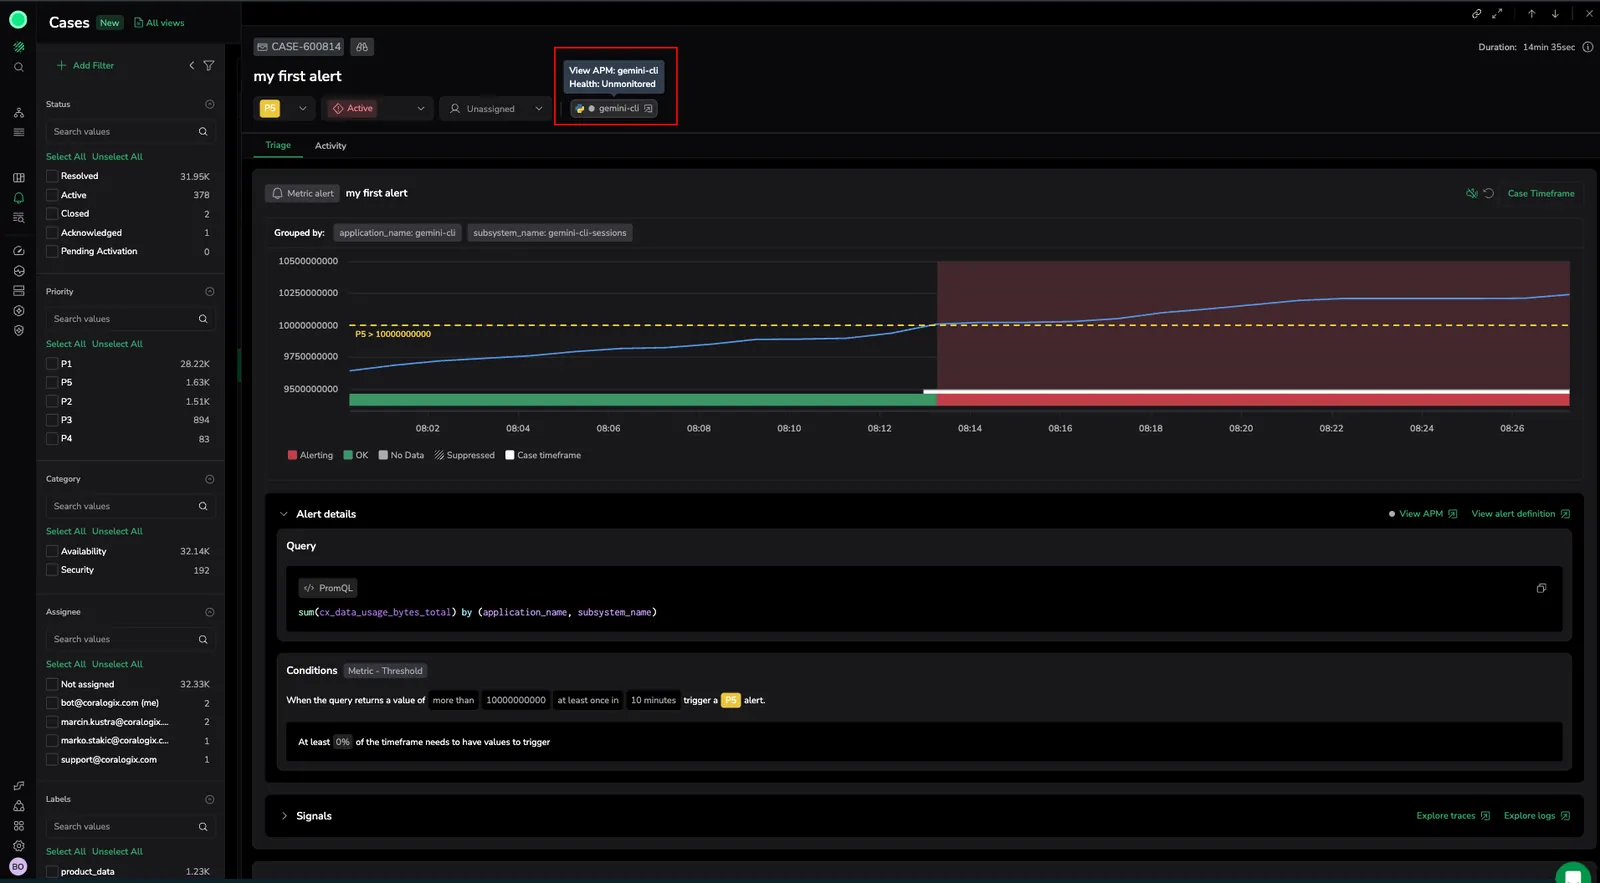
Select the APM entity chip in the Case header to open that service in APM, then Service Catalog, with the time range already scoped to the Case. In a Case spanning several permutations, every entity gets its own link in the header and in the Triage groups list, so you pivot to the service in question instead of hunting through labels. Learn more
Open Cases with filters and time range preserved
Open in Cases on the Related cases panel now carries the filters and time window through the URL, so a quick scan inside one Case becomes a full investigation without rebuilding the view. Learn more
Unacknowledge a Case
Move an acknowledged Case back to Active when triage changes hands or the first responder turns out not to be the right owner. Learn more
Cases saved views
Save the current query, filters, table settings, favorite fields, and time range as a reusable view, then reload it from All views. Set a default view, lock the time range, clone a view to fork a workflow, and share a view by copying its URL. Learn more
Two-way Slack sync for Cases
The Coralogix Slack app syncs comments in both directions and puts acknowledge, assign, resolve, and close in the channel, so a Case can be worked entirely from Slack and still stay accurate in Coralogix. Notifications thread rather than stack, and Olly summaries pick up the Slack discussion as context. Learn more
Customizable columns and grouping keys
Add, remove, resize, and reorder the columns on the case list, and promote a grouping key such as service, deployment, or instance to a column of its own. Save the result as a Cases saved view so a team lands on its own layout. Learn more
Active and Opened tabs on the case list
Two tabs scope the list by time in different ways. Active shows Cases with any state change in the selected range, so you see everything that moved recently. Opened shows only Cases created in the range, which is the view for judging incoming volume. Learn more
Created time filter
Filter Cases by when they opened, independently of when their status last changed, so you can see exactly what arrived in a window without long-running Cases crowding the view. Learn more
ServiceNow comment sync
Comments and resolution notes added on a linked ServiceNow incident flow into the Case timeline in real time, so the Coralogix side stays current without anyone copying updates across. Learn more
Suppression rules on the Case
When a suppression rule affects the alert behind a Case, the Case names the rules that apply and links to each one, and you can mute the alert definition from the Case header. That answers "why did this fire" and "why did that one not" without leaving the Case. Learn more
Notification evidence on the Case
The Activity tab records every notification the Case sent through Notification Center, with a link that opens the matching Slack thread, ServiceNow ticket, or email. Use it to confirm the right people were paged, and to join the conversation already happening in the destination tool. Learn more
Matching logs on logs/traces ratio Cases
A Case opened by a logs/traces ratio alert now displays the matching logs directly, so investigating one no longer starts with copying a query into Explore. Learn more
Status and priority filters on Related cases
Filter the Related cases panel by status and priority inside the Case, instead of returning to the full list to narrow it down. Learn more
Quick start guide and Case routing
A quick start walks you from a first Case through Case settings to a verified notification. Routing rules can now trigger on Case lifecycle events and use ownership labels, so Cases route on the same model as alerts. Learn more
Cases public preview

Cases became available to all customers as a public preview, running on the same data as classic Incidents with a grace period to switch back. Learn more
Streamlined investigation flows for faster MTTR
An expandable side panel, single-step evidence collection, and flexible viewing options cut the context switching that stretches out an investigation. Learn more
Investigations
Investigations centralizes evidence collection, event timelines, and team collaboration for incident response. Learn more