Continuous Profiling
Java memory profiling SDK 1.0.27 and setup corrections
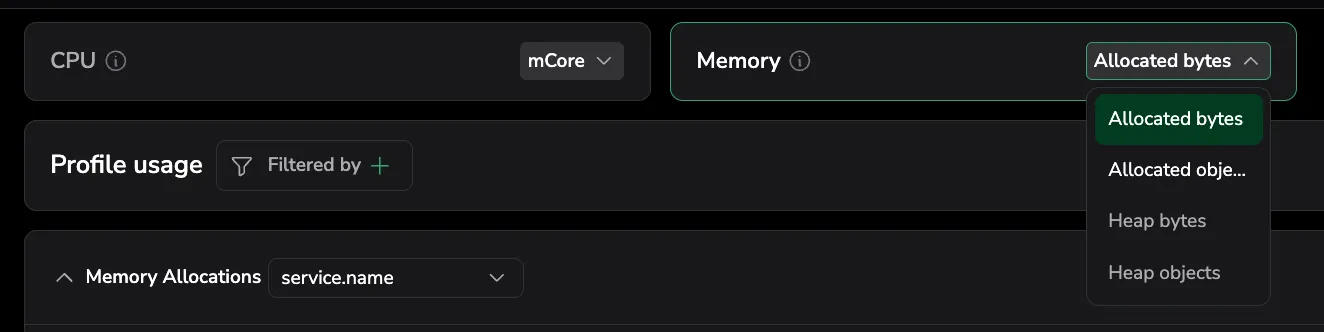
Java SDK 1.0.27: The Java memory profiling instructions now target com.coralogix:continuous-profiler:1.0.27. This release takes its Async Profiler native libraries from the upstream tools.profiler:async-profiler dependency rather than bundling them, so Maven Central must stay reachable alongside the Coralogix repository. The CX_PROFILER_COUNTER variable and its counter() builder option are no longer available, and the supported platforms are Linux and macOS.
Java SDK repository: The instructions now include the Coralogix Artifactory repository for Maven and Gradle. The com.coralogix:continuous-profiler artifact is not published to Maven Central, so builds that only declared the dependency failed to resolve it.
Java code sample: Corrected the import to coralogix.profiler.sdk.ContinuousProfiler, the builder entry point to ContinuousProfiler.builder.Memory(), and the profiling window method to interval(int). Learn more
Go memory profiling
Go memory profiling: Profile heap and allocation memory in Go services. Expose the standard net/http/pprof endpoints and enable the collector's pprof-receiver pull preset to surface Allocated bytes, Allocated objects, Heap bytes, and Heap objects in the service drilldown and the Profiles catalog, alongside the existing support for Java and Node.js. No SDK or code changes are required beyond enabling the profiling endpoints. Learn more
Node.js memory profiling, heap profiles, and wall-clock profiling
Node.js memory profiling: Profile heap memory in Node.js services with the Coralogix OpenTelemetry profiling SDK. Add the @coralogix/opentelemetry-profiling package to your service to surface Heap bytes and Heap objects in the service drilldown and the Profiles catalog, alongside the existing support for Java. Learn more
Heap memory profiles: Investigate live retained memory in your Java services with the new Heap bytes and Heap objects profile types, available alongside Allocated bytes and Allocated objects in the service drilldown and the Profiles catalog. The Profiles catalog memory view also adds Avg. heap bytes, Heap bytes, and Heap objects columns. Learn more
Wall-clock profiling: Find latency that does not show up in CPU profiles. The CPU card on the service drilldown now offers a Wall variant alongside mCore, and the Profiles catalog CPU view exposes new Avg. wall and Wall samples per second columns. Learn more
Right-click context menu on flame graph rectangles
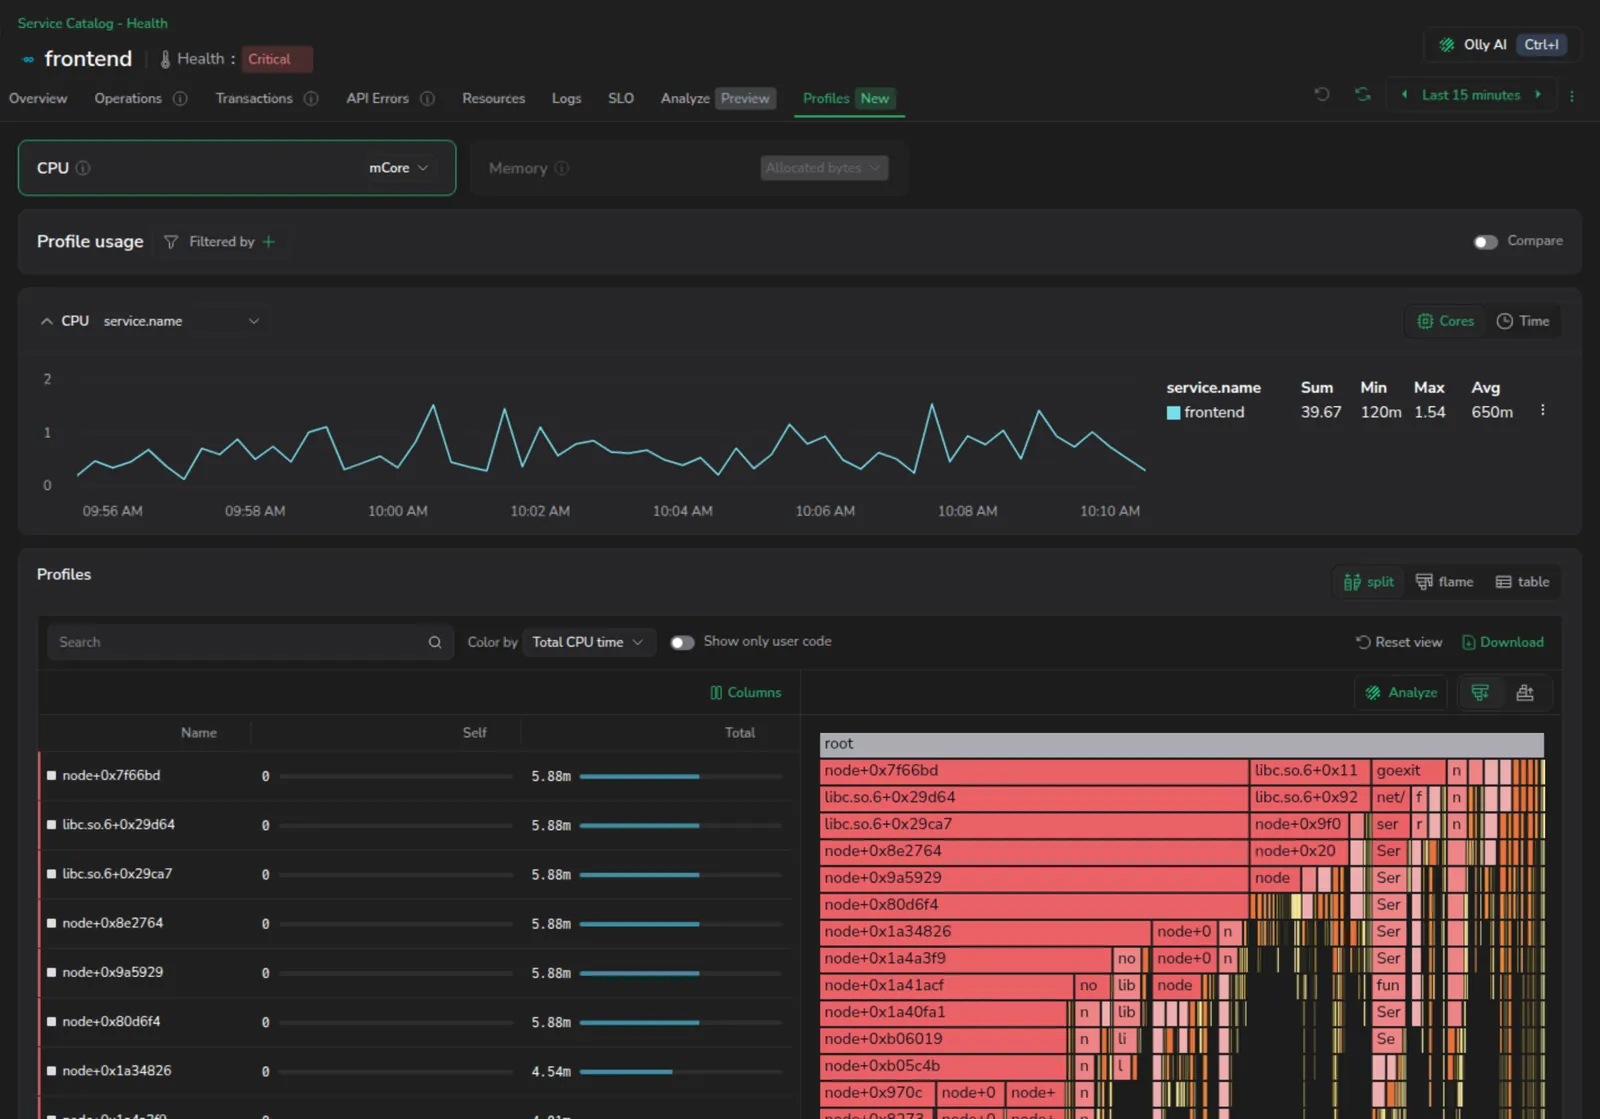
Right-click any frame in the flame graph on the service-drilldown Profiles tab to open a context menu with four per-frame actions. The menu is available in both Explorer and Compare modes. Learn more
Show only user code toggle for flame graph and stack-trace table
Filter the flame graph and the stack-trace table on the service-drilldown Profiles tab to your own application code with the new Show only user code toggle, next to the Color by dropdown. The toggle is on by default, so library, runtime, native, and kernel frames are hidden from view, letting you focus on actionable code paths the moment you open a profile. The filter applies in Explorer and Compare modes, and to both CPU and memory profiles. Learn more
Memory profiling for Java services
Profile memory allocations in Java services using the Coralogix Continuous Profiler SDK and Async Profiler. The Profiles catalog and service drilldown now support a Memory profile type alongside CPU. Learn more
Continuous Profiling on AWS ECS-EC2
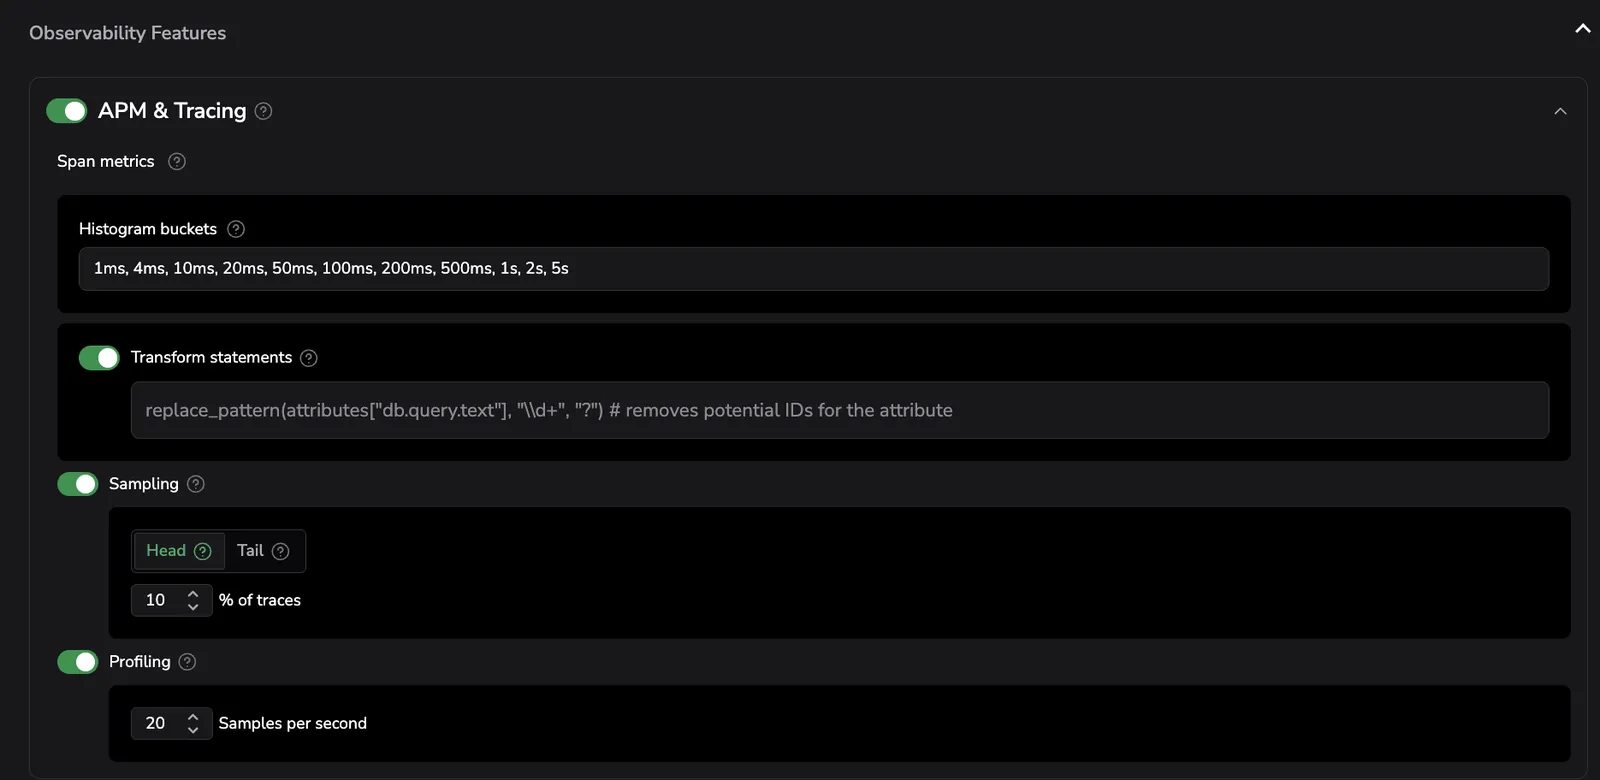
Enable Continuous Profiling for workloads running on AWS ECS clusters backed by EC2 container instances directly from the AWS ECS-EC2 OpenTelemetry onboarding flow. Learn more
Olly mini compare analysis and frame classification
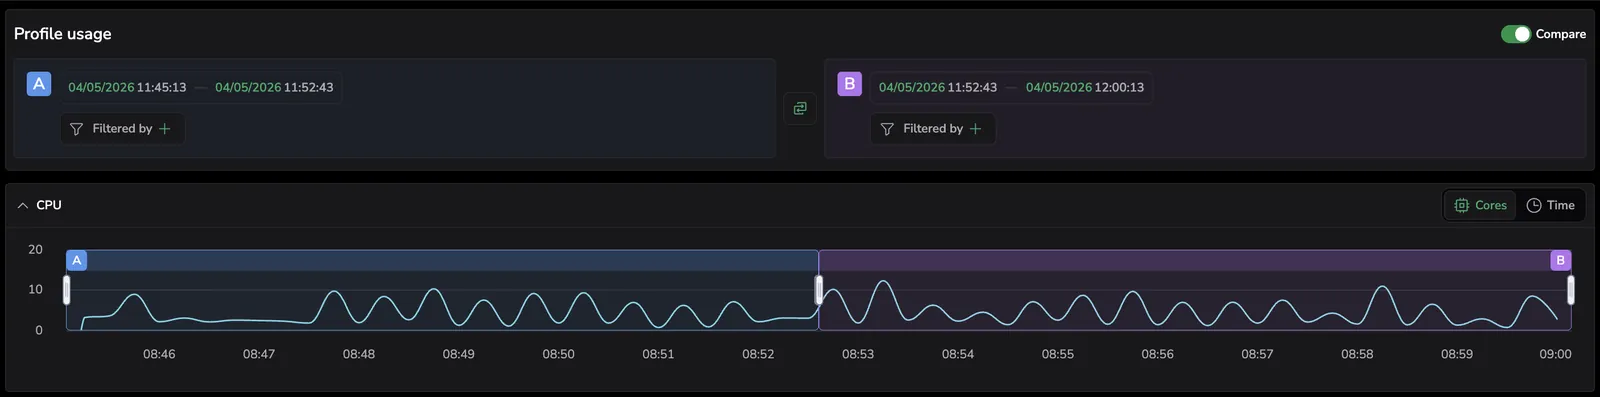
Analyze compare flame graph with Olly mini: Use AI-powered analysis in Compare mode to understand performance differences between two profiles without manually inspecting every function. Learn more
Color by frame classification: Color flame graph nodes by classification (User Code, Std Lib, External Lib, GC, Native, Kernel) to see at a glance where CPU time is spent across different code layers. Learn more
Guided onboarding tour: A guided tour now introduces key profiling capabilities when you first visit the Profiles tab. Learn more
Introducing Continuous Profiling
Introducing continuous profiling (Built on eBPF and powered by OpenTelemetry, Continuous Profiling captures high-frequency stack traces, CPU cycles, memory allocations, and more) without interfering with your application. Learn more