Explore Logs, Spans & other Datasets
Customize surrounding logs from the log details panel
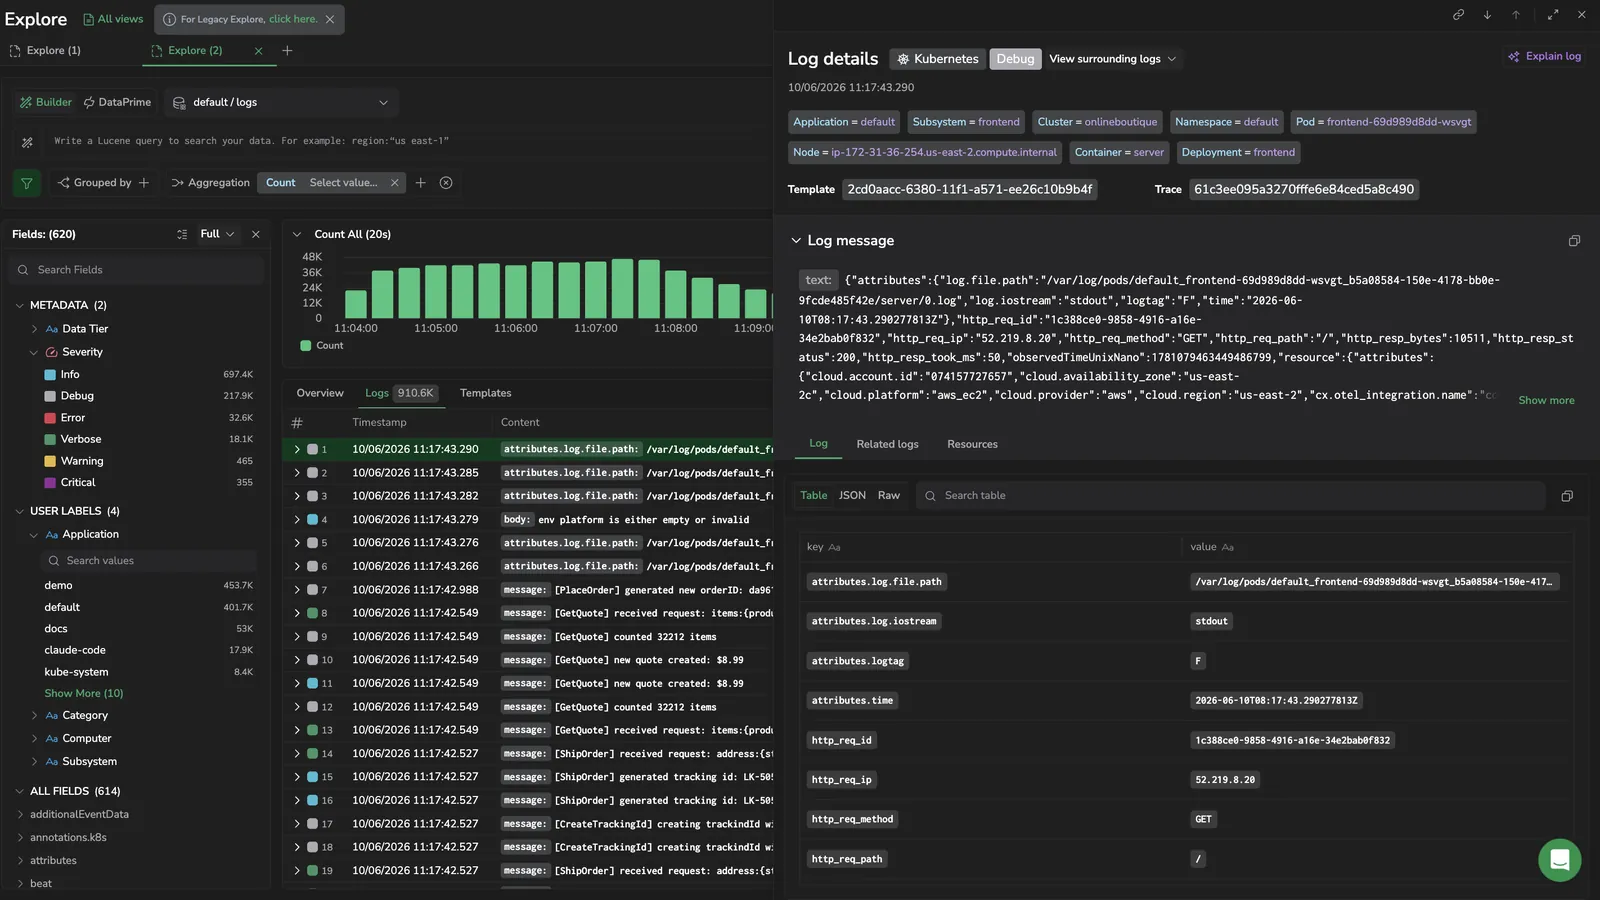
View surrounding logs in the log details panel now opens a Customize surrounding logs dialog. Scope the search with an editable query (it defaults to the log's application and subsystem) and set how much to load before and after the selected log: a duration (5 seconds, 30 seconds, 1 minute, or 5 minutes) or a number of logs (10, 30, or 50). Results open in a separate Explore tab, centered on the original log, up to 100 logs total. Learn more
Convert a DataPrime query back to Builder
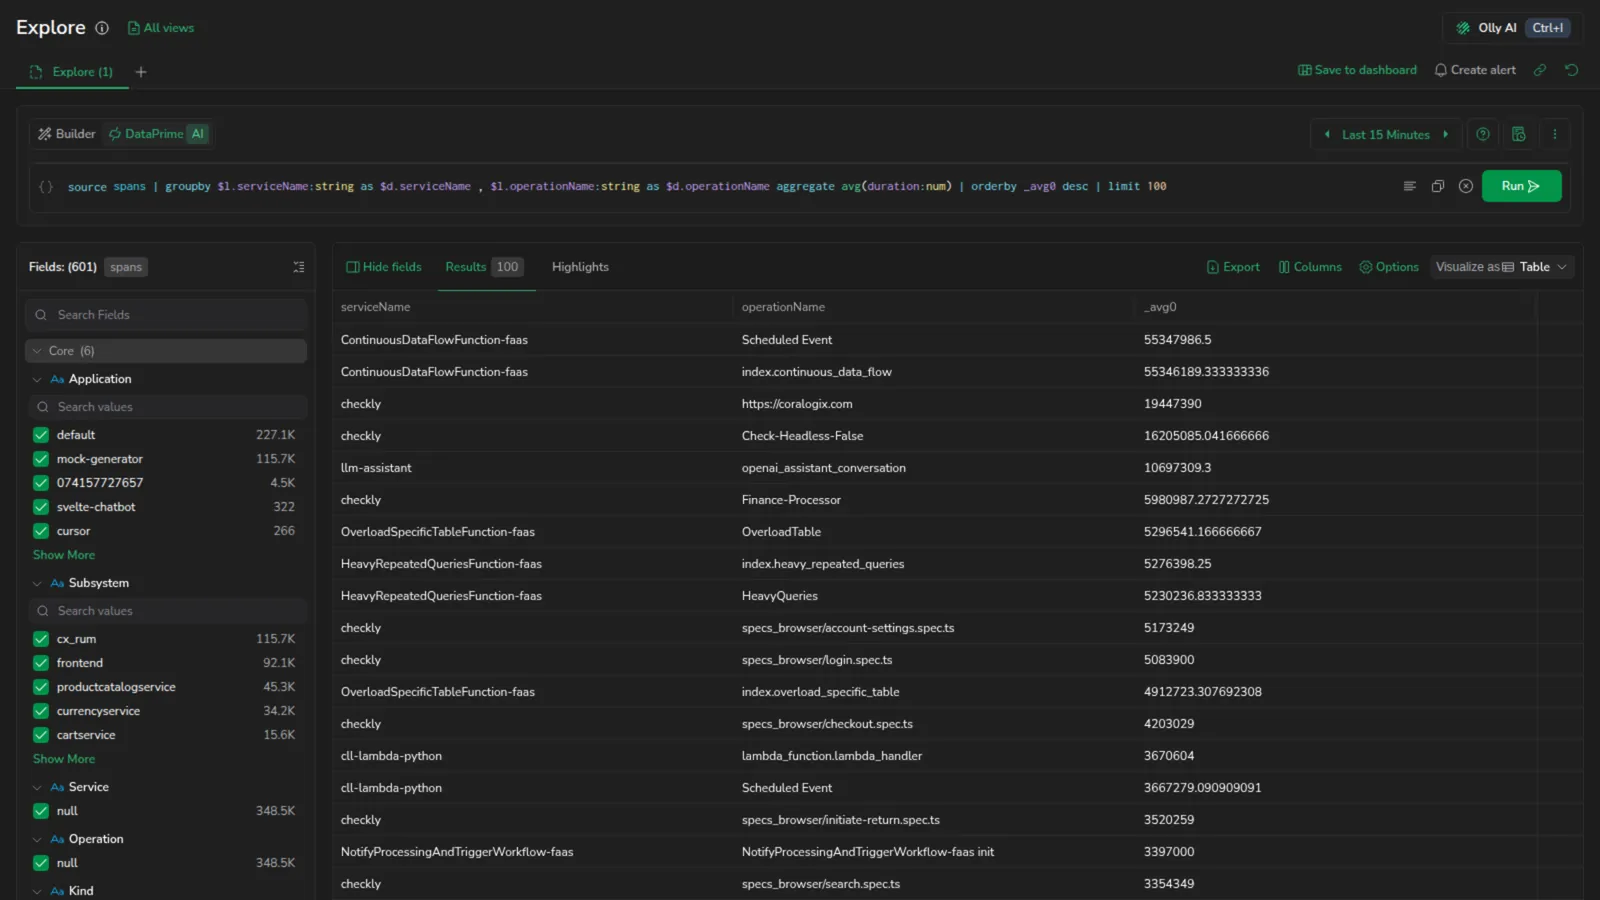
You can now switch from DataPrime back to Builder after editing the query, as long as it's a simple query (a source with filter, group by, and aggregation clauses). Explore translates it into the equivalent Builder query with no loss. Queries that are too complex to translate still open the Please note dialog. Learn more
Correlate logs to spans across multiple datasets

In the tracing drilldown Logs tab, Setup Correlations now maps correlation fields across multiple log datasets at once. Select the datasets to include, then map Log fields, Span fields, and Service fields; the keys are pooled from every selected dataset, so one mapping covers them all. Learn more
URL Builder removed from Explore
Explore URLs are now plain, human-readable parameters like ?query=…&dataset=…&duration=… that you can read, hand-edit, and build from scratch, so the URL Builder dialog is no longer needed. URL Builder is removed from the Explore actions menu. To build a deep link, set the parameters by hand; to share the view you're looking at now, use Copy URL. Learn more
A saved view's link opens the saved state
Opening a saved view's own URL showed the latest unsaved edits from an open tab instead of what was saved. Explore now reads each setting from the first source that has it - the URL, then the saved view, then the browser tab, then your lasting preference, then the default - so a link opens what the sender saw. The Content column's keys are also remembered per dataset now, so switching between datasets no longer carries one dataset's column layout onto another. Learn more
Invalid Builder queries show a red error state
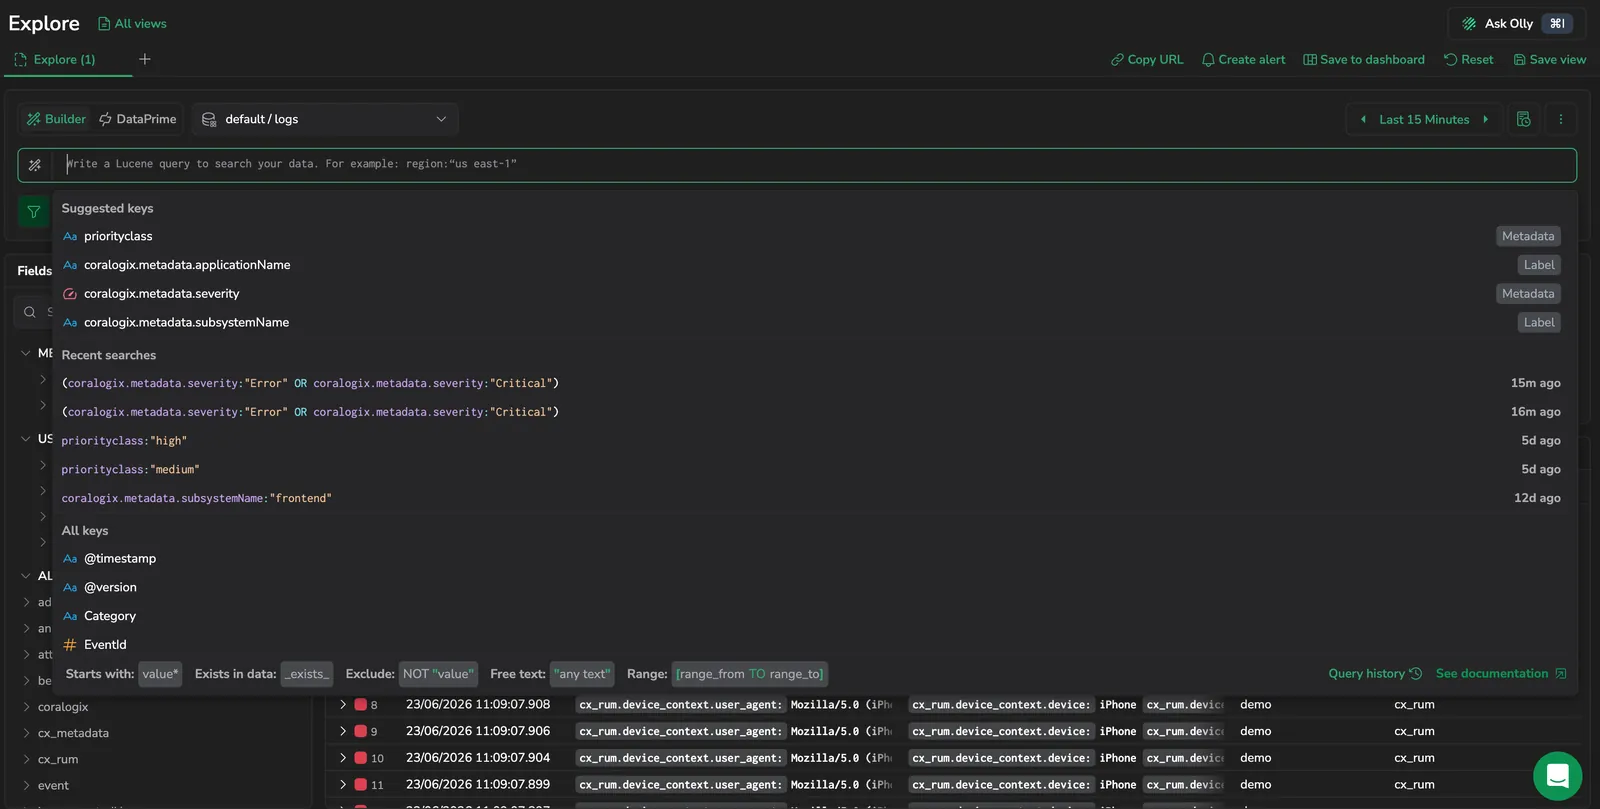
Run no longer locks when a Builder query is invalid, in either the chip builder or the Lucene editor. Select Run, or press Enter, and Explore sends no request, outlines the query bar in red, and a tooltip on Run gives the reason. An incomplete chip is outlined on its own instead of the whole bar: an aggregation chip with a function but no field, or, on spans datasets, a relation filter with no field or value. Your next edit clears the error, and nothing is marked while you type. Warnings still let the query run. Learn more
Query catalog is now Query history
The query drawer in Explore is renamed to make its purpose clearer. Query catalog is now Query history, its Recent tab is now Recents, and the Catalog tab, your explicitly saved queries, is now My saved queries. Only the labels changed, not how the drawer works. Learn more
Open a log's details with Space
In the Explore logs table, press Space on a highlighted row to open its log details panel. Enter no longer opens the panel, so it won't scroll the table out from under you. The same shortcut works for highlighted spans and traces, and in the logs correlation drilldown. Learn more
Expand or collapse a whole JSON log at once
When the logs table shows a whole log as a JSON tree, a Content cell set to Full log with the JSON log format, or an expanded detail row in JSON, an Expand all / Collapse all control sits next to Copy content. Select it to open every nested key at once, then collapse them again, instead of clicking through the tree level by level. Learn more
Copy and expand a log's content from the logs table
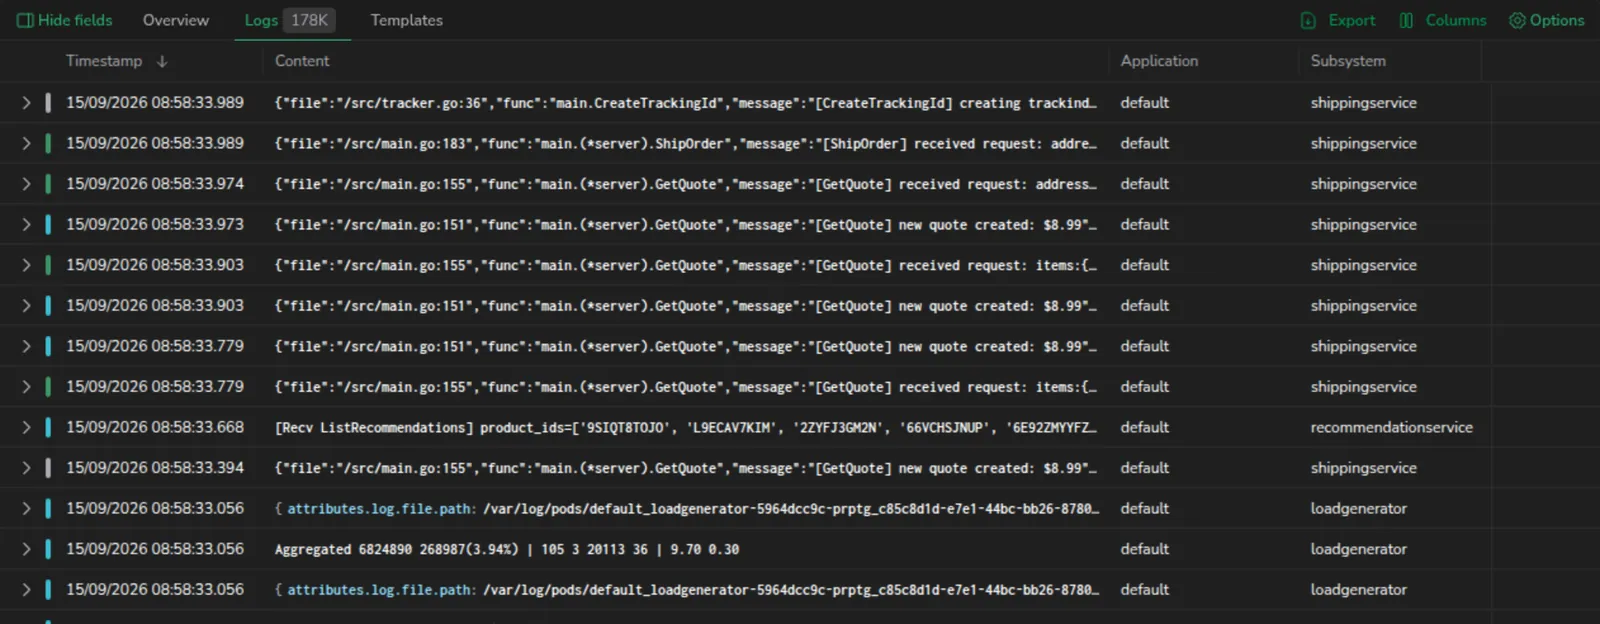
Hover a Content cell in the Explore logs table to get two new controls. Copy content, at the top right of the cell, copies the cell's content straight from the row. Show full content, at the bottom right, appears only when an entry is longer than the row can show: select it to grow that one cell to its full height, and Show less to return it to your Row size. Expanding a cell doesn't change your Row size setting or any other row. Learn more
Spot templates that stopped receiving logs
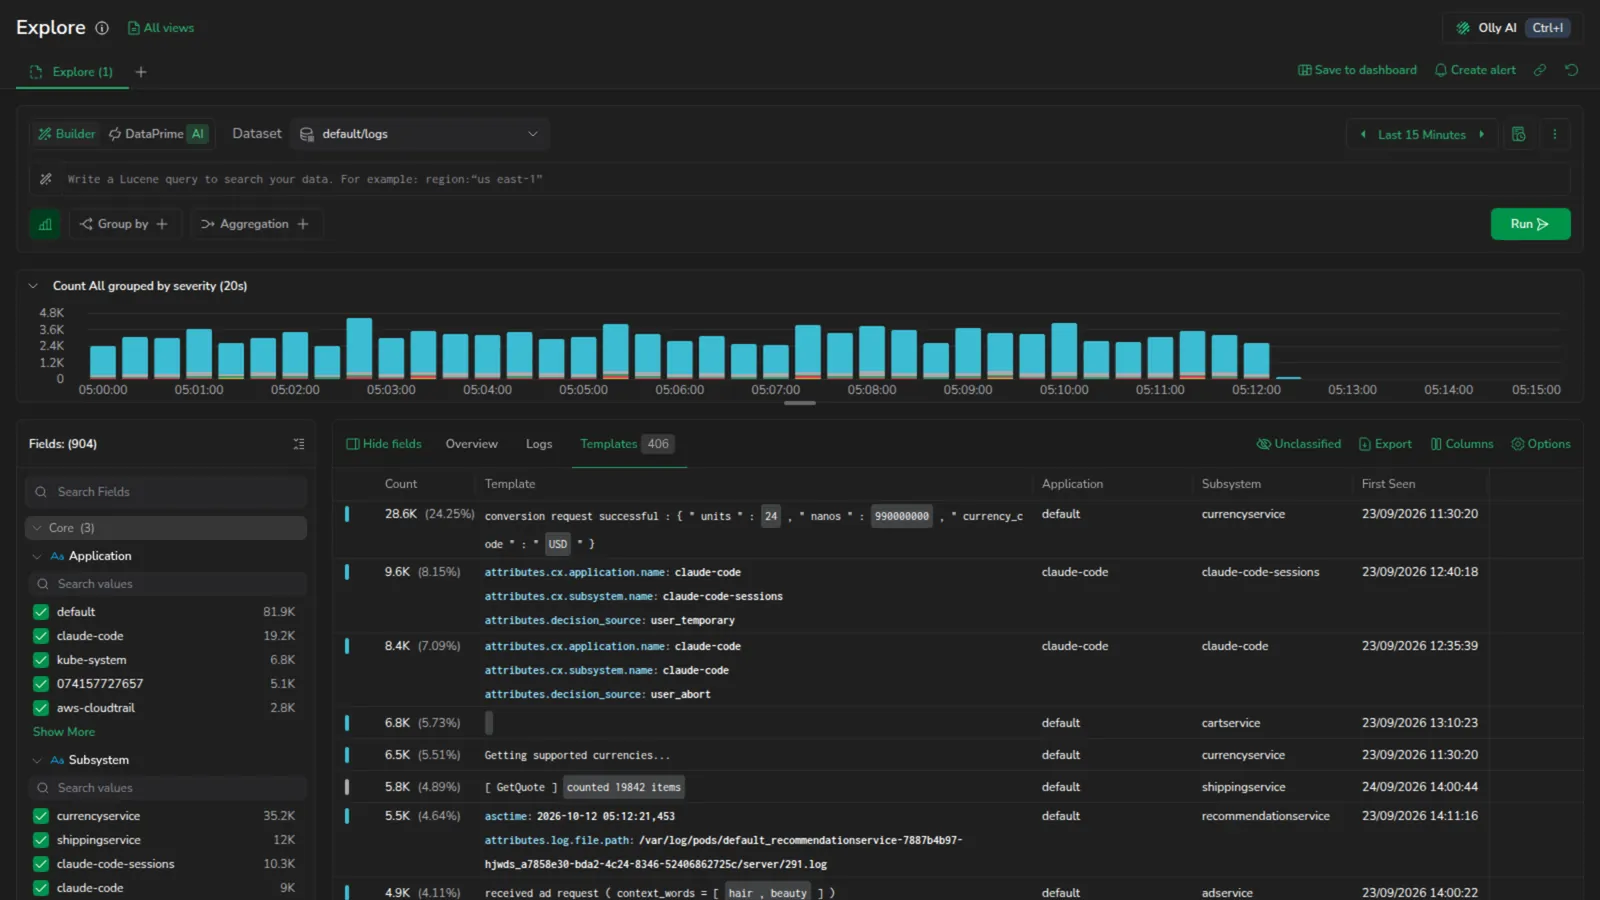
A log template that no longer receives new logs is marked Inactive template in place of its First Seen timestamp, with the same marker in the Template details panel. Read alongside First Seen, it tells you whether a pattern is genuinely gone - retired by a deployment or a config change - or simply quiet in the range you selected. Learn more
Builder blocks invalid queries before they run
In Builder mode, Explore now validates your query as you edit it. A query the parser can't accept is no longer auto-submitted: the Run control is disabled and a tooltip explains why, so you catch the problem before the search runs instead of reading an error afterwards. Warnings still let the query run. Learn more
Faster field values on long time ranges
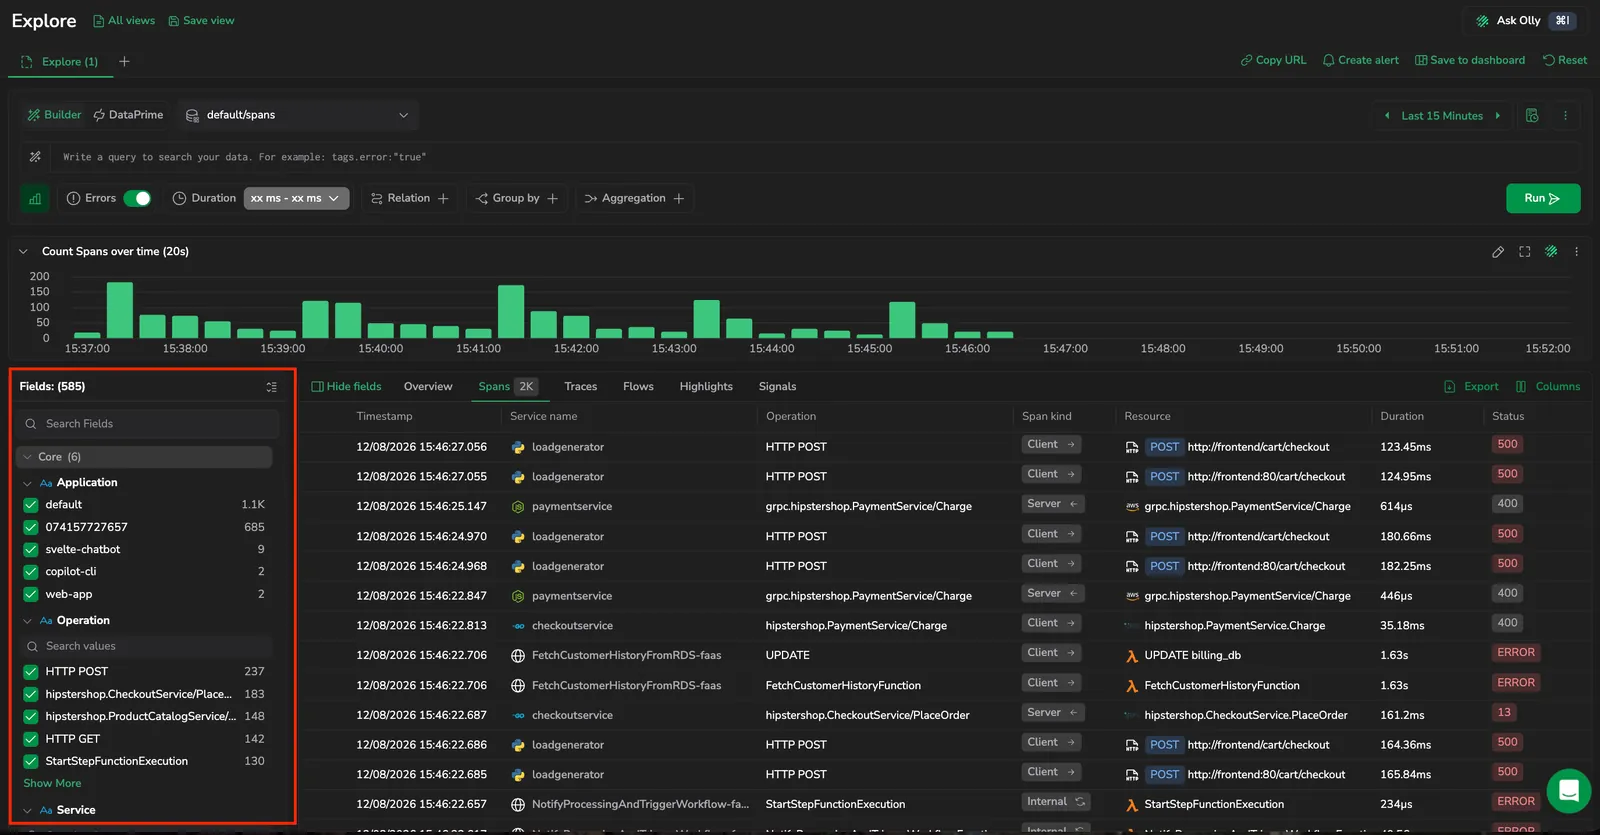
Expanding a field in the Explore Fields panel over a long time range no longer leaves you watching a placeholder. On ranges of about a day or longer, including the Last 24 hours preset, each value now appears straight away with a partial count, written with a leading tilde such as ~45K, that climbs toward the final number as more of the range is counted. The count pulses while it loads, and hovering it explains that the rest of the range is still being counted. The exact counts replace the partial ones in place as soon as they finish, and values keep their positions, so a value you were about to filter on doesn't move. Learn more
Row size and Log format in the logs table Options
The Options popover in the Explore logs table now opens with a Row size control that replaces the text-wrap toggle: S keeps every entry on one truncated line, M wraps it over up to three lines, and L over up to six. Two controls were also renamed to match what they do. Type is now Content, and it appears only while the Content column is among your selected columns, which you add or remove from Columns. Display is now Log format, and it applies wherever a whole log renders: expanded rows, the Source column, and Content cells set to Full log. Learn more
One context menu for every field in Explore logs
The logs table and the log details panel now share one field context menu. Selecting a key or a value opens the same menu, narrowed to the actions that apply to what you selected, and each action shows the field or field:value it targets: exactly what it writes to the query or copies to the clipboard. In the log details panel, the Application and Subsystem chips are now a single button. Learn more
Legacy Explore is deprecated

Coralogix will retire Legacy Explore, the Logs, Log Templates, and Tracing screens under /query-new/, on December 15, 2026. No action is needed for day-to-day investigations: you're moved to the new Explore automatically. Rebuild any bookmark, runbook, alert webhook, or script that builds a legacy link, since those redirect to the new Explore once the screens are removed. LiveTail and Visual Explorer are not affected. Learn more
Fields panel in DataPrime mode
The Explore Fields panel now works in DataPrime mode. Expand a field to filter by value, manage columns, and group by directly from the panel. Your selections are written as filter clauses at the start of the query, and the panel stays in sync with edits you make in the query bar. Learn more
Purpose-built columns for the RUM events dataset
When you query the rum.events dataset in Explore, the grid now opens with columns built for RUM data: the timestamp, a User name column resolved from the event's email, ID, or name, the event type, a Content column that shows the most relevant field per event type, such as the error message for errors or the resolved name for user interactions, and the application. A View in RUM Sessions action on any field value opens RUM Sessions filtered to that key:"value". Learn more
More chart types and a full view for field distributions
The Show distribution chart you open from a field now offers five chart types: vertical bar, horizontal bar, area, line, and pie. A Full view icon expands the chart to fill the screen, and Exit view collapses it back. Learn more
More Explore tabs, with an overflow menu
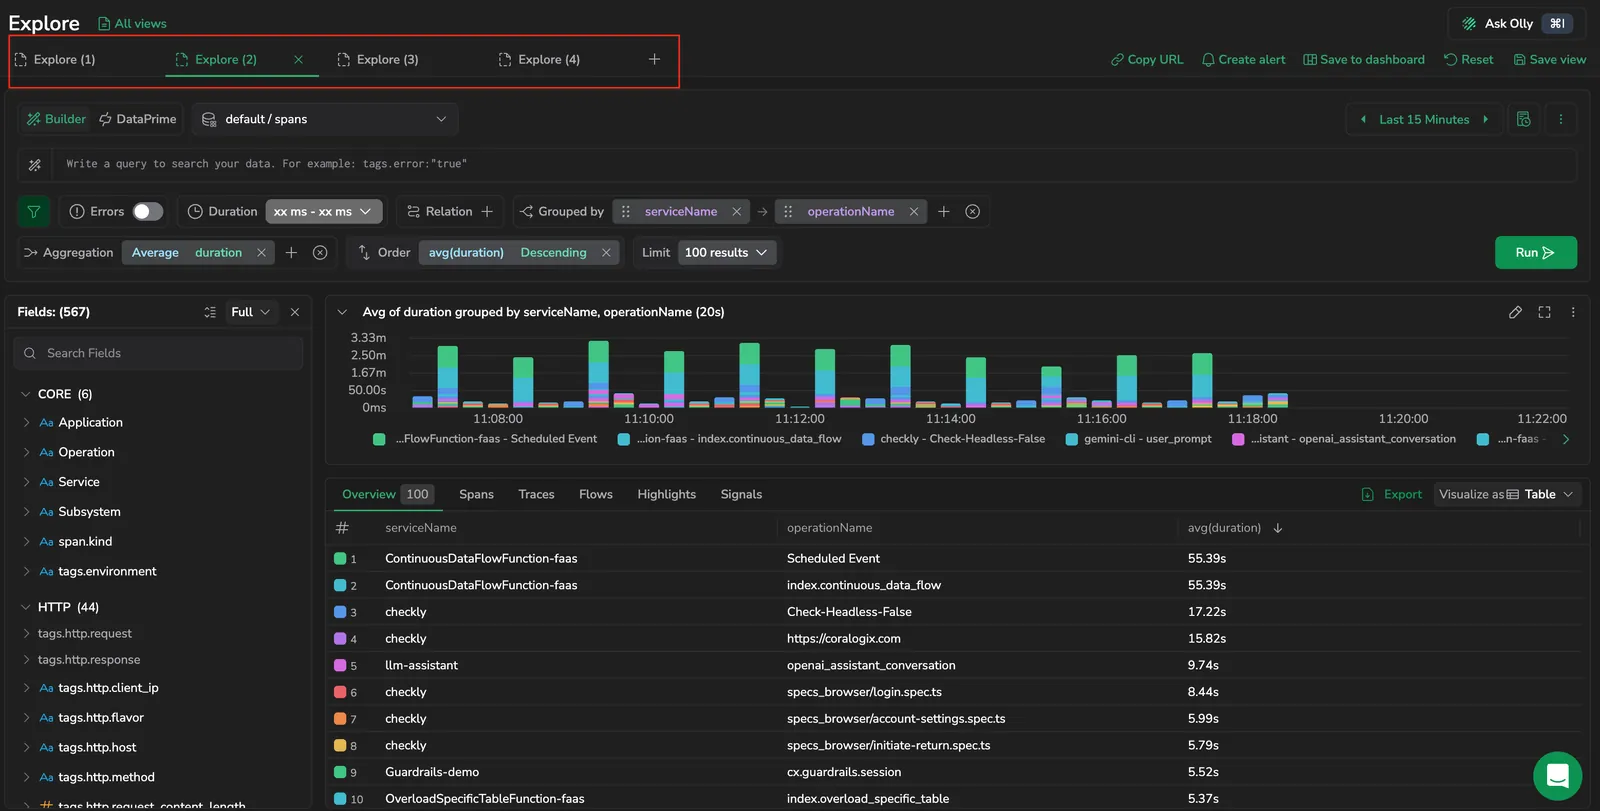
You can now keep up to 10 views open in Explore tabs, up from 5. When the tabs don't all fit across the bar, the extra ones collapse into an N more overflow menu instead of squeezing the page actions, and each tab label is truncated with a tooltip so long view names stay readable. Learn more
Free-text search matches are highlighted inline
When you run a free-text search in Explore, matching text is now highlighted where you read the data: in the logs table, and in the log details panel's Log tab across all three view modes, Table, JSON, and Raw. Your search term is called out in place, so you no longer have to scan a full log line or payload to find which part of the record matched. Learn more · Log details panel
Pause a running query
A query that is still executing in Explore can now be paused mid-run, in both Builder and DataPrime mode. If a search is taking longer than you expected, stop it where it is instead of waiting for it to finish. Learn more
Export timestamps in a readable format
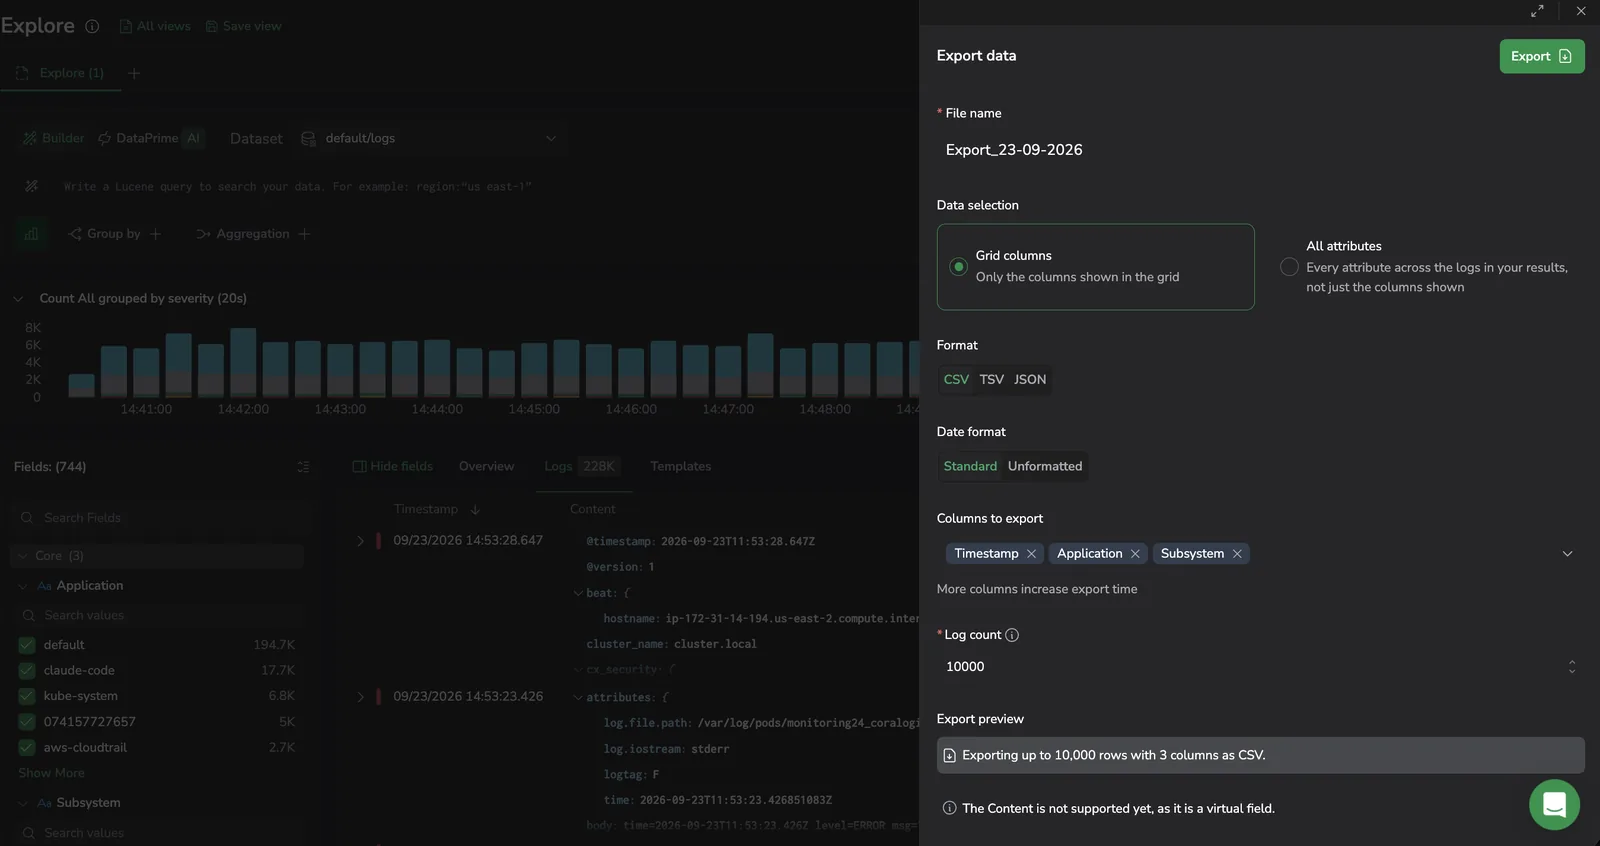
The Explore export dialog has a Date format control. Keep the default Standard to write the Timestamp column exactly as it appears in the grid, or switch to Unformatted to export the raw epoch value. Previously, CSV exports always wrote the raw epoch timestamp. Learn more
Pin keys to the top of every log
The Content column's key controls now live in a Manage keys drawer with two tabs. The Pinned keys tab pins body keys to the top of each log in the Full log view, in the order you set, so the properties you scan for first stay visible without changing the message. The Prioritized keys tab controls the message the Content column shows in the Message view. Open the drawer from the results toolbar: select Options, then Modify next to Manage keys. Learn more
Over-time charts in every Explore Tracing view

The Overview, RED metrics, and Outlier views in Explore Tracing now show their over-time chart alongside the results grid, so you can read the chart and the spans behind it together instead of switching between them, and the visualization updates with your query. RED metrics and Outliers previously lived in the Signals tab, which is now gone: a button group on the chart switches between Overview (the new default), RED metrics, and Outliers across every spans tab. Overview buckets the spans matching your query over time, with the group by, aggregation, and chart type following the current query. RED metrics charts rate, errors, and duration for those spans, and focusing a single chart expands it across the chart area. Outlier plots latency percentiles (P95, P99, and P99.9) and error counts over time, where each dot is a single span you can select to open its trace. Learn more
Choose which attributes the spans Resource column shows

The Resource column in the Explore Spans and Traces tabs picks the most descriptive attribute on each span, such as an HTTP route, a gRPC method, a database operation, or a messaging topic. You can now decide that order yourself. On the Spans tab, select the settings icon in the Resource column header to open the Resource column keys panel, then reorder, add, or remove keys the same way you do for the logs Content column and select Apply. Return to default restores the built-in priority, and your selection is stored with a saved view's table settings. Learn more
New row display options and expandable rows in the logs table
The Explore logs table has a new Options popover for controlling how rows render: turn on Text wrap to wrap long entries, show or hide the Content column, switch the Content column between Message and Full log, and pick a Display style (JSON, Condensed, or List) for wrapped rows. Each row can also expand in place: select the expand control or double-click a row to reveal the full log's attributes, or press Enter to open the log details panel. Learn more
Reorder, remove, and restore any Content column key
In Explore, the Content column key list is now a single reorderable set. Prioritized keys appear as numbered chips, and the built-in default keys, which used to be fixed, are now ordinary chips you can reorder, remove, and restore alongside your own. A Return to default action restores the default set, and changes take effect when you select Apply. Learn more
Group-by charts no longer show misleading empty gaps
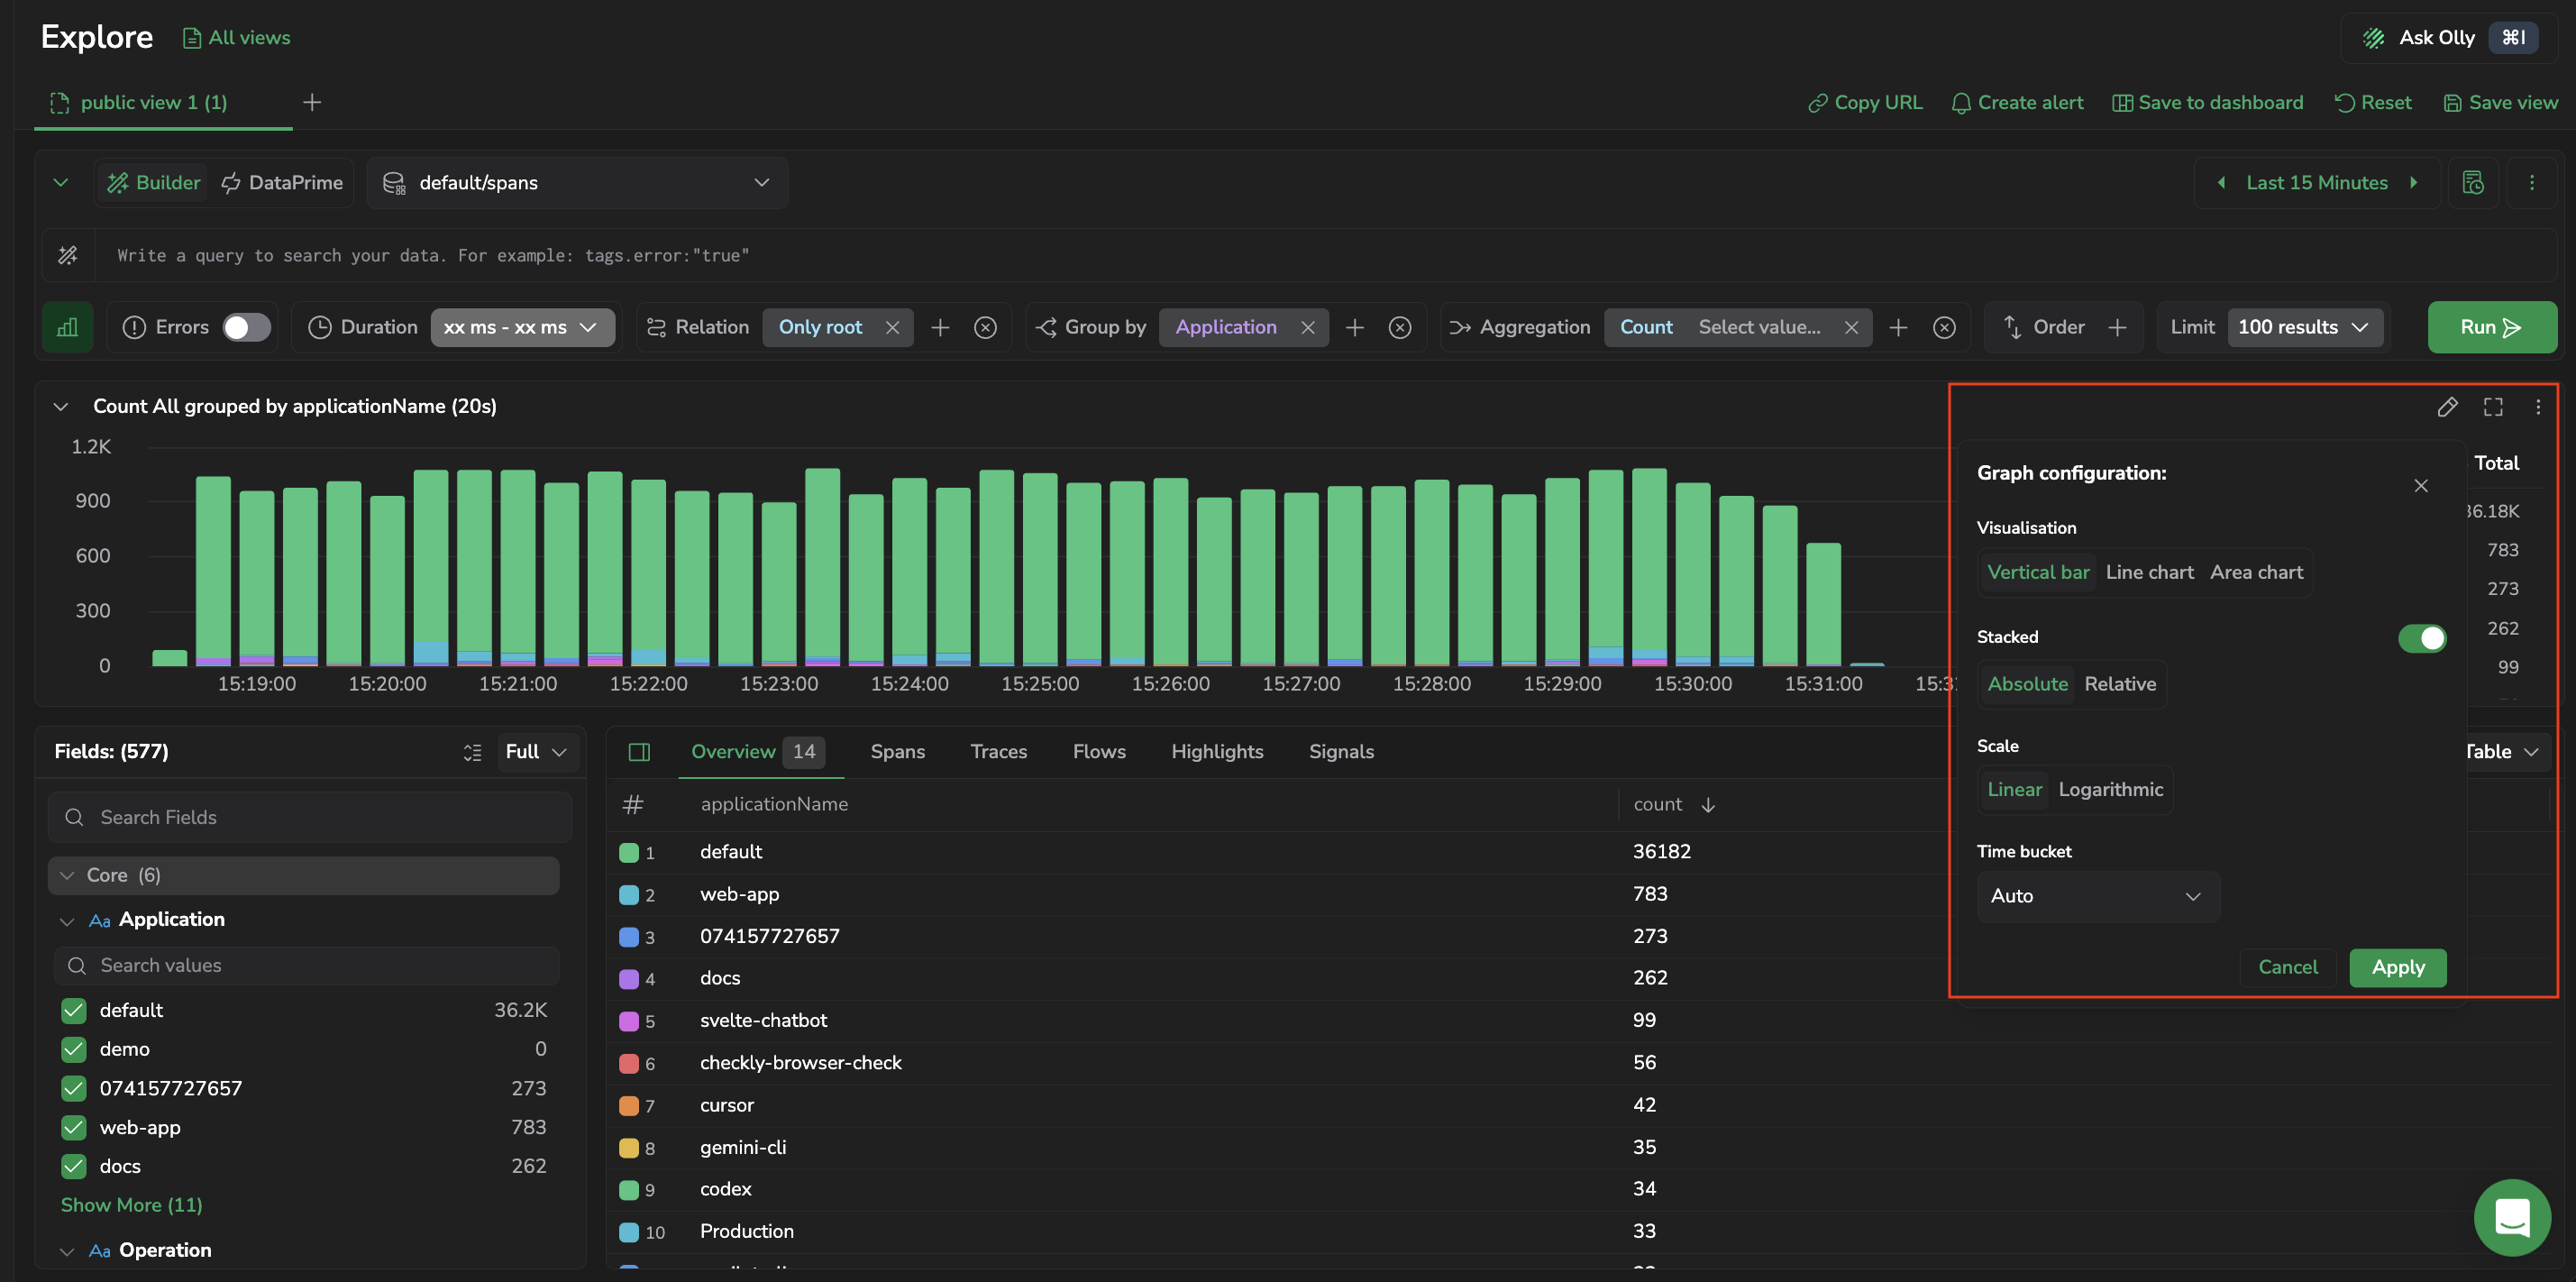
Grouping the Explore time-series chart by a high-cardinality field no longer leaves buckets looking empty when their data belongs to groups the chart doesn't draw individually. Those groups now fold into a single Other (N) series for Count and Sum aggregations, so every time bucket reflects the data that exists. In the field distribution panel (Show distribution), the heading now shows the field's true number of distinct values, and reads Top 50 of N when a field has more than 50 values. Learn more
Export up to 50,000 rows from Explore
Explore exports now allow up to 50,000 rows across all datasets (the Logs and Spans tabs and DataPrime queries) five times the previous 10,000-row limit. The export dialog defaults to the higher cap, so you can pull larger result sets in a single CSV, TSV, or JSON file. Learn more
Span status badges show orange for inferred errors
Explore spans and the trace drilldown now show an orange status badge when a span returns a failing HTTP or gRPC status but isn't explicitly flagged with an error tag, for example, an HTTP 403 on a server span. This keeps client-side conditions from reading as critical server errors, while spans that do carry an error tag keep their existing red or yellow badges. The Errors toggle is unchanged: it still matches only spans flagged with error: true. Learn more
Templates in DataPrime mode and across all log datasets
DataPrime mode. Log templates, previously available only in Builder, now work in DataPrime mode too. Learn more
Every log dataset. Template generation runs across all your log datasets, predefined and custom, not just specific sources. Learn more
DataPrime-aware filtering, In DataPrime mode, the Templates view respects your query. Filter down to a specific source and see only the templates that match what you're investigating. Learn more
Visualize a field from a template. Chart a field's distribution or a value's trend for a specific pattern, straight from the templates grid. Learn more
Legacy Explore is scheduled for removal in December 2026

Legacy Explore (V1) will be removed in December 2026, move your saved links and day-to-day workflows to the new Explore before then. Selecting Try it now in Legacy Explore carries your query and fields straight across, and saved legacy links open in the new experience intact. The option to set Legacy Explore as your default view is being retired ahead of the removal date. Learn more
Templates: more row actions, column reorder, and Olly context
Copy template ID. Every template row's more actions menu adds Copy template ID, which copies the pattern's ID to the clipboard so you can reuse it as a filter in other queries. Learn more
Add to Olly context. Hover a template row, or open the Template details panel, and select Add to Olly context to pin the pattern to an Olly chat as data context. Learn more
Reorder columns. Drag a column header in the templates grid to arrange the columns in the order that suits your investigation. Learn more
General templates. The row that aggregates unclassified logs now appears labeled General templates in the Template column, so it's easy to spot. Learn more
Reordering Explore tabs works on the first drag
Dragging a tab to reorder it in Explore now works on the first attempt, including right after you add or remove a tab. Previously, the first drag after the set of open tabs changed could snap the tab back without reordering, and a second drag was needed. Learn more
AI Query Assistance in Explore is now generally available
AI Query Assistance (describe what you're looking for in plain language and Olly writes the DataPrime query for you) is now available to all customers, no early access required. Learn more
Filter on part of a value in Explore
Select a whole field value and use Filter by for an exact match, or select just part of it and use Add to filter to search for that substring wherever it appears, no need to hand-write wildcard or contains syntax. It works in the results grid and the log details panel, in both Builder and DataPrime. Learn more
Version Benchmark tags on the Explore chart
The time-series chart above the results grid now marks your Version Benchmark tags on the time axis. Select a marker to open that tag's benchmark comparison against the preceding tag in a new tab, so you can line up a change in your data with the version or event that preceded it. Learn more
See up to 1,000 traces in the Traces tab
The Traces tab of Explore spans now lists up to 1,000 traces for your query and time range, up from 50, so you can compare far more traces across broad time ranges and high-traffic services without narrowing first. Learn more
Fields panel value counts
The Fields panel now uses smarter counting logic: zero-count values are hidden after filtering, a field's own active filters no longer skew its own counts, and actively selected or excluded values stay visible even when other filters drive their count to zero. Value order stays fixed during an investigation and only resets on a new query or time range change. Learn more
Legacy Explore carries your context into new Explore
Clicking Try it now from Legacy Explore now carries your entire context (query and fields) straight into the new Explore. No rebuilding, no lost work. Saved legacy links open instantly in the new experience, fully intact. Learn more
Visual Explorer save-as-dashboard naming dialog
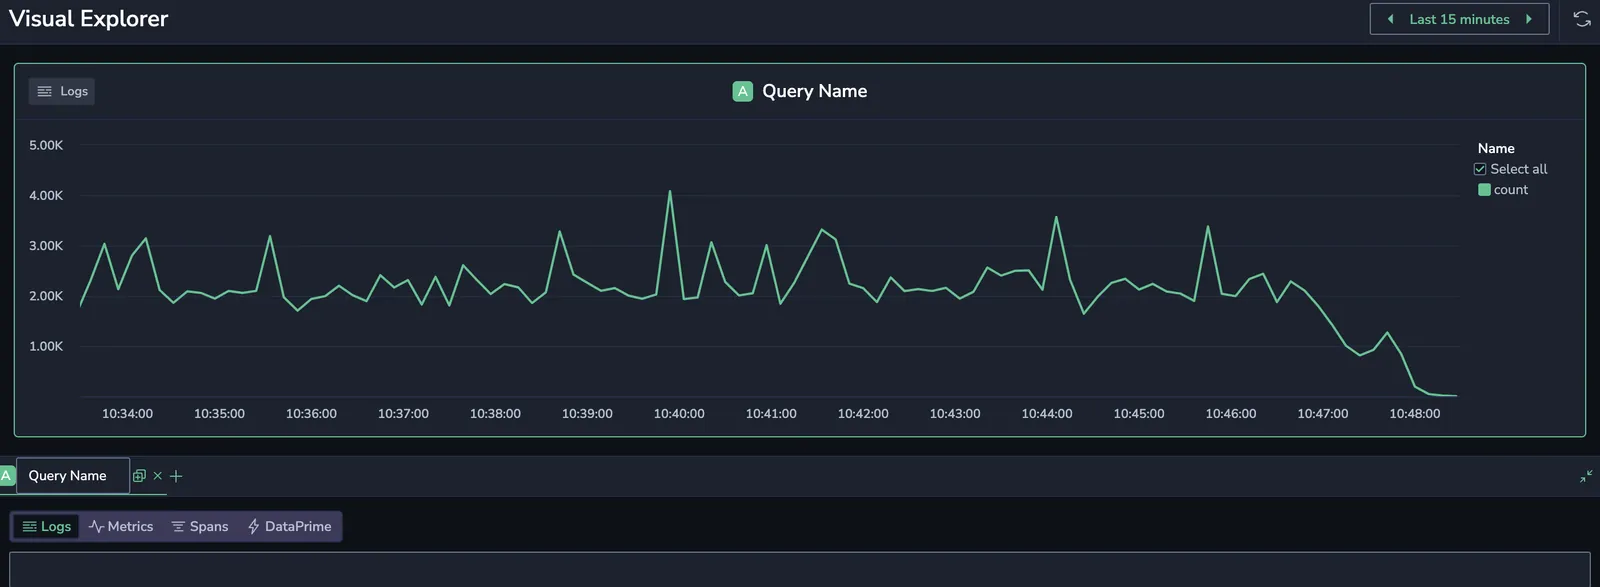
Save as dashboard dialog: When saving a Visual Explorer chart as a dashboard, a dialog now prompts you to name the dashboard before it is created. Enter a name and select Save. The new dashboard opens in a separate browser tab. Learn more
Templates: see raw logs and inspect unclassified patterns
See raw logs. Every template row's more actions menu adds See raw logs, which switches to the Logs tab filtered to the entries behind the pattern. Learn more
Unclassified log details. Selecting an unclassified template, or the row that groups them, opens the Template details panel in a Failed classification state that explains why the logs could not be grouped into a template. Learn more
Generate DataPrime queries with Olly
In DataPrime mode, describe what you're looking for in plain language and Olly writes the query for you, for whichever dataset you've selected in Explore, not only logs. When your request implies a time range, Olly sets the time picker to that window when you run the query. Learn more
Filter by field presence in the Builder

The query Builder adds Exists and Not exists operators, so you can filter on whether a field is present at all without typing a query. Select either operator on a chip and the value input disappears. The chip is complete with just a field and an operator. Learn more
Filter field values with checkboxes and Only
In the Fields panel, each value row now has a checkbox that shows and sets whether the value is included or excluded, keeping the panel and the query bar in sync. A new Only action narrows a field to a single value in one step, clearing the field's other selections. Learn more
Stack series on the time-series chart
The time-series chart's graph configuration adds a Stacked option for vertical bar and area charts. Choose Absolute to stack real values, or Relative to compare each group's share of the total per bucket. Learn more
Built-in DataPrime cheat sheet
Look up DataPrime syntax without leaving the query editor. In DataPrime mode, open the cheat sheet from the query bar to browse the reference by section, search it, and copy examples straight into your query. Learn more
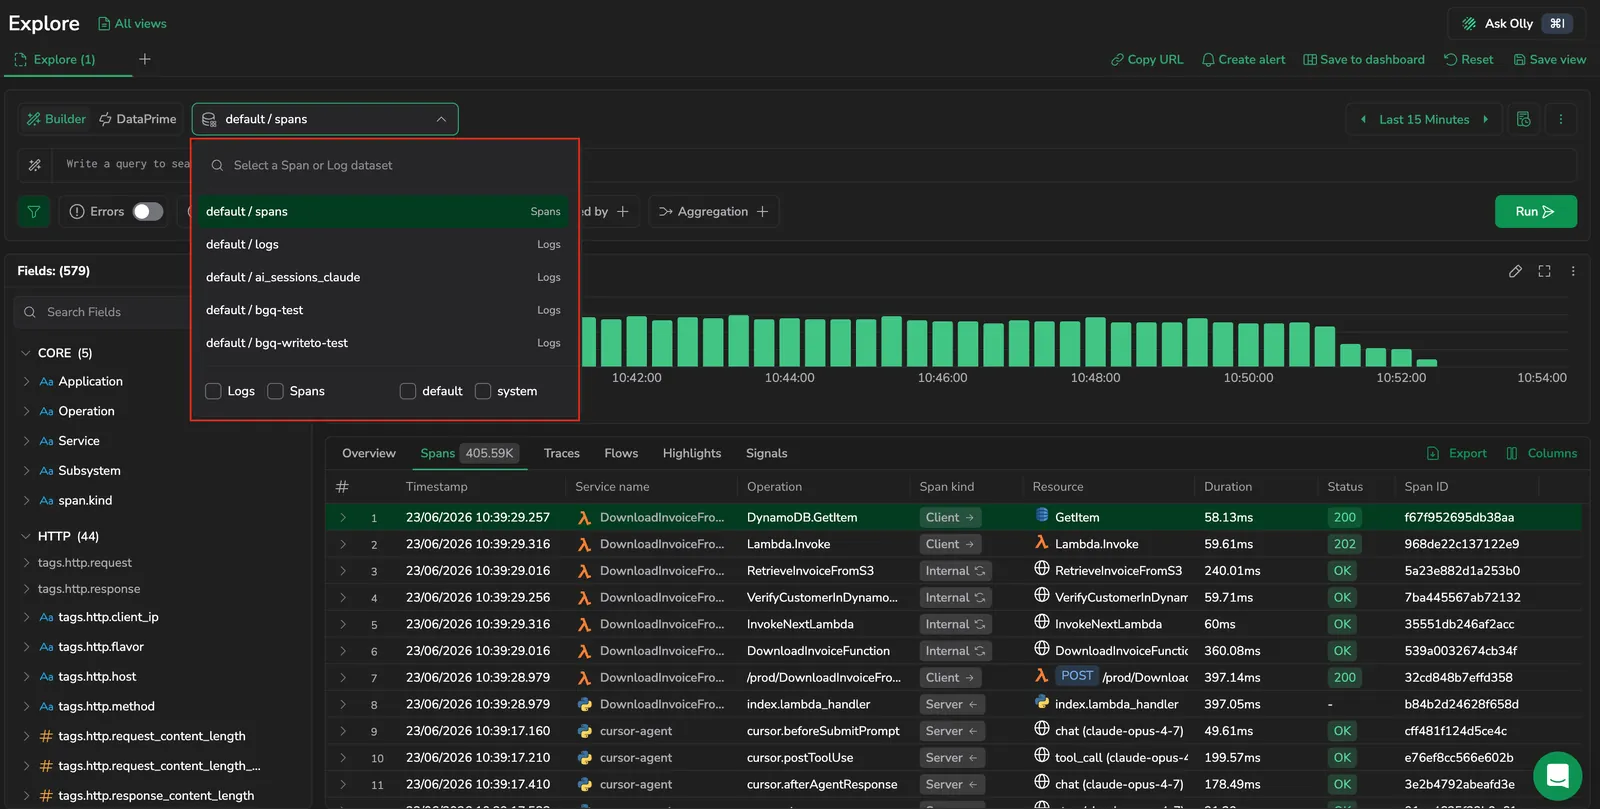
Frequent Search dataset: Select Frequent Search as a dataset directly in the dataset selector when querying Logs or Spans, alongside your default datasets. Learn more
DataPrime chart visualizations: DataPrime query results can now be rendered as charts, expanding visualization options beyond the table view.
Fields by OTel section: The Fields panel groups fields by OpenTelemetry semantic convention section, making it easier to navigate fields that follow OTel naming conventions.
Readable, shareable URLs in Explore
Human-readable URLs. Explore deep links now use plain query parameters like ?query=…&dataset=…&duration=… that you can read, hand-edit, or build from scratch. Learn more
Relative time persists. Refreshing a "Last 1 hour" view stays on "Last 1 hour" instead of freezing to a fixed window. Learn more
Backward compatible. Legacy URLs and aliases (relativeTime, preset, appendFilter, /explore/logs) are upgraded to the canonical form on load. Learn more
Saved views: Save as, tab updates, and Duplicate
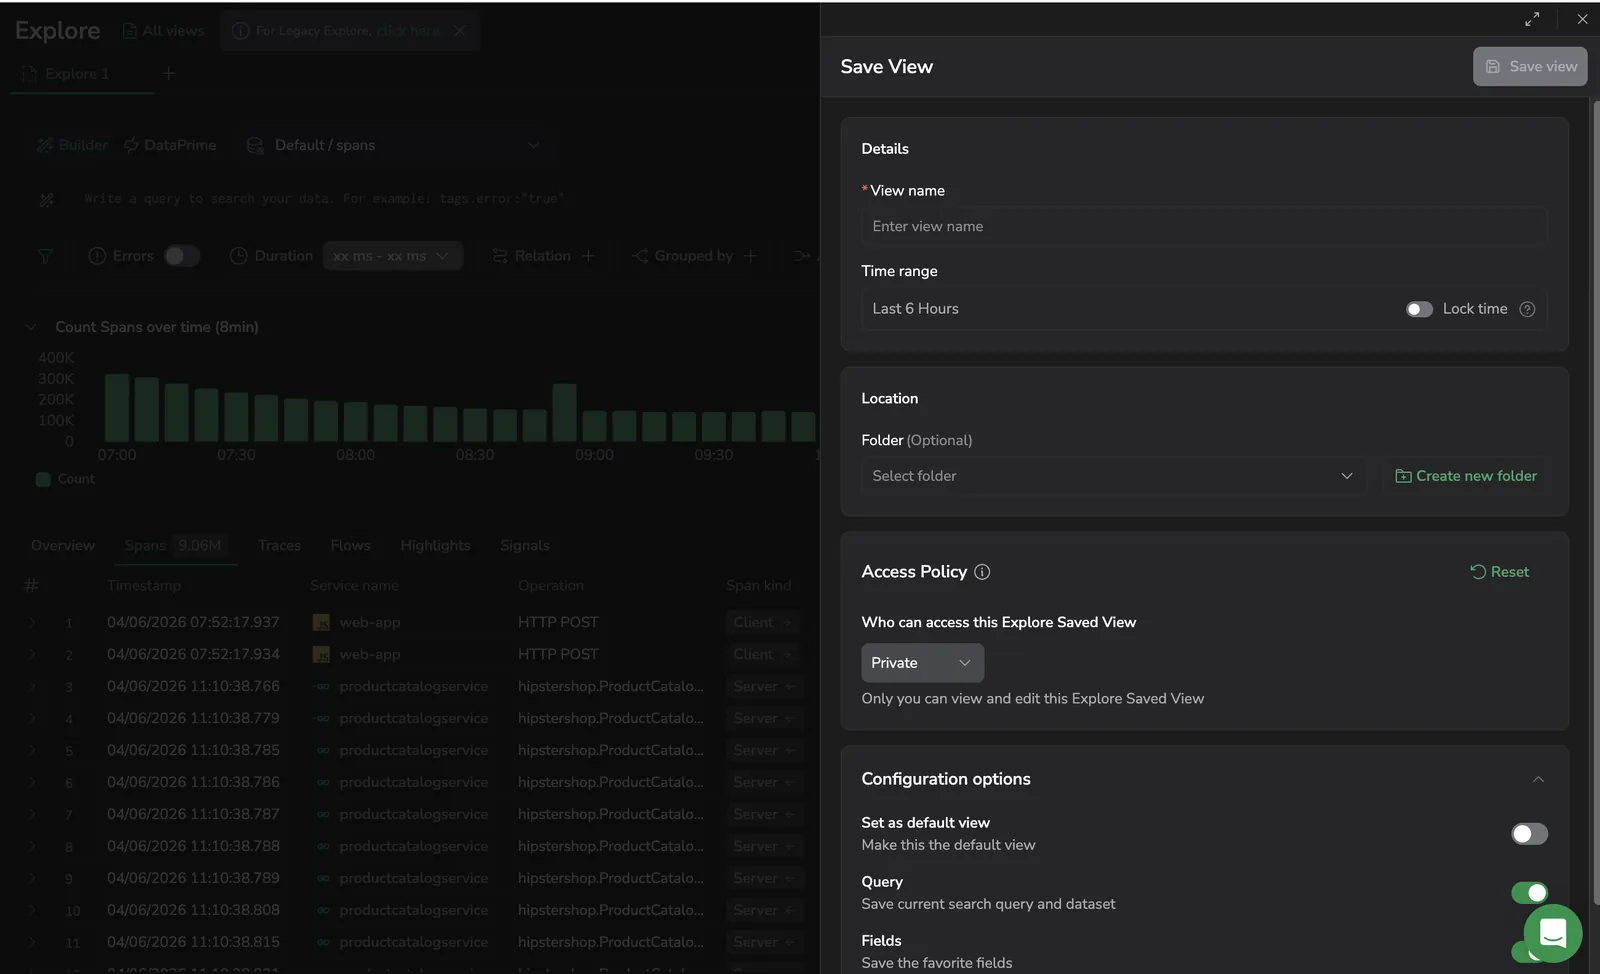
Save as a separate view. Open the tab's menu and select Save as to save your current state without overwriting the loaded view. Learn more
Tab labels. Ad-hoc query tabs are now numbered Explore (1), Explore (2), and so on, until you save them. Learn more
Duplicate a tab. Open the tab's menu and select Duplicate to work on a copy of the tab without affecting the saved view. The clone is suffixed (copy) and unlinked from the source view. Learn more
Export updates: more surfaces, file-name validation, entity-aware copy
Export from any grid. Export is now available on the Traces, Templates, and Overview tabs, alongside Logs and Spans. The three added surfaces export the rows currently loaded client-side; Logs and Spans export server-side up to 10,000 rows. Learn more
Export aggregated and grouped results. The Overview tab renders aggregated and grouped results from both Builder and DataPrime modes and supports export. Builder mode exports as CSV or TSV; DataPrime mode also supports JSON. Learn more
Entity-aware copy on the Spans tab. The Export dialog and toasts use span-specific wording on the Spans tab (Span count, Exporting spans..., Spans exported successfully). Learn more
File-name validation. File names accept letters, numbers, and ., _, or - only, up to 255 characters. Invalid characters show an inline error and the Export button stays inactive. Learn more
Overview tab for spans
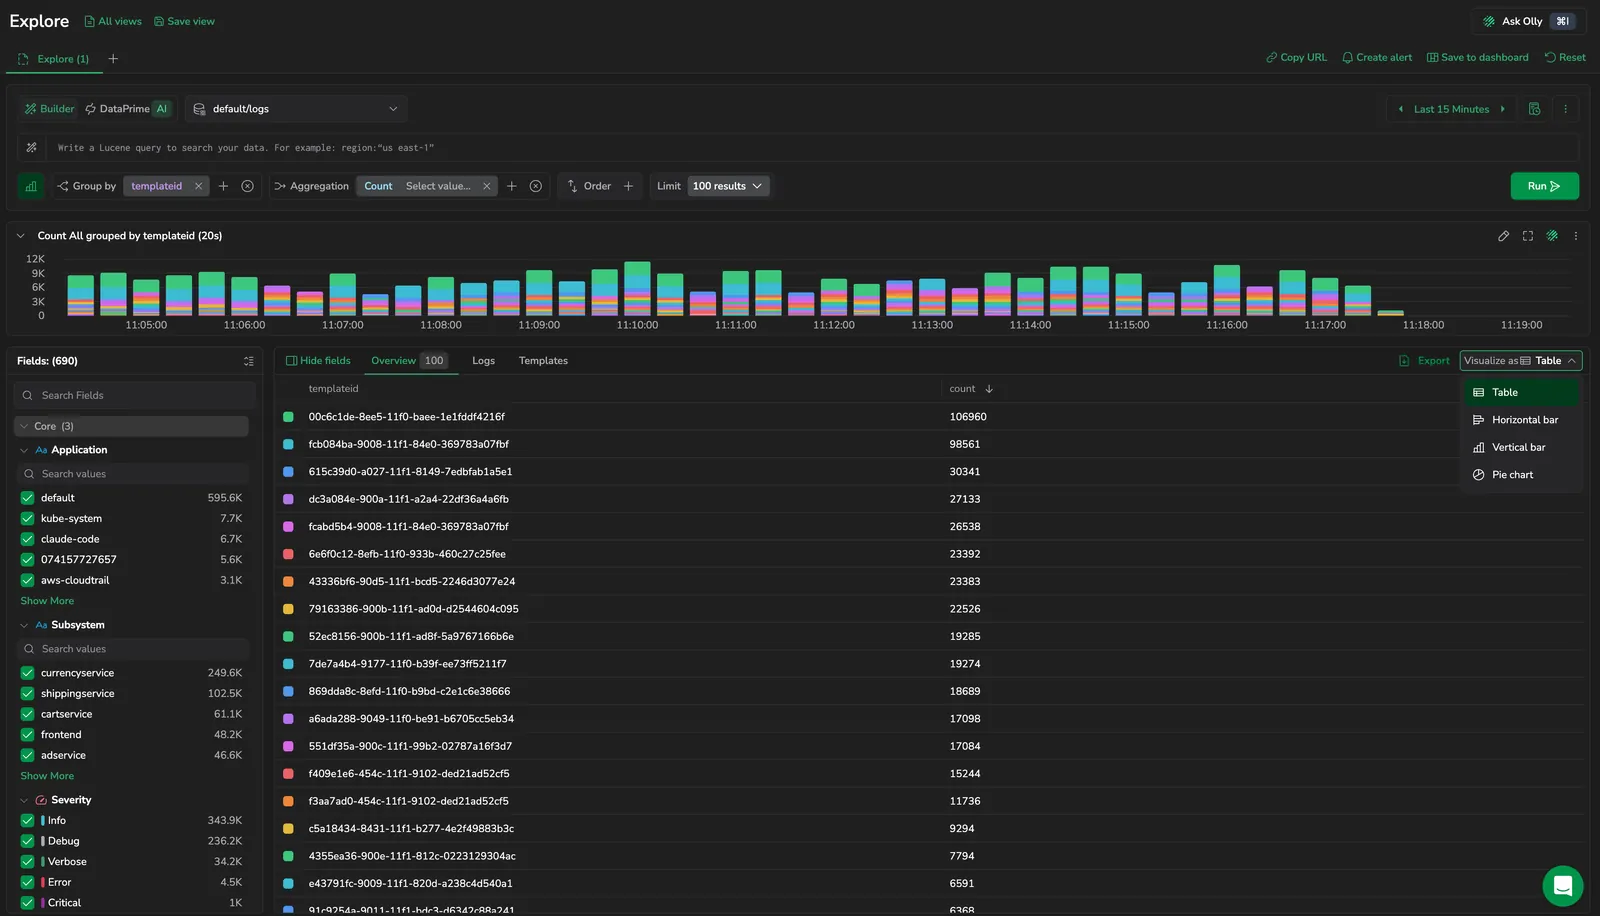
A new Overview tab on the spans dataset renders aggregated span queries as sortable tables or charts. Rank services by error count, surface the slowest operations, or see status-code distributions at a glance. Learn more
Highlights tab in Explore spans

Break the spans matching your query down by field in a dedicated Highlights tab. Switch between Duration, Errors, and Total Requests views, and toggle Compare to previous period to surface regressions side by side, a Diff column ranks fields by how much each value changed between the two windows. Learn more
Signals tab for spans
A new Signals tab on the spans dataset surfaces Rate, Errors, and Duration for the active query. A button group at the top of the tab switches between Outliers (latency percentiles, error counts, and individual span samples overlaid on a single chart) and RED metrics, Rate, Errors, and Duration as three side-by-side charts. Each chart has its own configuration, and selecting any data point opens the tracing drilldown on the most representative span for the active aggregation. Learn more
Custom actions in Explore
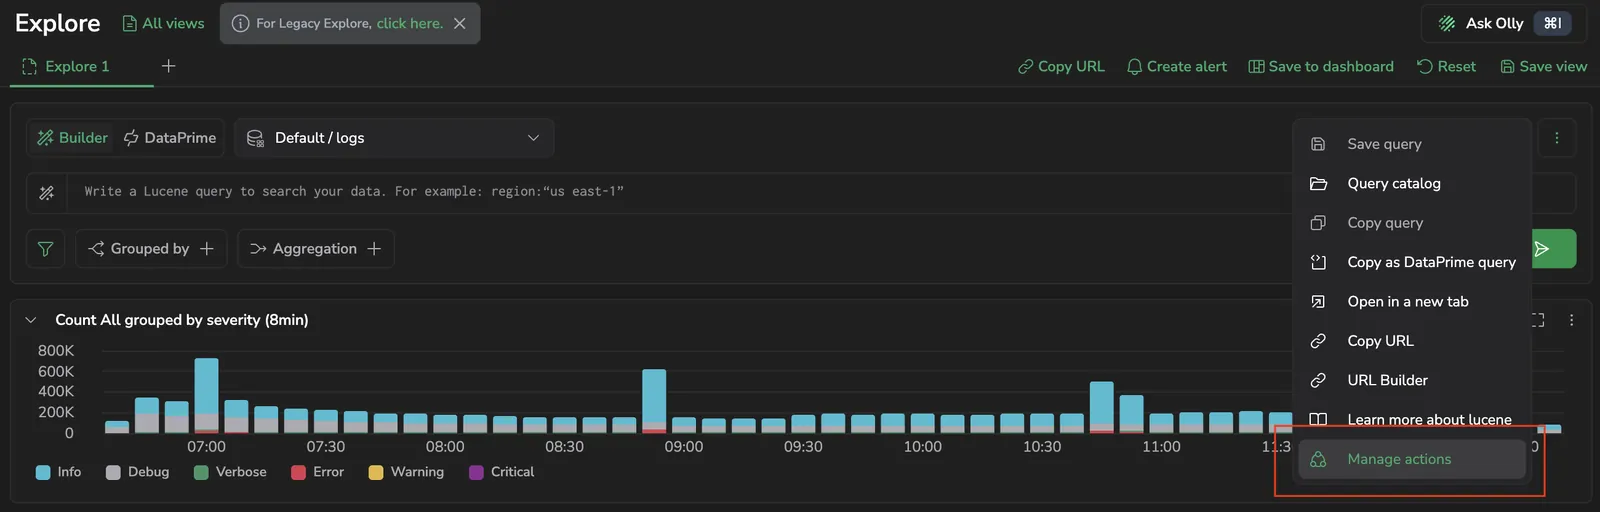
Manage actions panel. Open the kebab menu in the Explore query bar and select Manage actions to create, edit, and organize custom actions in Private and Shared sections. Learn more
URL templates with $d, $m, $p. Build clickable jumps from a log to a trace, span, RUM session, Grafana board, or Jira ticket using placeholders for log fields, Coralogix metadata, and page context. JavaScript expressions and bracket notation for special-character field names are supported. Learn more
Filters and access controls. Scope actions by application, subsystem, or data type, and choose Private or Shared access when saving. Learn more
Export log data as JSON
JSON export. Download Explore V2 query results as JSON, alongside the existing CSV and TSV formats. Use JSON when you need to feed downstream tooling or preserve the nested structure of fields exported under All logs. Learn more
Span-relationship filters in the query builder

A new Relation option in the Spans query builder lets you find spans based on their position within a trace. Choose from seven relation types (Root, Only root, Parent, Entry service, Child, Any, and Not any) and combine multiple filters with AND or OR. The builder generates the matching DataPrime relational query automatically, so you can switch to DataPrime at any time to inspect or refine the query. Learn more
Explore spans: three-tab investigation experience
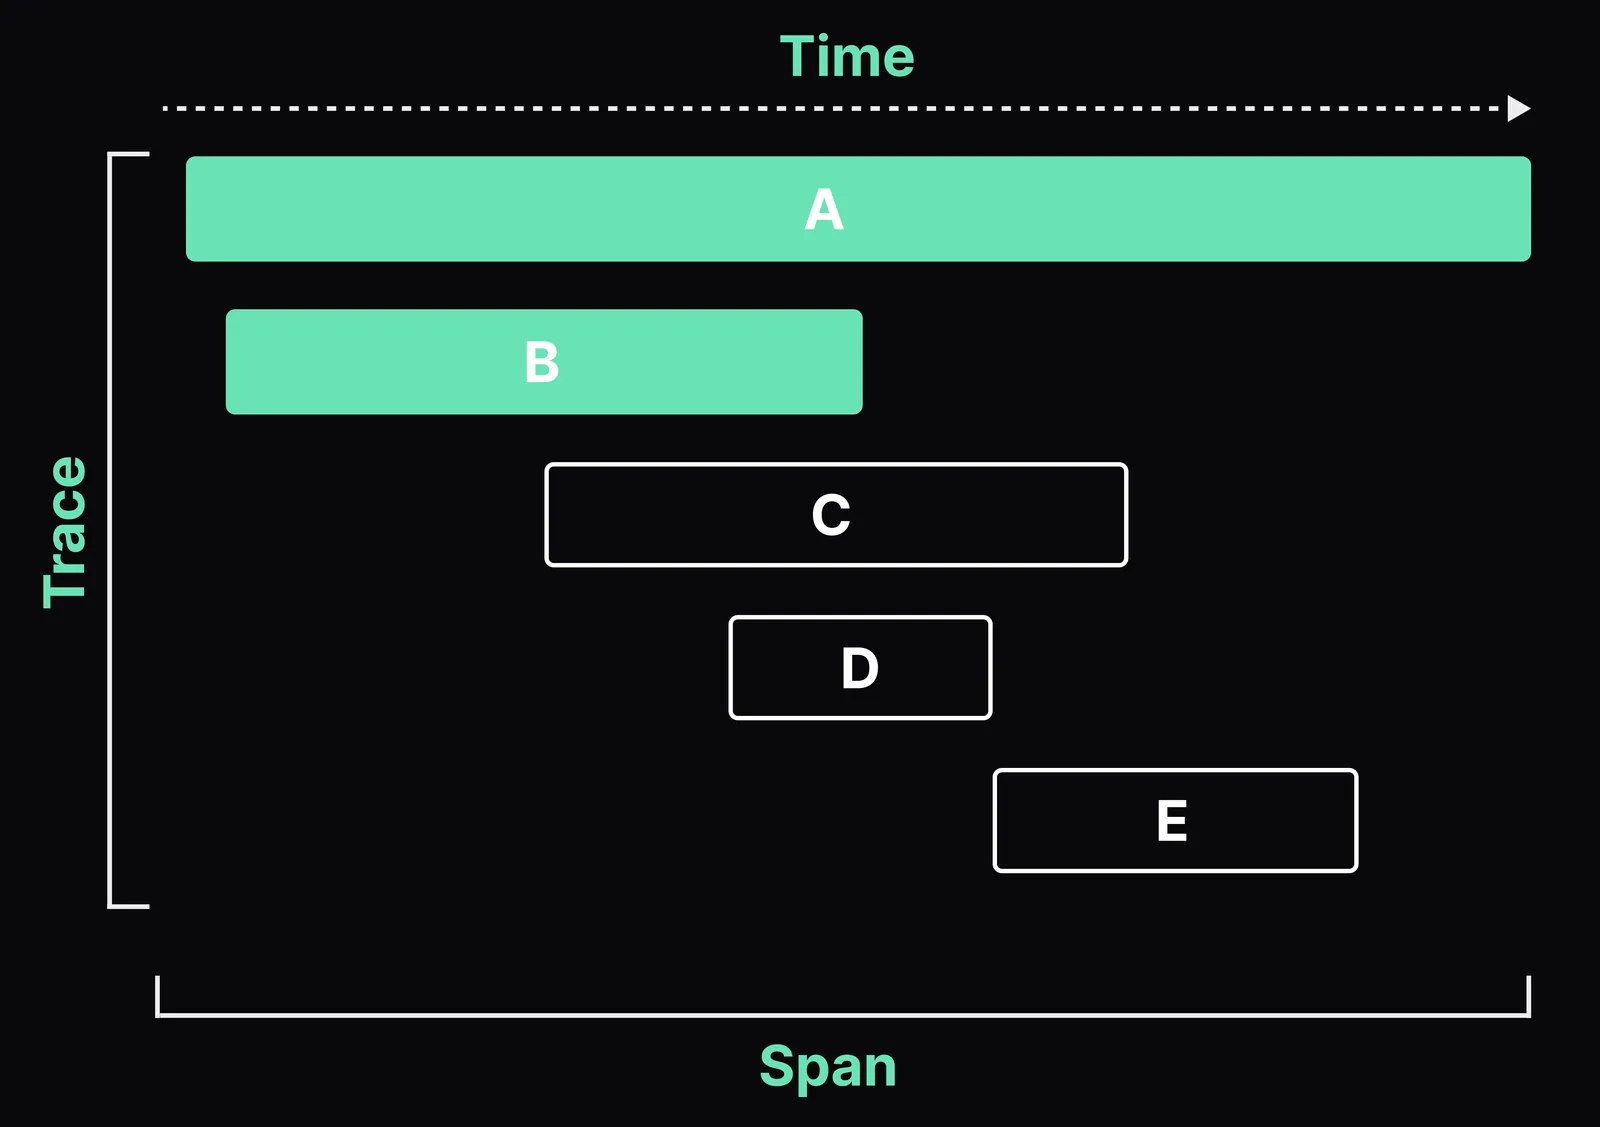
Renamed to Explore spans. Explore Tracing is now Explore spans, reflecting a span-first investigation flow. Learn more
Three tabs, one investigation. Spans, Traces, and Flows share the same query, time range, and filters. Switch tabs as your question changes, from operation-level (Spans) to request-level (Traces) to topology (Flows). Learn more
Span kind column. The Spans tab surfaces the OpenTelemetry span kind (SERVER, CLIENT, PRODUCER, CONSUMER, INTERNAL) with a directional arrow next to each row. Filter by kind to focus on inbound or outbound activity. Learn more
Span-aware query builder. The query builder gains an Errors toggle, a Duration filter (in ms or percentile), and span-relationship filters (Root, Only root, Parent, Entry service, Child, Any, Not any). Toggling Errors or applying a Duration filter runs the query automatically. Learn more
Redesigned Explore Logs experience
New Explore Logs. The Explore Logs experience has been fully redesigned. Navigate logs and spans from a unified interface with improved search, a rebuilt query builder, an enhanced logs table, and a detailed info panel. All legacy Explore Screen and Logs Screen pages redirect to the new experience. Learn more
Select a Data Source. Choose between dataspaces, datasets, and system datasets from a new data source selector at the top of Explore. Learn more
Get Started with Explore Logs. A new quickstart guide walks you through search, filtering, visualization, and saving views in a few steps. Learn more
Query Builder and redesigned Logs Table
Query Builder. Group by fields and apply aggregation functions to analyze log data without writing queries. Drilldown into grouped results to explore the underlying logs. Learn more
Logs Table. Configure the content column, manage column visibility and order, set row format, export data to CSV, and interact with field values directly from table cells. Learn more
Log Details Panel. Inspect individual log entries with correlated observability data including related logs, traces, and resource metrics. Use Explain Log for AI-powered log analysis. Learn more
Filter with Fields. Use the Fields panel to filter logs by any indexed field. View field statistics, top values, and field distribution directly in the panel. Learn more
Visualize Log Data. Switch between chart types to visualize query results. Configure chart settings, interact with data points, and build DataPrime-powered visualizations. Learn more
Analyze Log Patterns with Loggregation. Group logs into templates to identify patterns, reduce noise, and surface anomalies across large log volumes. Learn more
Tabs, Views, and Queries. Manage multiple parallel investigations using tabs. Save views and queries for reuse, and access query history from the query catalog. Learn more
LiveTail. Stream live log data in real time with filtering, highlighting, and pause controls. Now available under Explore Logs. Learn more