Metrics
Events2Metrics permutation limits documented correctly
The Events2Metrics documentation said metric rules are blocked when a per-rule or organization quota is reached, whichever comes first. That is not what happens. Reaching a rule's permutation limit does not stop the rule and does not drop data: every label value on a further combination is replaced with CoralogixOtherValues and the combinations are aggregated into a single overflow series, whose counts and sums stay correct in total. The 10M organization figure is a separate thing again, a budget for the limits you configure across all rules, checked when a rule is created or edited rather than during ingestion. The pages now also cover how slots are allocated, that counting restarts at 00:00 UTC with the previous day staying open until 02:00 UTC for late data, and how to query CoralogixOtherValues to detect a rule that has passed its limit. Learn more
Cardinality figures in Metric Data are documented as estimates
The Cardinality, Series, and Unique Values columns in Metric Data are estimates with an error margin of about 1%, which the product states in each column tooltip but the documentation did not. The pages now say so, explain that the margin is fine for ranking metrics and spotting growth but too loose to reconcile against a billing figure, and point to the Explore tab, which scans the full series set for the selected hour when you need an exact count. Learn more
Alert on your cardinality, not just look at it
Coralogix can now report your cardinality as metrics in your own account, so you can chart it, compare it across a deploy, and alert before a fair usage limit bites. Turn on cx_unique_series_daily_per_metric to see which metric name is driving an increase, or cx_unique_series_daily_per_service to attribute growth to the team that owns it. Both live under Metric Data visibility in the Metric Data settings panel, and both are chargeable while enabled. Learn more
Control the step a metric query runs at
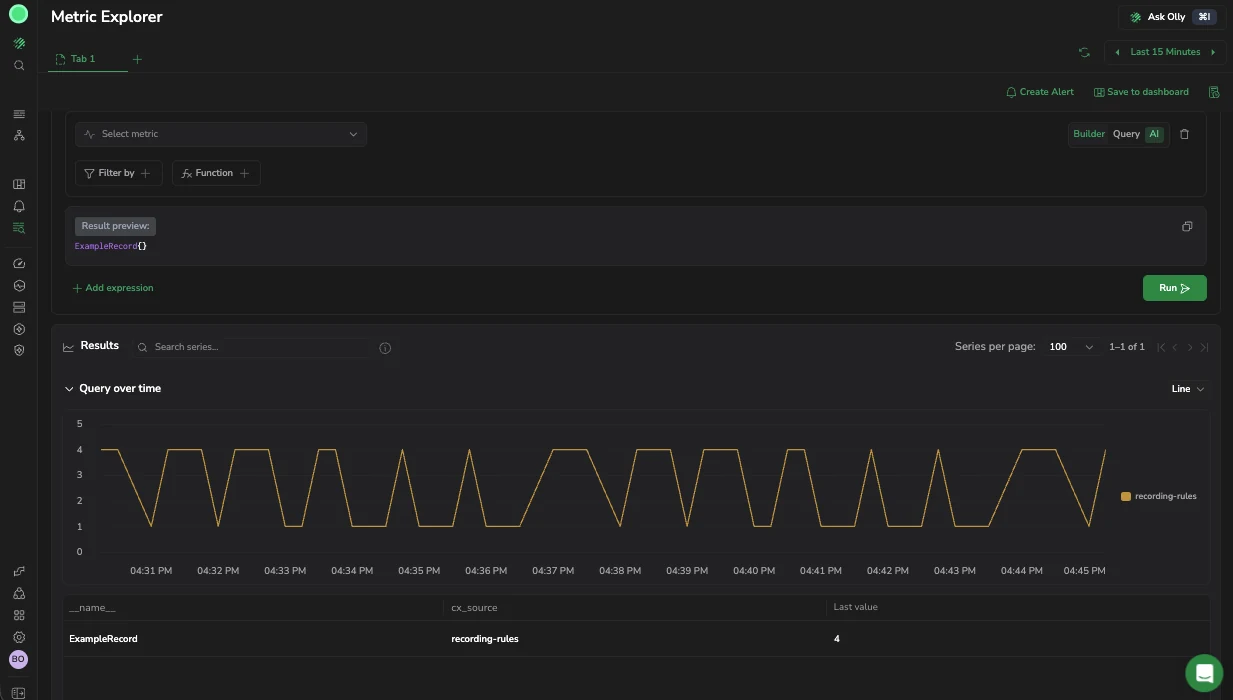
Metric Explorer now carries a Time interval control beside Run. Leave it on Auto (recommended) and the step follows the time range and the width of the chart, with the Effective interval shown so you know what you got. Switch to Manual to cap Max data points or set a Min interval, which keeps a comparison on the same step from run to run and stops an automatic step blurring a metric that arrives at a known frequency. Learn more
Six chart types in Metric Explorer
Metric Explorer results are no longer limited to a line. Switch the chart type to Line, Area, Stacked area, Scatter, Bar, or Pie so the visualization fits the question you are asking: stacked area for parts of a whole over time, such as CPU by pod adding up to cluster usage, or pie for a single point-in-time comparison rather than a trend. The table and the chart stay linked, so hovering a row still highlights its series. Learn more
Built-in PromQL variables and step control in Metric Explorer
Range queries now take a step, and a query can use the built-in PromQL variables ${__range}, ${__interval}, and ${__rate_interval}, together with their _s and _ms variants. The variables resolve from the time picker and the step you set, with the same semantics they carry in Custom Dashboards, so a query written in Metric Explorer moves to a dashboard widget, and back, without being rewritten.
Query history, result paging, and a remembered query mode in Metric Explorer
Repeat investigations now pick up where you left off. Query history in the header lists the queries you have already run and loads any of them back into the current tab; history is kept in your browser, so it survives a new session. The results table pages through large result sets, Search series covers every series the last run returned rather than only the rows on the page in view, and Results per series sets how many rows a page holds. Run query stays available after a run, so the same control refreshes the results. Your choice of Builder or Query mode is remembered as a preference, and new tabs open in the mode you used last. Learn more
Query tabs in Metric Explorer
Metric Explorer holds up to 5 query tabs, each with its own query, time range, and results, so several investigations can stay open instead of overwriting the one you started with. Rename a tab to say what it tracks, duplicate one to try a variation without losing the original, and close the ones you are finished with. Tabs last for the browser session, and the page URL tracks the active tab, so a copied link shares the query you are looking at rather than every tab you have open. Learn more
Several queries per tab in Metric Explorer, with aliases and instant results
A Metric Explorer tab can now hold several queries that run together and plot on one chart, so comparing two metrics no longer means comparing two tabs. Each query takes its own color, can be hidden without being deleted, and reports its own errors rather than taking the run down with it. Name the series yourself with a query alias, a template such as {{pod}} resolves per series, and a token for a label the series lacks stays visible so you can see what is missing. New Range and Instant modes decide whether a run returns a trend or a single value per series, with the chart following the shape of the response. Learn more
Adaptive rules: optimize metrics based on usage
Adaptive rules automatically route each metric to the right tier based on how it's used, so you cut cost without losing fidelity or access. Series nobody queries move to a cheaper tier and return in full the moment you read them; block the ones you don't need. Available in early access. Learn more
Generate PromQL queries with Olly
In Metric Explorer's Query mode, describe what you're looking for in plain language and Olly writes the PromQL query for you. Review and adjust the generated query, then run it. Learn more
Faster, more controllable querying in Metric Explorer
Metric Explorer query enhancements, based on customer feedback. Run queries on demand with the new Run query button (or Cmd+Enter / Ctrl+Enter) instead of automatic runs, get actionable error messages that tell you the real reason and a path forward (for example, a series limit reached message), filter values in or out by hovering the results table, group by any column with sum, max, min, count, or average without writing PromQL, expand grouped rows with the drilldown icon, and switch the metric while keeping your filters and group-by. Learn more
Metric usage analysis shows bytes and CX units
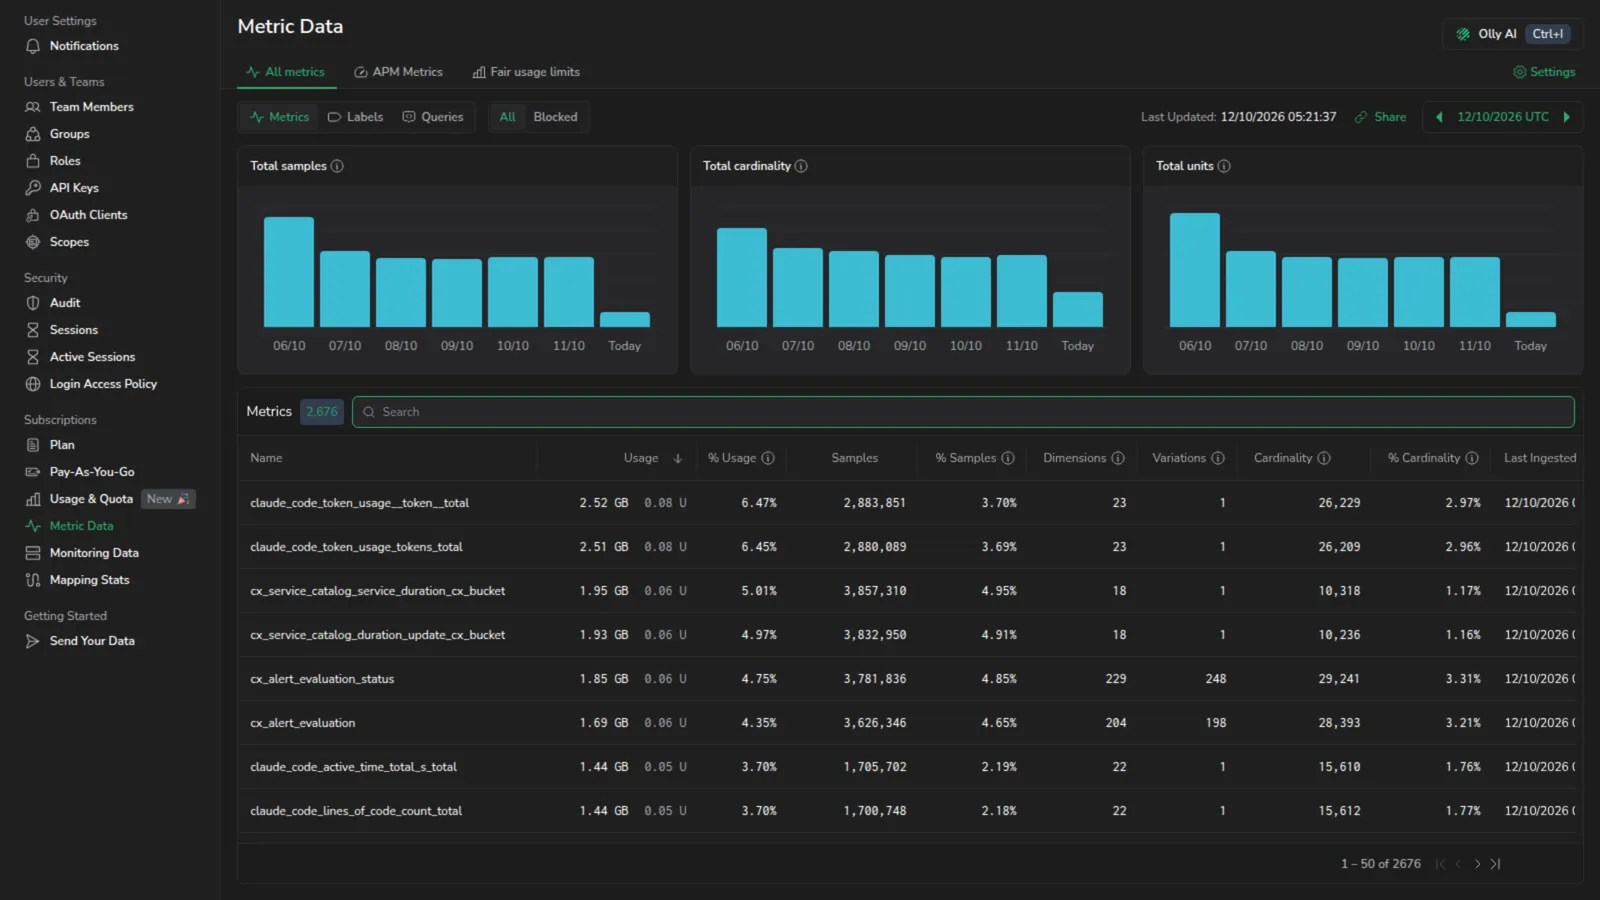
Usage values across Metric usage analysis now appear as bytes alongside CX units. The top stats row of each drilldown shows Cardinality, Usage (bytes + CX units), and Samples so you can reason about raw data volume and billing impact from the same view. Learn more
Metric Explorer and Browse Labels and Values
Metric Explorer (Query any Prometheus-compatible metric, visualize results as time series charts, and drill down by label dimensions from a dedicated workspace) without setting up a dashboard first. Use the no-code Builder or write PromQL directly, combine expressions, and identify which label values drive anomalies. Learn more
Browse Metric Labels and Values. The original Metric Explorer has been renamed to Browse Metric Labels and Values. Browse metrics, labels, and label values without writing PromQL, and generate a starting query to use in Metric Explorer or Custom Dashboards. Learn more
New top-level Metrics section. Metrics documentation previously scattered across Account Management, Data Transformation, and Monitoring is now consolidated into a dedicated Metrics section in the navigation for easier discovery.
Metric Usage Analyzer subtopics. Variations, Labels, and Explore Tab are now standalone pages nested under Metric Usage Analysis, making each topic easier to find and navigate.
Explore Tab. Identify which label values contribute most to a metric's cardinality. Includes documentation for the 1-hour time window constraint, advantage over PromQL series scan limits, and use cases for identifying cardinality by region, cluster, and service. Learn more
Live Error Logs. Surface real-time error logs for failed query executions directly from the Query Pattern drilldown. Learn more