Product Analytics
Minimum Browser SDK version raised to 4.2.0
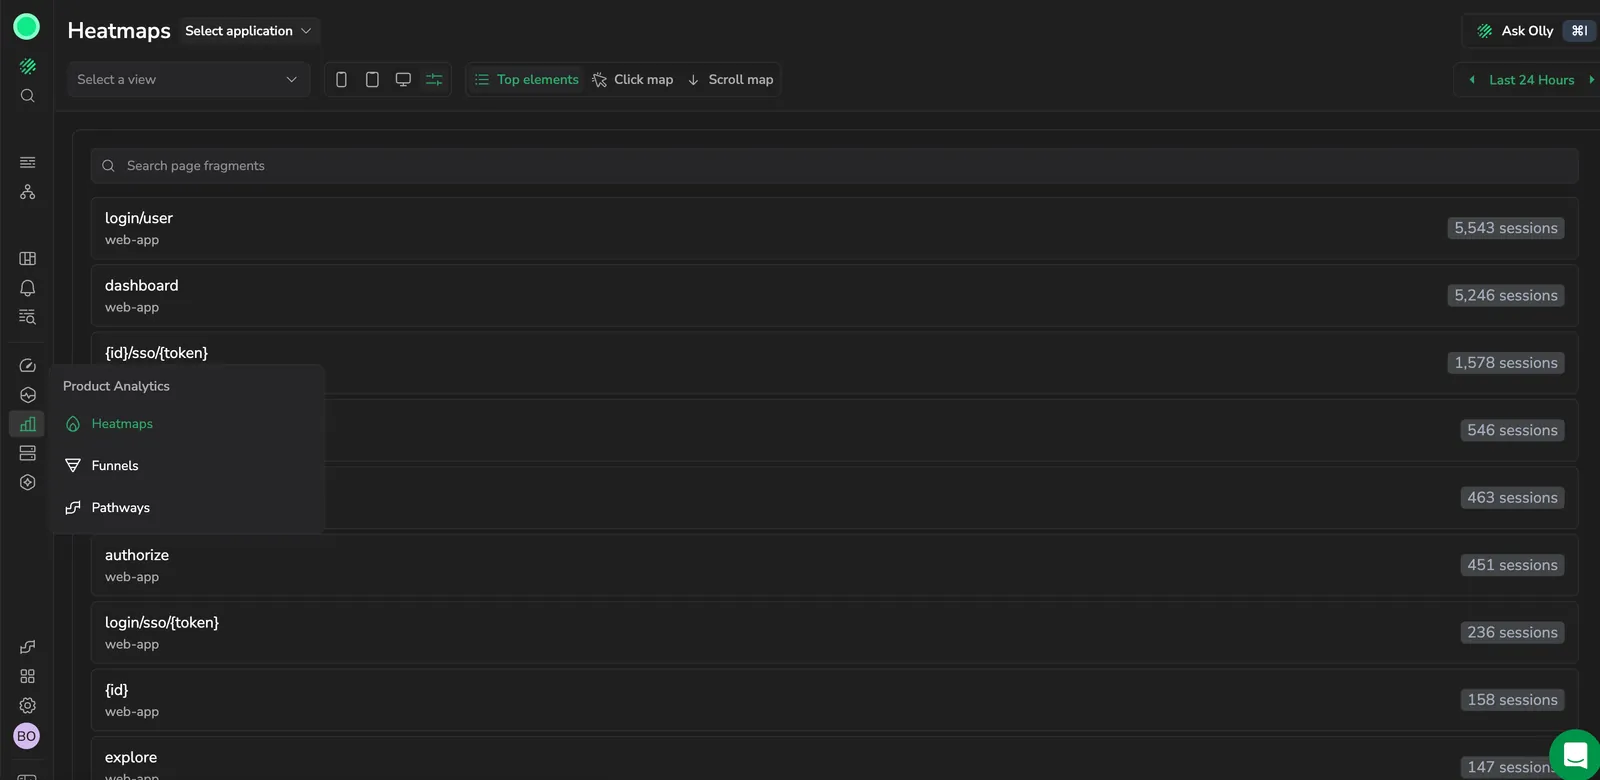
Product Analytics now requires the Browser Real User Monitoring SDK version 4.2.0 or later, raised from 3.24.0 for the public beta launch. An application on an older SDK version sees the Product Analytics zero state until it upgrades. Learn more
Ask Olly on Overview
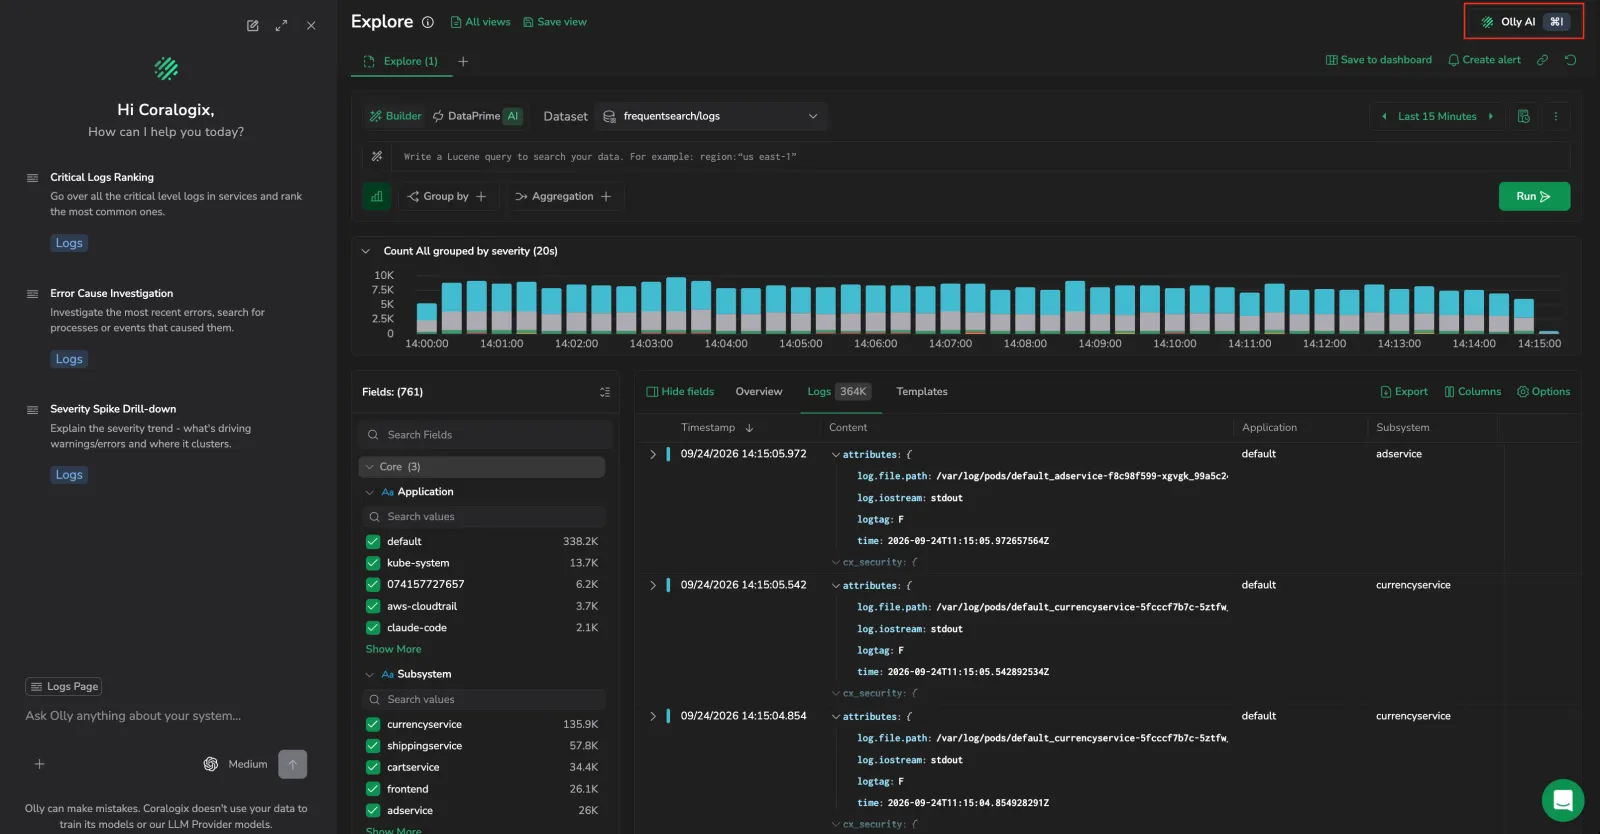
The Olly AI button in the page header now works on the Product Analytics Overview. Opening it scopes Olly to what you're viewing, the selected application, view, and time range, so you can ask about shifts in users, sessions, or page views without describing your view first. Learn more
Overview: a new landing page for Product Analytics

Overview is now the first item in Product Analytics and the view you land on by default. It leads with unique users, sessions, and page views for a view or your whole application, compared to the previous period, then breaks them down by account, country, OS, or platform, and by user. Select a group to filter in or out, or to open a heatmap or a funnel seeded from it. Learn more
Application selector now scoped to the last 7 days
The application selector across Product Analytics now lists apps with RUM traffic in the last 7 days, narrowed from 12 months. An app with no traffic in the past week no longer appears in the selector, and an account whose apps have all been quiet for a week lands on the Product Analytics zero state.
Filter Heatmaps by instrumentation

Top elements and Click map now carry an Auto / Manual instrumentation toggle, matching the one already on Events. Auto, the default, includes every click the SDK captured plus the manually tagged ones; Manual shows only elements tagged with data-cx-action-name. A tagged element's action name now shows in bold ahead of its element name in Top Clickable Actions. Saving a heatmap remembers the selected filter, and loading one restores it. Learn more
View session replay from a heatmap opens at the screenshot's capture moment
View session replay (previously See session replay) on a heatmap screenshot now opens the session's replay at the moment the active screenshot was captured, instead of at the start of the session, and stays disabled until the screenshot and its session have loaded. This also fixes a bug where opening a session's replay from a heatmap could show No Session Replay for a session that did have a recording.
Preview an action's screenshot from Events
Select Preview from a row's actions menu on Events to see the latest screenshot on which the RUM SDK recorded that action, scaled to fit with the element highlighted and scrolled into view, without leaving the grid. Expand the preview into a full dialog, or select See heatmap to deep-link Heatmaps to that exact capture. The Page query param filter on Events also gained a Not exists option, alongside Any value, to keep only sessions whose URL lacks the selected key. Learn more
Events
Events ranks every element users click on a single view as a sortable grid, so you can read the numbers behind a page rather than the picture of it. Pick a view from the Views panel and the grid lists each element with its Clicks, Dead clicks, Rage clicks, and Share of the view's total, above summary cards for Elements clicked, Total clicks, Dead clicks, and Rage clicks and a Top events chart of the ten busiest. Switch Instrumentation to Manual to see only the elements you tagged with data-cx-action-name, narrow to a single URL parameter with Page query param filter, then select a row to see the users behind it or Start a funnel seeded from that element. Learn more
Account column and a shared user list across drilldowns
The user lists in the Heatmaps, Funnels, and Events drilldowns now carry an Account column, and export the account name and ID alongside the user's name, email, and ID when you select Download CSV. The three lists share one layout, so Download CSV is now available from the heatmaps and events drilldowns too, and session replay opens from a play icon at the start of each row, greyed out where no recording exists. The heatmaps drilldown card that read User interacted is now Unique users and leads with the share of the view's users who interacted, for example 12 of 340 unique users. The side panels on Heatmaps, Funnels, and Events can be dragged to resize and collapsed to a rail.
Group a funnel by a session attribute
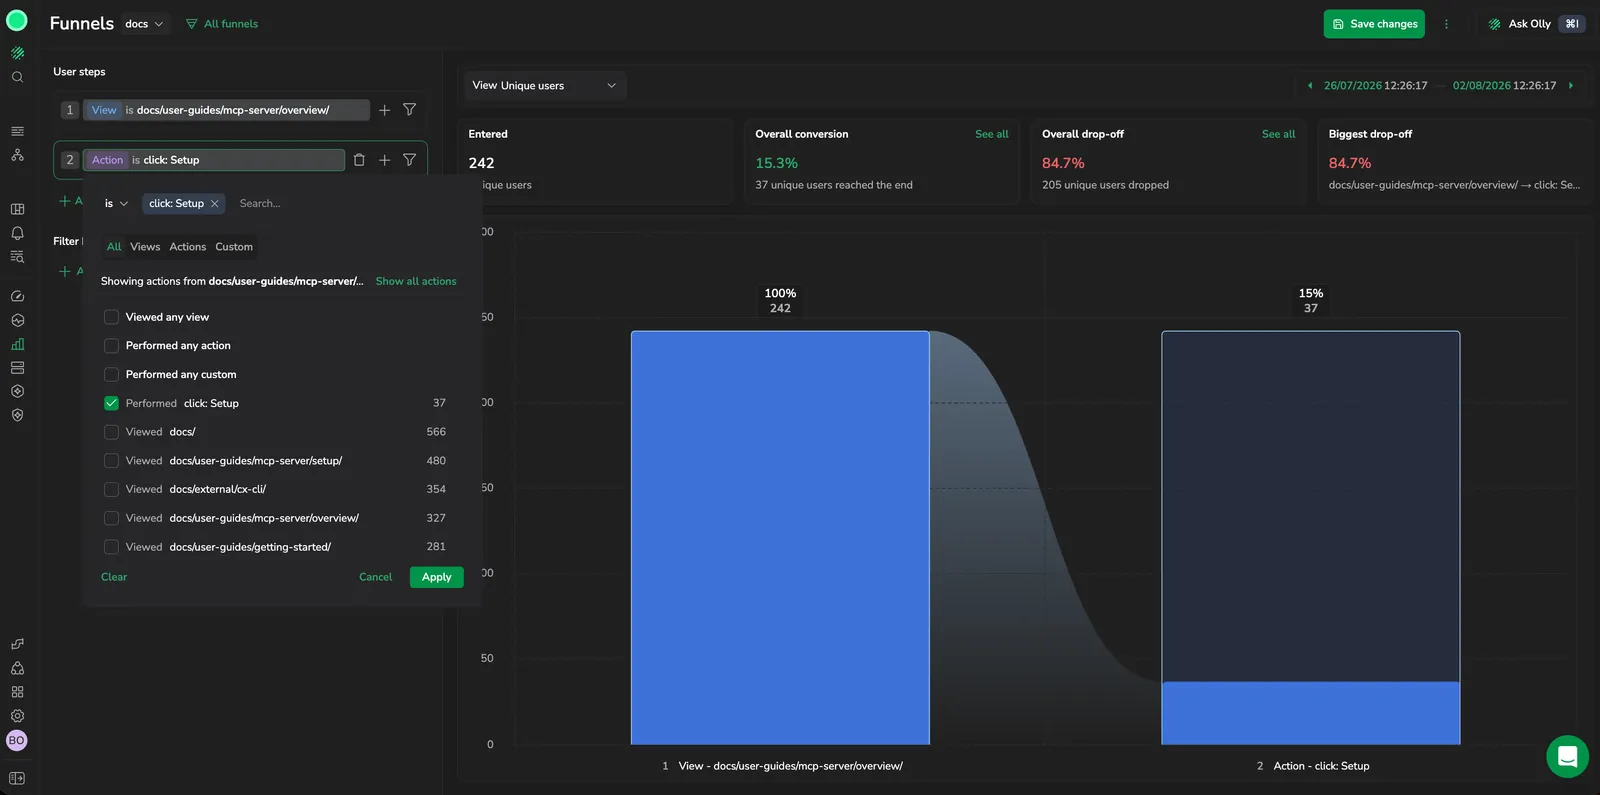
A Funnel can now be broken into one funnel per attribute value, so you can compare conversion across groups instead of reading it only in aggregate. Select Add group by under Group by in the step panel to split the funnel by one of 13 session attributes, including Browser, Country, App version, OS version, and Account name. Set Show top to return the 5, 10, or 20 largest groups, use Stacked to split each step's bar by group or to draw a mini funnel per group, and switch Scale to Logarithmic when a large group flattens the smaller ones. The summary cards become Best converting, Worst converting, and Conversion gap, and drilling into a group scopes the user list to it. Saved funnels keep their grouping. Learn more
Ask Olly on Heatmaps, Funnels, and Pathways
The Olly AI button in the page header now works on the Heatmaps, Funnels, and Pathways screens. Opening it scopes Olly to the analysis you're building, the funnel and its steps, the pathway and its direction, or the heatmap view and mode, so you can ask about drop-off, user journeys, or engagement without describing your view first. Learn more
Coralogix Analytics Tool
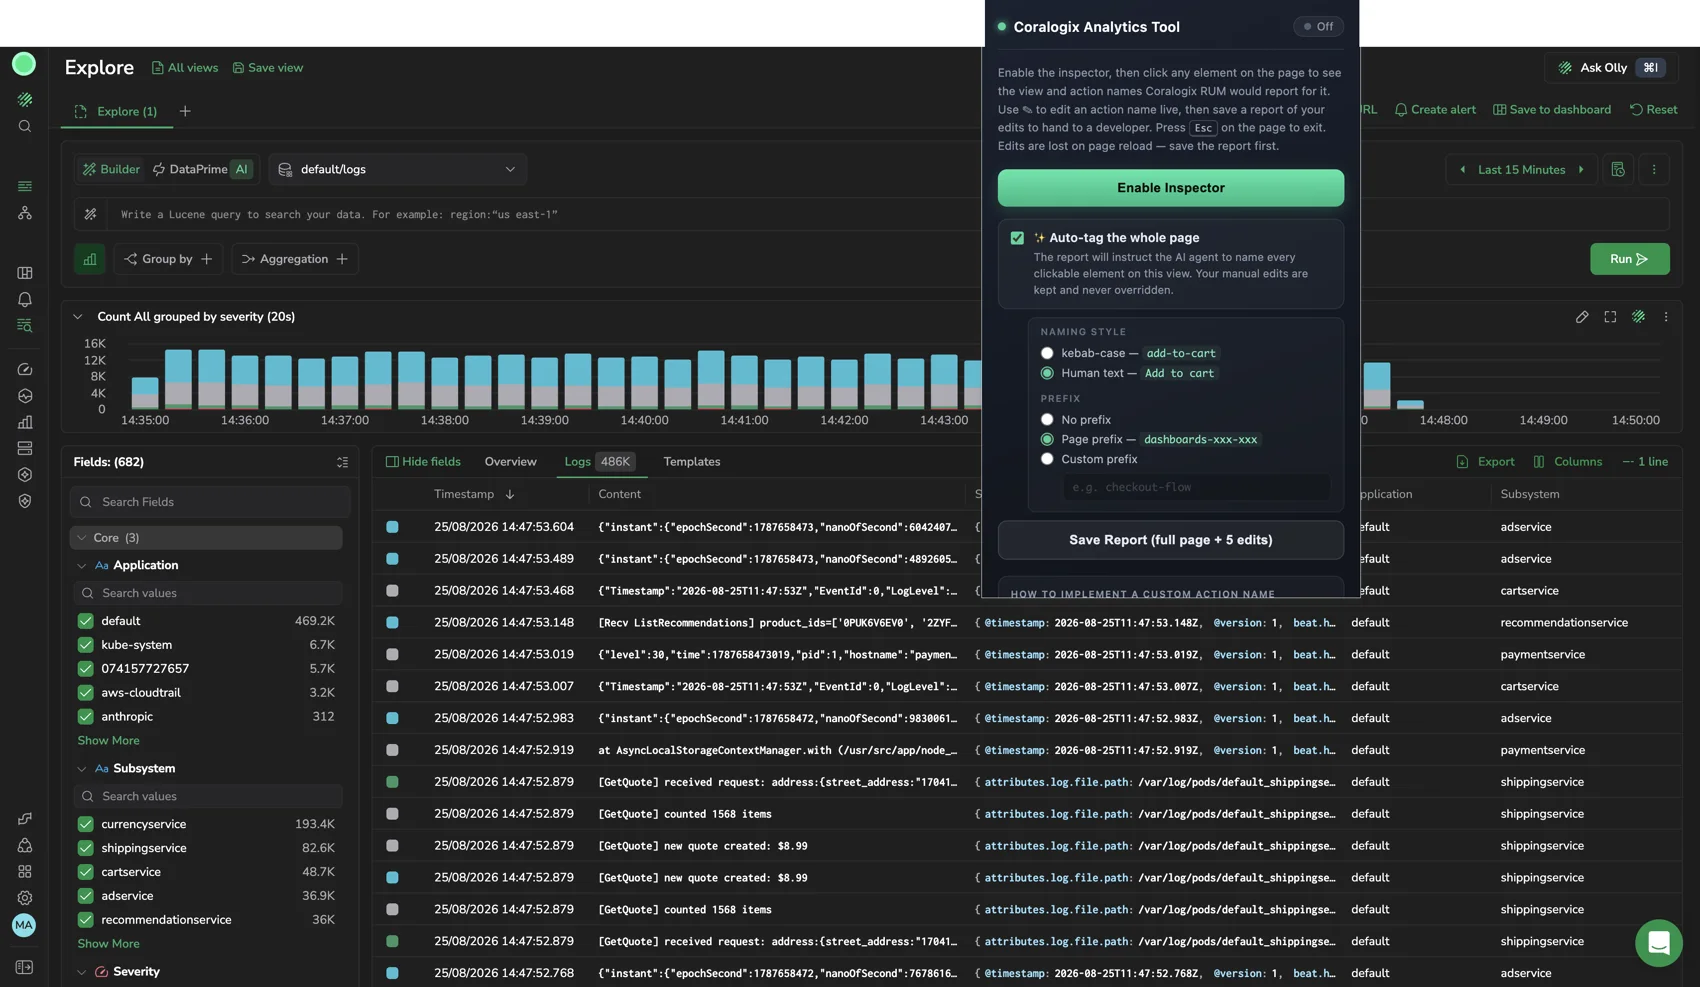
The Coralogix Analytics Tool Chrome extension shows the action name the Real User Monitoring SDK resolves for any element on your page. Enable the inspector, select an element to see its view and action names, then rename an action live to check the result on the spot. Selecting an element with no click affordance, such as a heading, flags it as a dead click. Select Auto-tag the whole page to cover every clickable element on the page in one pass, and set a naming style and prefix so the generated names stay consistent. Saving produces a Markdown report with the selector, markup, and instructions a developer or coding agent can follow to apply the names in your source. Requires Browser SDK 3.23.2 or later. Learn more
Product Analytics

Product Analytics turns your Real User Monitoring data into business-level insight, built on the sessions, views, and actions your RUM SDK already collects. Build multi-step Funnels to measure conversion and drop-off across a flow, use Heatmaps to see where users click and scroll on a page, and map user journeys with Pathways to trace the routes users take before or after a chosen view. Learn more