SLOs
Retrieve SLO status through the API
Pull an SLO's compliance and remaining error budget programmatically with the new SLO Status API endpoint, GET /slo/slos/v1/{id}/status. Query the SLO as a whole, a single grouping slice, or a specific permutation, over the SLO's default window or a custom from/to window of up to 28 days, and optionally override the target to see how the SLO would measure against a different objective.
Exclude planned maintenance from SLO evaluation
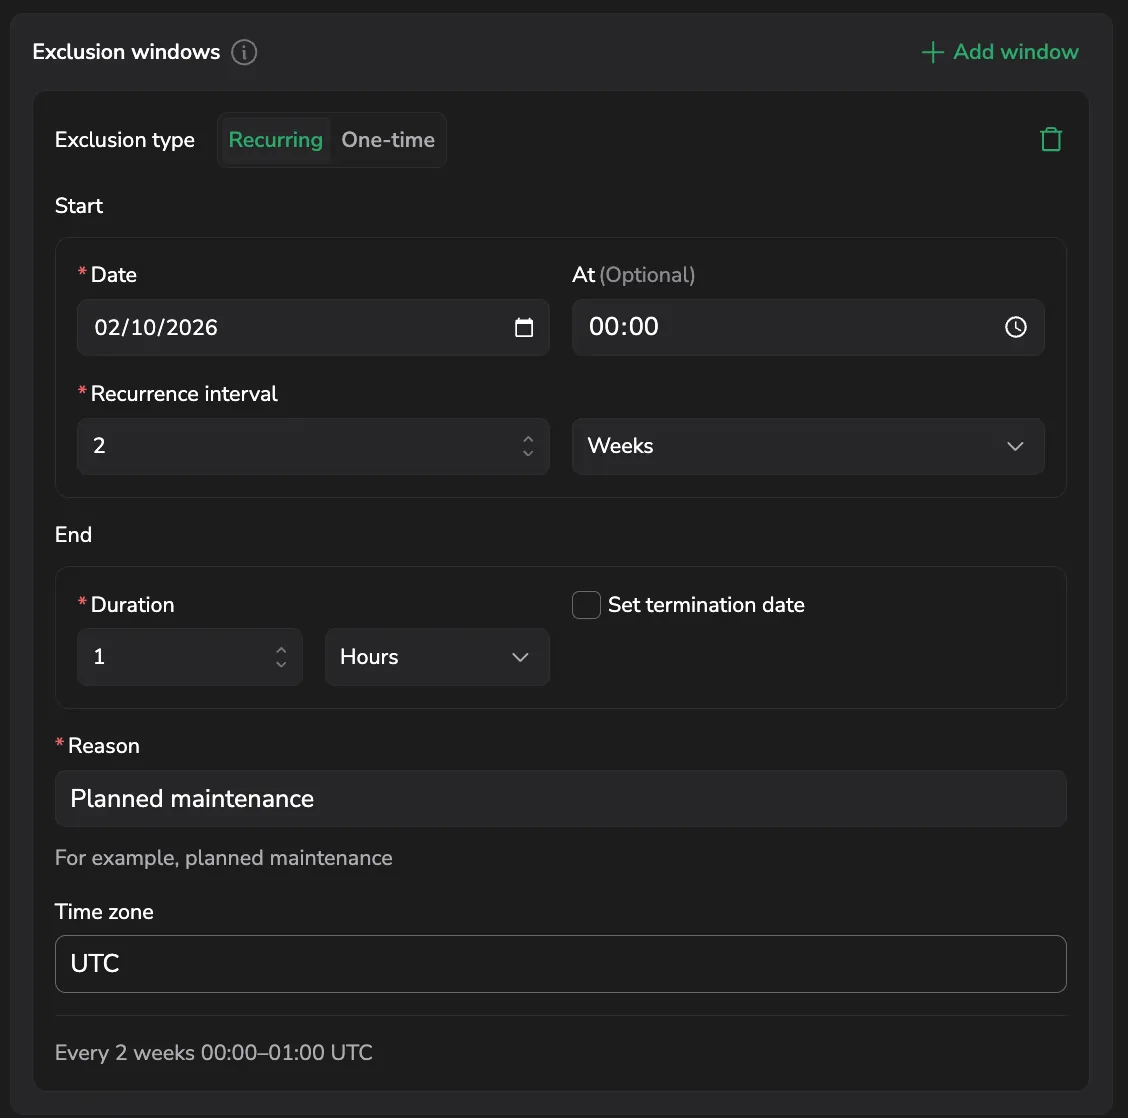
Add exclusion windows to leave planned maintenance and other expected downtime out of an SLO's evaluation. Define recurring or one-time windows (in UTC) with a reason from the SLO's create or edit drawer, then see them marked on the SLO Center grid, the 30-day health calendar, and the 7-day status trend. Learn more
Pivot the SLO Center by a grouping key
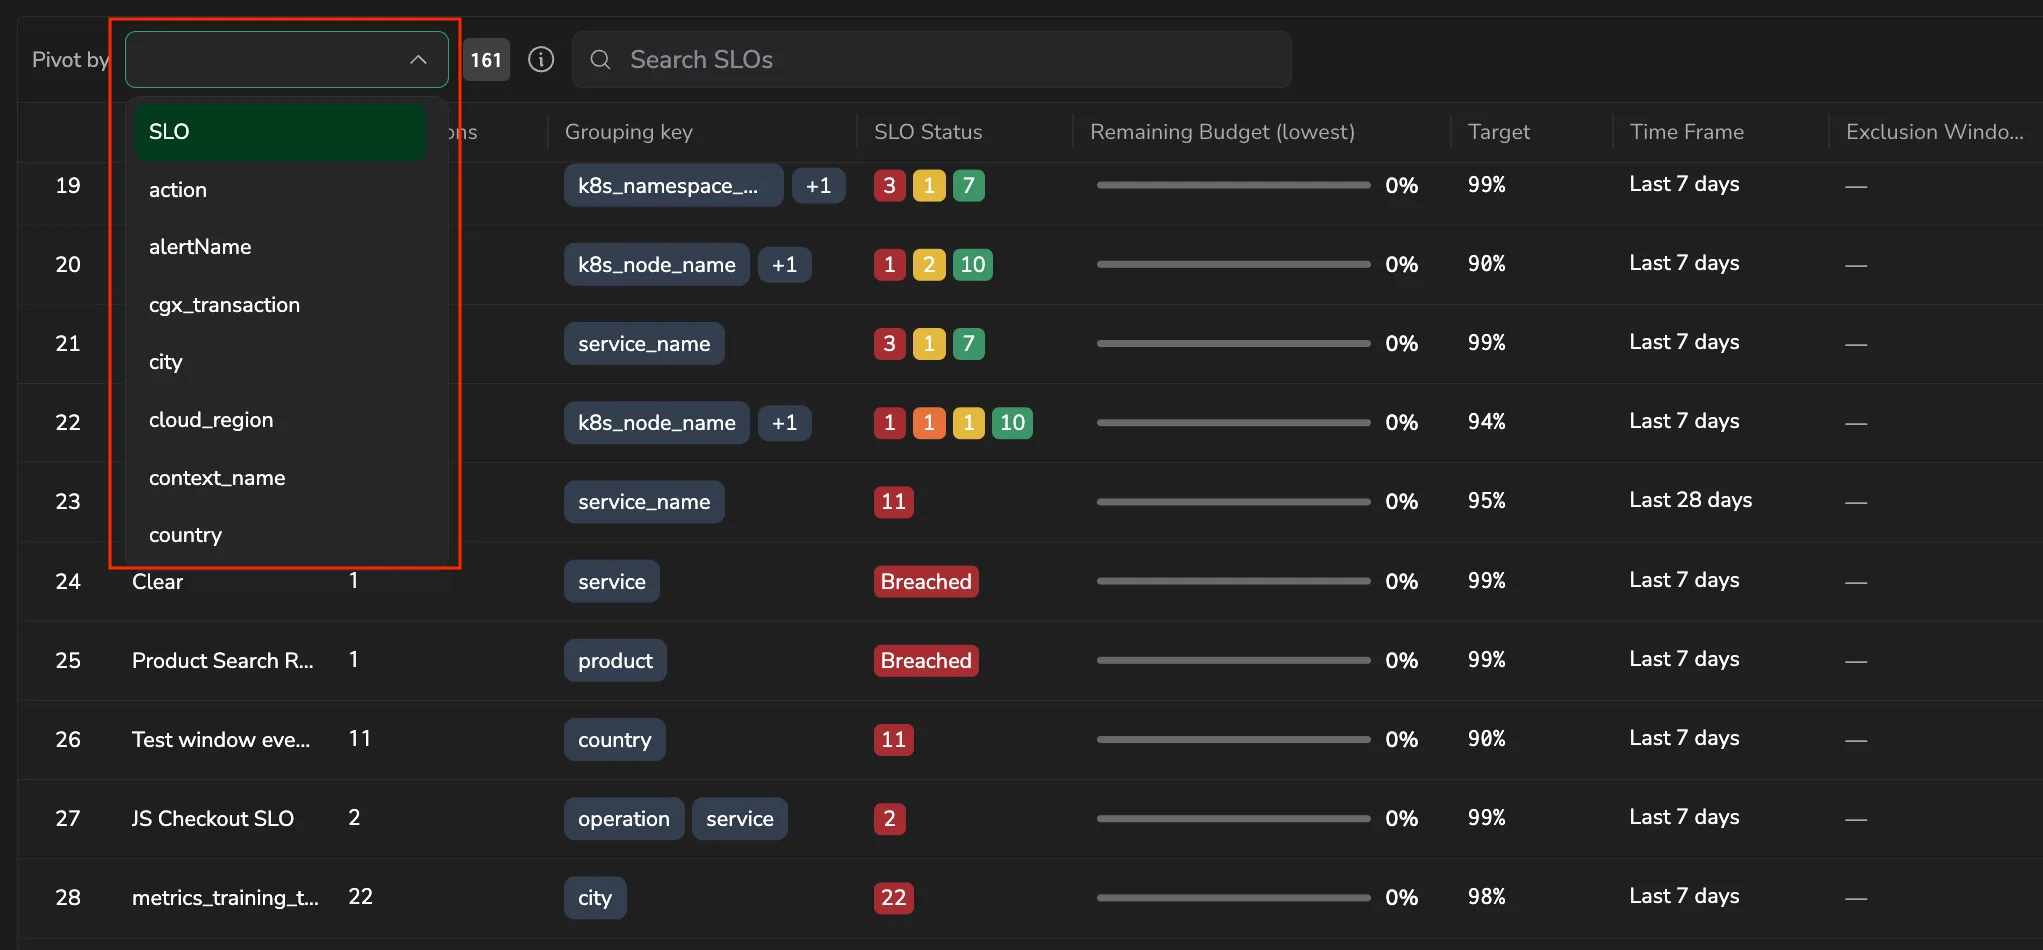
Rebuild the SLO grid around a single grouping key, such as region, cluster, or service.name, so each row rolls up every permutation carrying that value across all your SLOs. Sort the pivoted grid by its SLO groups, permutations, or lowest remaining budget to read reliability per entity instead of per objective. Learn more
Redesigned SLO Performance tab
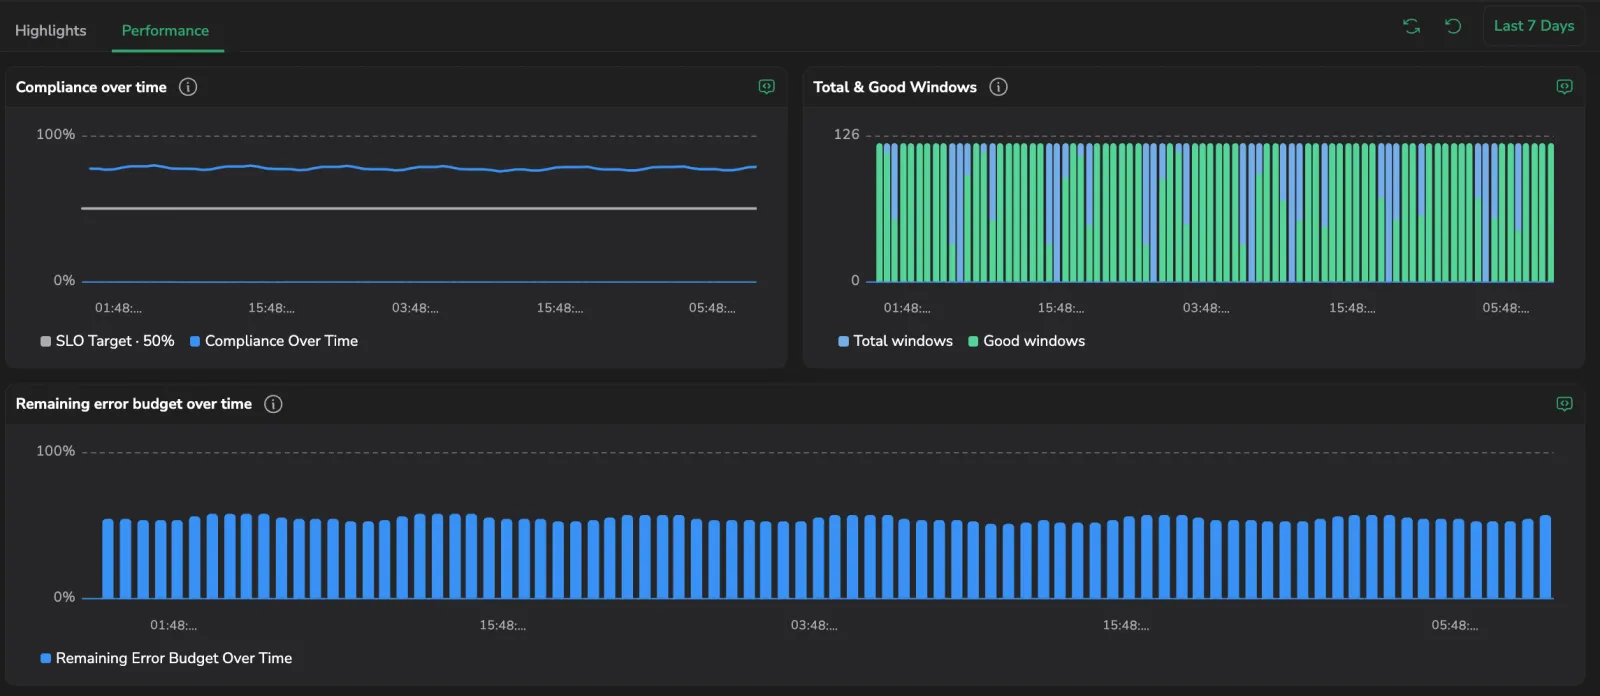
The SLO drilldown's Performance tab now shows three charts (compliance, total and good events, and remaining error budget over time) plus a new Per-minute snapshot panel that reruns the raw SLI query at 1-minute resolution, so you can reconcile the SLO engine's recording-rule view against the raw metric. Learn more
Saved views in the SLO Center
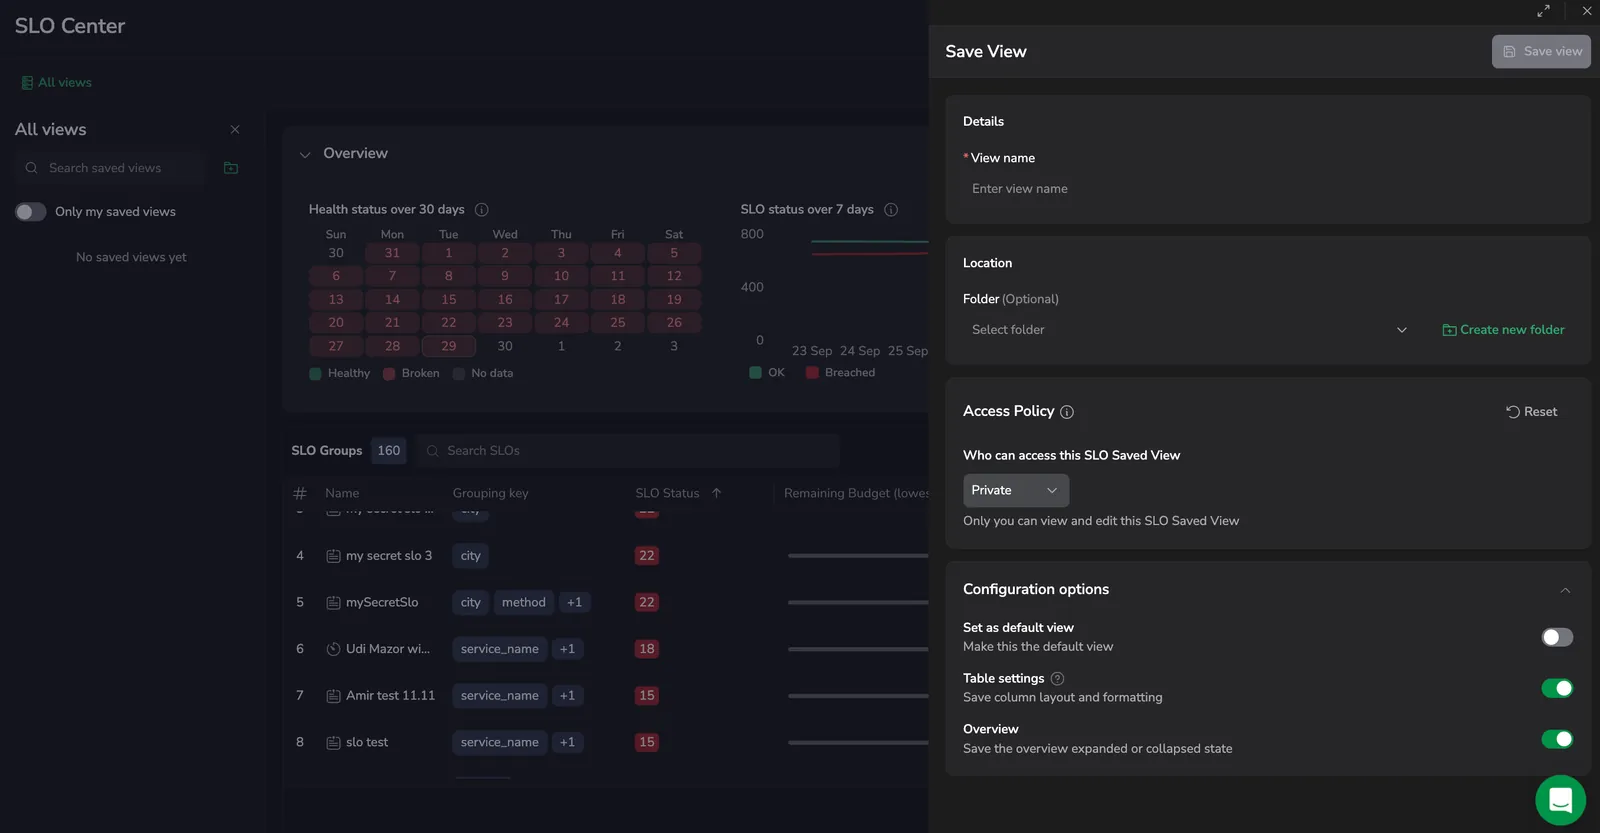
Save a configured SLO Center view (its filters, grid layout, and status-overview state) as a named view, then reopen it anytime from All views. Organize views into folders, set a personal default, and share views with your team through access policies. Learn more
Filter SLOs by entity-label key
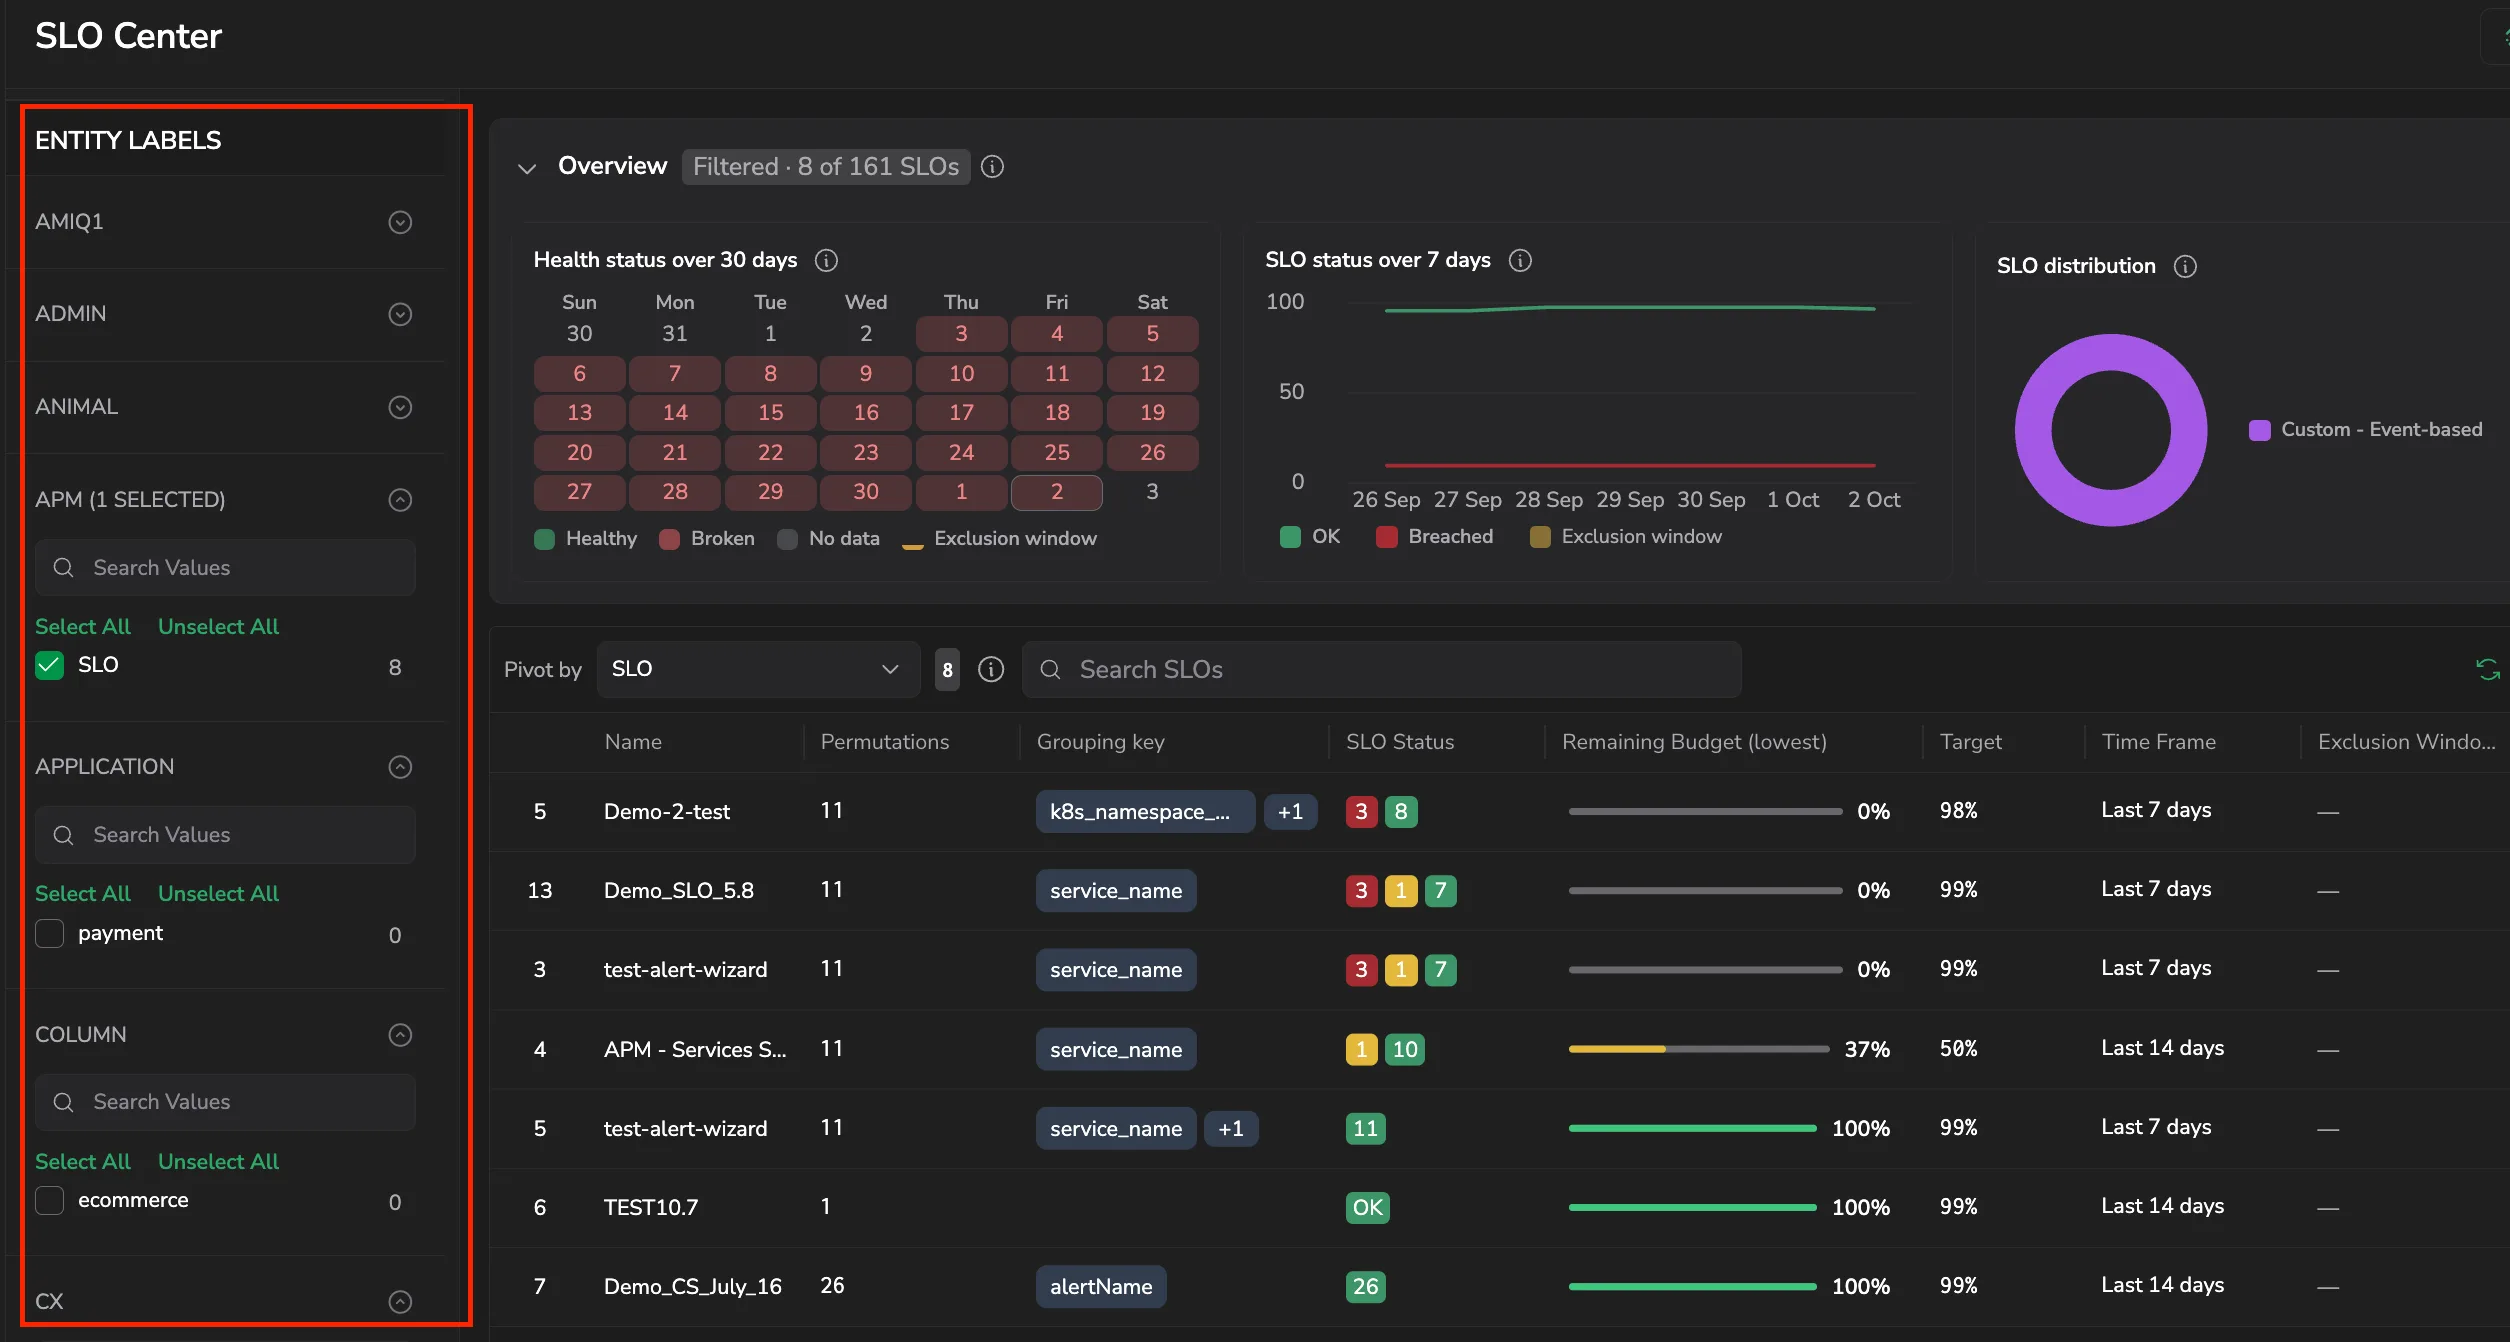
The SLO Center side filter now lists each entity-label key as its own filter instead of one combined list. Values of the same key match any of them, while different keys must all match, so you can narrow the SLO grid to an intersection across keys, for example region:eu together with team:payments. Learn more
SLO Center overview charts follow your filters
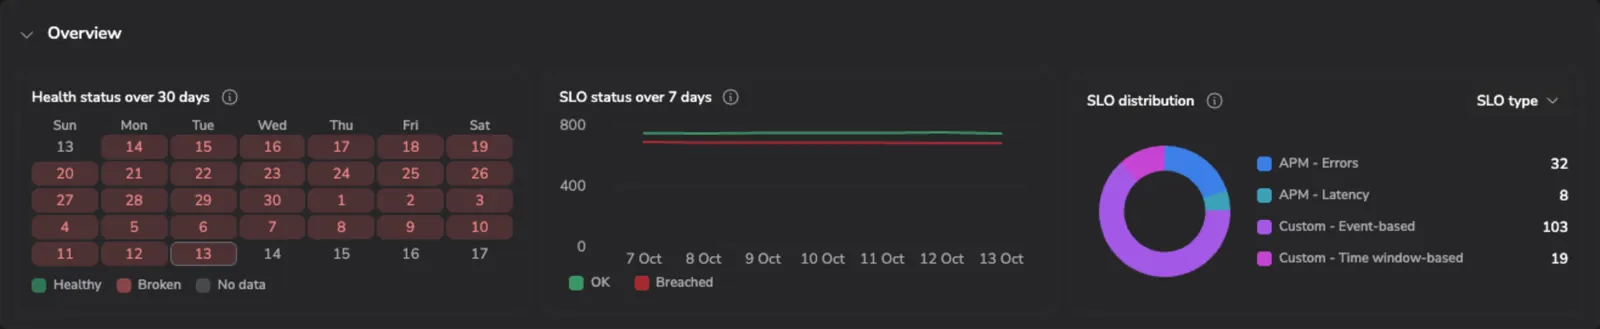
The three overview charts at the top of the SLO Center now reflect the filters you apply to the SLO list. Narrow the list by type, status, remaining budget, or ownership, and the health calendar, status trend, and distribution donut recalculate to cover only the matching SLOs, with a Filtered · N of M SLOs chip on the Overview header showing the scope. Clear the filters to return to the full-environment view. Learn more
Save SLOs with unconventional or no-data queries

SLO creation no longer blocks valid but unconventional SLIs. Only two things stop you from saving: a missing required field, or a query that can't parse or run. A query that returns no data now raises a warning instead of blocking, so you can still save the SLO and refine it later. Learn more
SLO Center overview and drill-down refinements
- Full-week health calendar: the Health status over 30 days calendar now renders complete Sunday–Saturday weeks, filling in the days around the tracked window so the grid reads as clean weekly rows instead of leaving blank cells at the edges. Learn more
- Predictable group selection: opening an SLO group now selects its first SLO by default. The drill-down charts and statistics reflect that selection, so the view opens on a consistent starting point every time. Learn more
Collapse the SLO Center overview
Collapse the Overview section at the top of the SLO Center to give the SLO grid more room. Collapsing swaps the three charts for a compact preview strip (broken days over the last 30 days, current OK and breached counts, and your SLO types with the leading group) and expanding brings the full charts back instantly, with no data reload. Learn more
Overview charts in SLO Center
SLO Center now opens with three charts that summarize the health of all your SLOs at a glance. A 30-day calendar shows each day's aggregated status (healthy, broken, or no data) with today always last. A 7-day trend line plots OK against breached so you can see which direction reliability is heading. A distribution donut snapshots how your SLOs are composed right now, and a dropdown switches the split between SLO type and status. Hover any chart for its exact counts. The charts summarize rather than filter: drill-down still happens through the SLO grid below, which the charts do not affect. Learn more
SLO Investigation UI
This feature is behind the slo-performance feature flag. Contact Coralogix Support to enable it.
Drill into any SLO's error budget burn with the new Investigation UI. The bucket-based view shows Good vs. Total Events over time, lets you select any time bucket to inspect the underlying data, surfaces periods with no data so you can distinguish a healthy window from a missing signal, and includes an error budget correlation chart that maps budget consumption against changes in burn rate. Learn more
Ownership tags on SLOs
Tag every permutation of a grouped SLO with Service, Environment, and Team at creation time. Set a value for the whole SLO group, or derive each value from a label in the query so the tag follows the data. Available on APM, event-based, and time window SLOs, with matching Service, Environment, and Team columns on the SLO grid. Learn more
APM SLO type and redesigned Preview panel
New APM SLO type. Define reliability objectives directly from a service: choose Errors or Latency, apply filters, set the time frame and target, and let Coralogix manage the underlying queries and metrics. No PromQL required. Learn more
Redesigned Preview panel, As you fill in the SLO form, the Preview validates your queries in real time, ranks the worst-performing permutations, and surfaces an AI smart-tip that suggests an achievable target along with metric-fit and query-shape guidance. Apply all suggested corrections at once with Fix all. Learn more
Redesigned SLO alert conditions
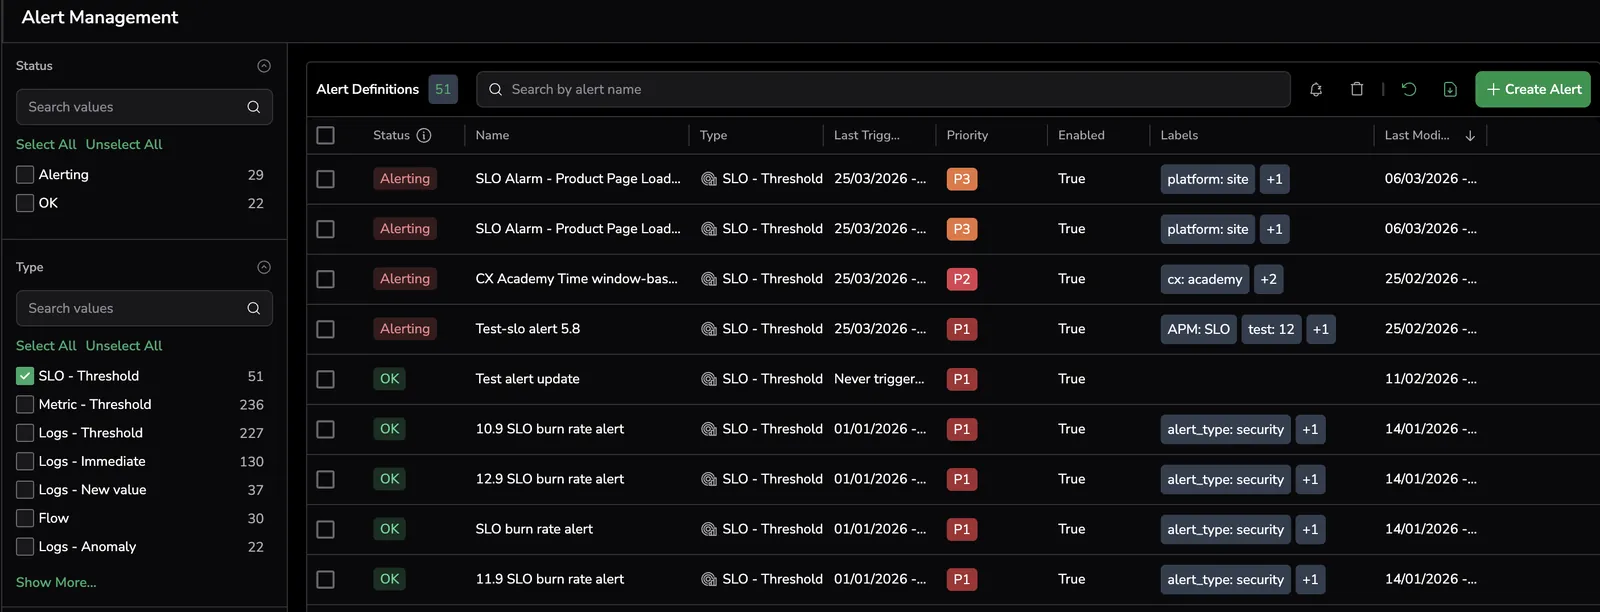
SLO burn rate alerts now support two detection modes:
- Single Mode: monitors the burn rate over the evaluation window you define. Fires when the budget is depleting faster than the sustainable pace.
- Dual Mode: adds a rapid quality signal on top of the slow burn check. Detects sudden collapses in service quality evaluated over a fixed 10-minute window.
No action required. Existing alerts continue to work as configured. Learn more
Query validation and Highlights

New validations for both SLO types in SLO query validation. Learn more
New Highlights feature in View and Manage SLO. Learn more
Manage SLOs as code with Terraform or API
Manage SLOs as code. Define and manage SLOs via Terraform or API. Automate and version your reliability goals across environments. Learn more
Real-time SLO tracking and alerts
Real-Time SLO Tracking & Alerts. The new SLO Center (now in open Beta) lets you define Service Level Objectives, monitor their error budgets in real time, and get alerted before reliability issues impact your users. Learn more