Error tracking: user manual
As part of our Real User Monitoring (RUM) toolkit, Coralogix offers multi-faceted Error Tracking. Designed to help web application owners and developers gain insights into errors occurring within their users' browsers, this tool allows you to effectively capture and analyze frontend errors to optimize application performance and enhance the overall user experience. Get an overview of all errors generated from your browser or view related errors in a consolidated manner. You can view errors as individual errors (Error Screen) or aggregated into groups (Error Template View).
This user manual demonstrates how to engage with our RUM UI to get the most out of our Error Tracking features.
Access the Error Tracking view
Once you have configured and installed our browser SDK, in your Coralogix toolbar, hover over RUM, then select Error Tracking.
View and explore errors
By default, the Error Tracking view opens in the Errors panel, which lists all captured browser errors.
Use the Errors panel to see every individual error generated by your browser, along with the number of affected users and total occurrences. You can filter results, adjust columns, and create alerts directly from this screen by selecting Create Alert.
Display
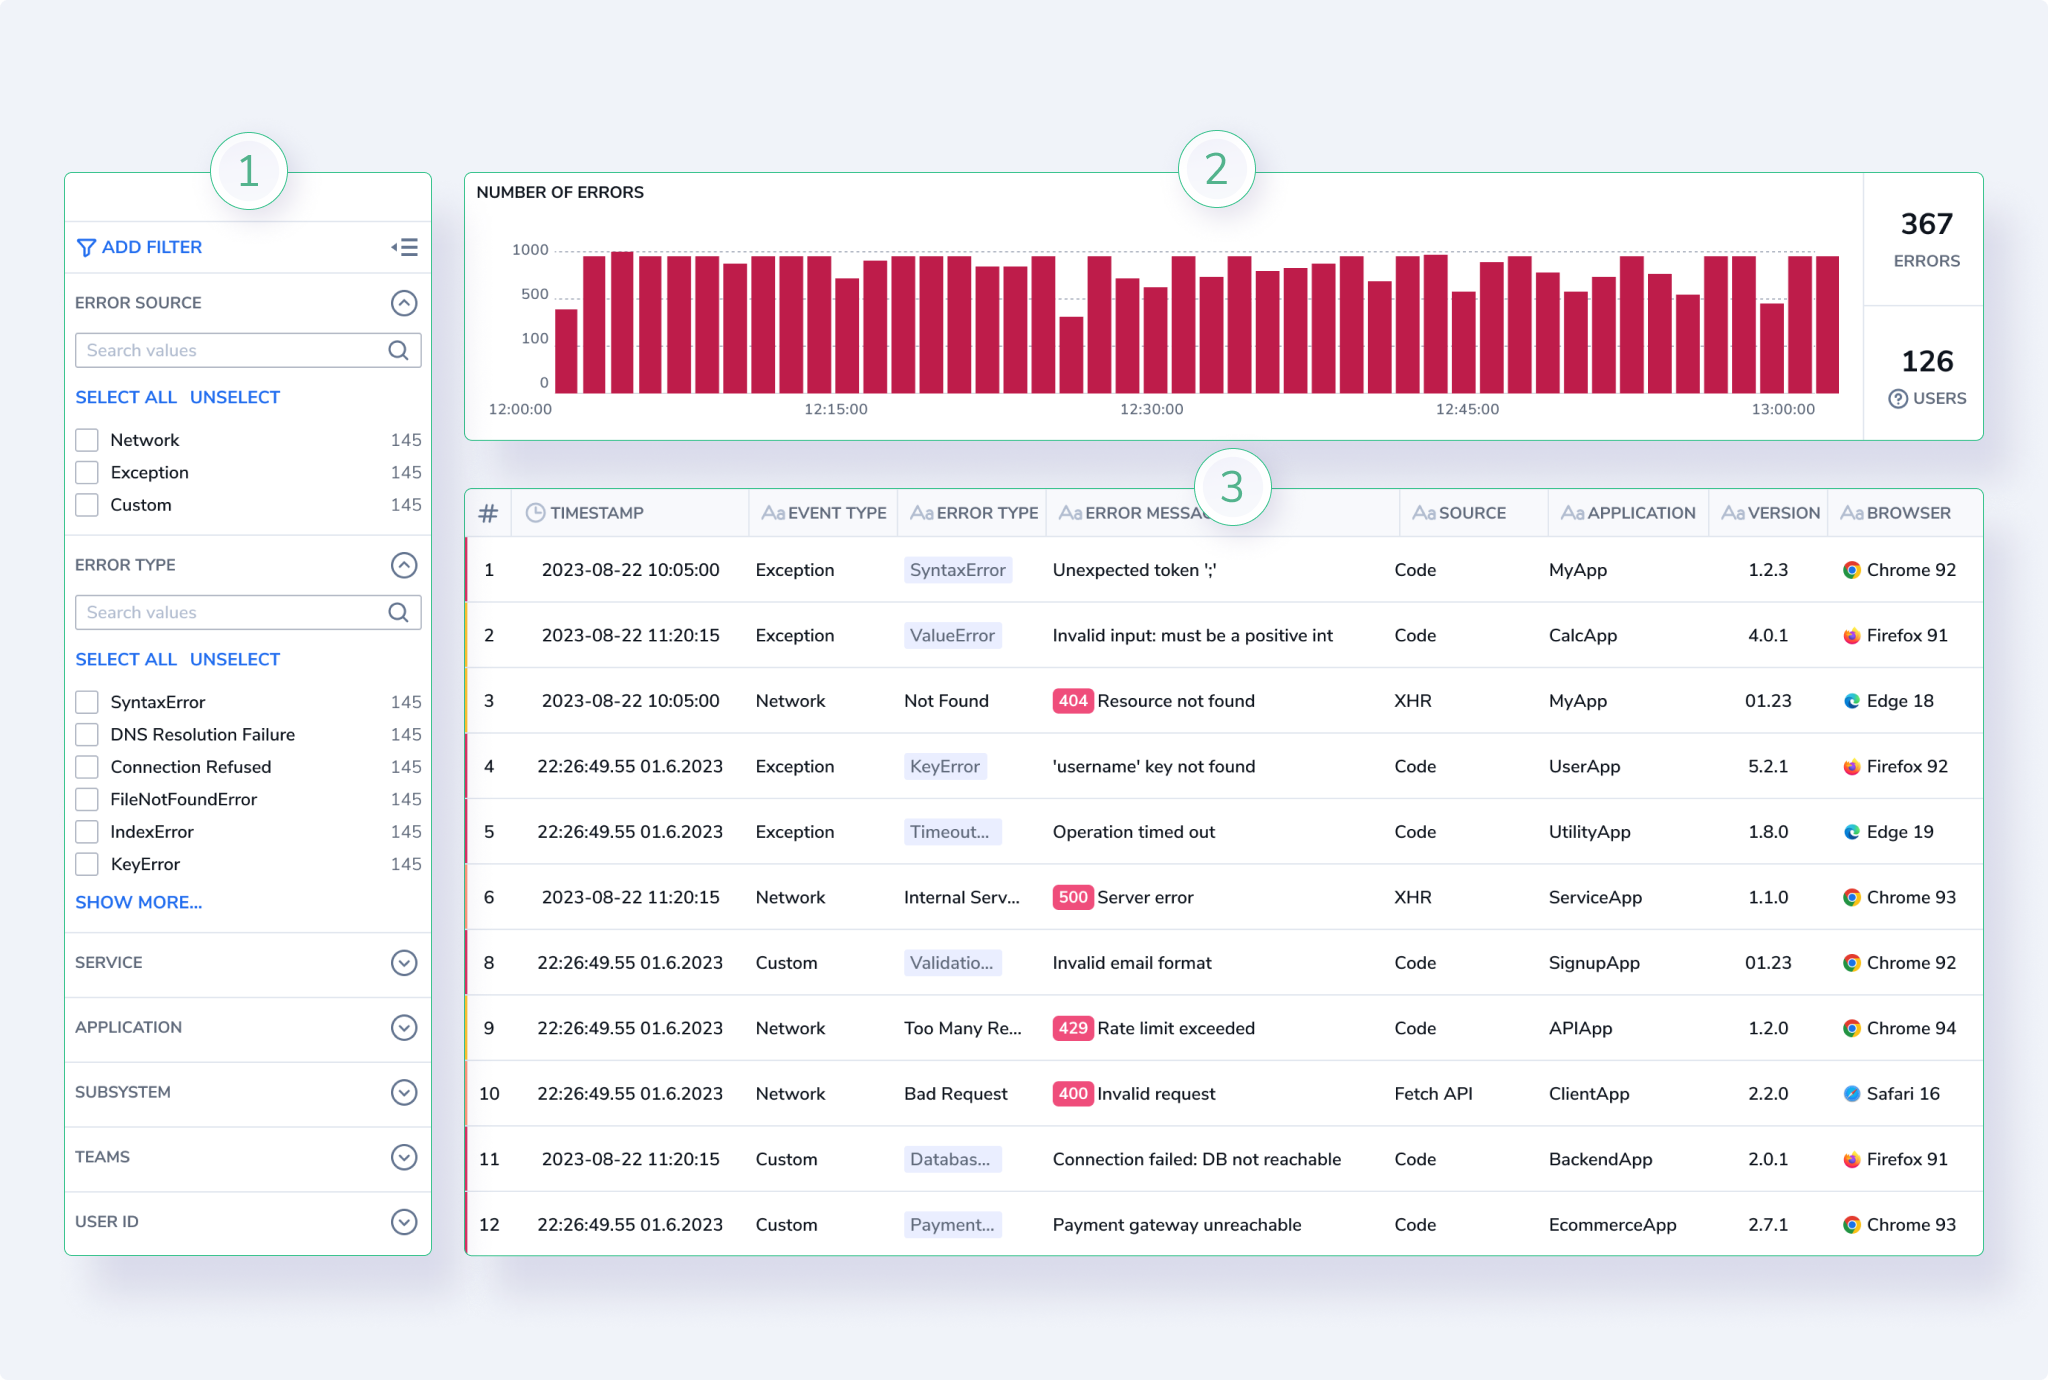
The Error Screen includes:
Filters. Refine your view by filtering errors according to particular attributes.
Error Overall Graph and KPIs. This graph presents the error trend in the application and the overall number of errors and users affected.
Error Grid. Use the error table grid to view error information, row by row. Modify columns and the information presented based on your specific interests.
Group related errors (Templates view)
In addition to a granular view of all errors, take advantage of our Error Template view, where similar errors with shared attributes are grouped into a single template for quick and easy analysis. Find out more here.
View error details in the info panel
Select any error in the Error Tracking table to open its info panel and analyze it while keeping the full error list in view.
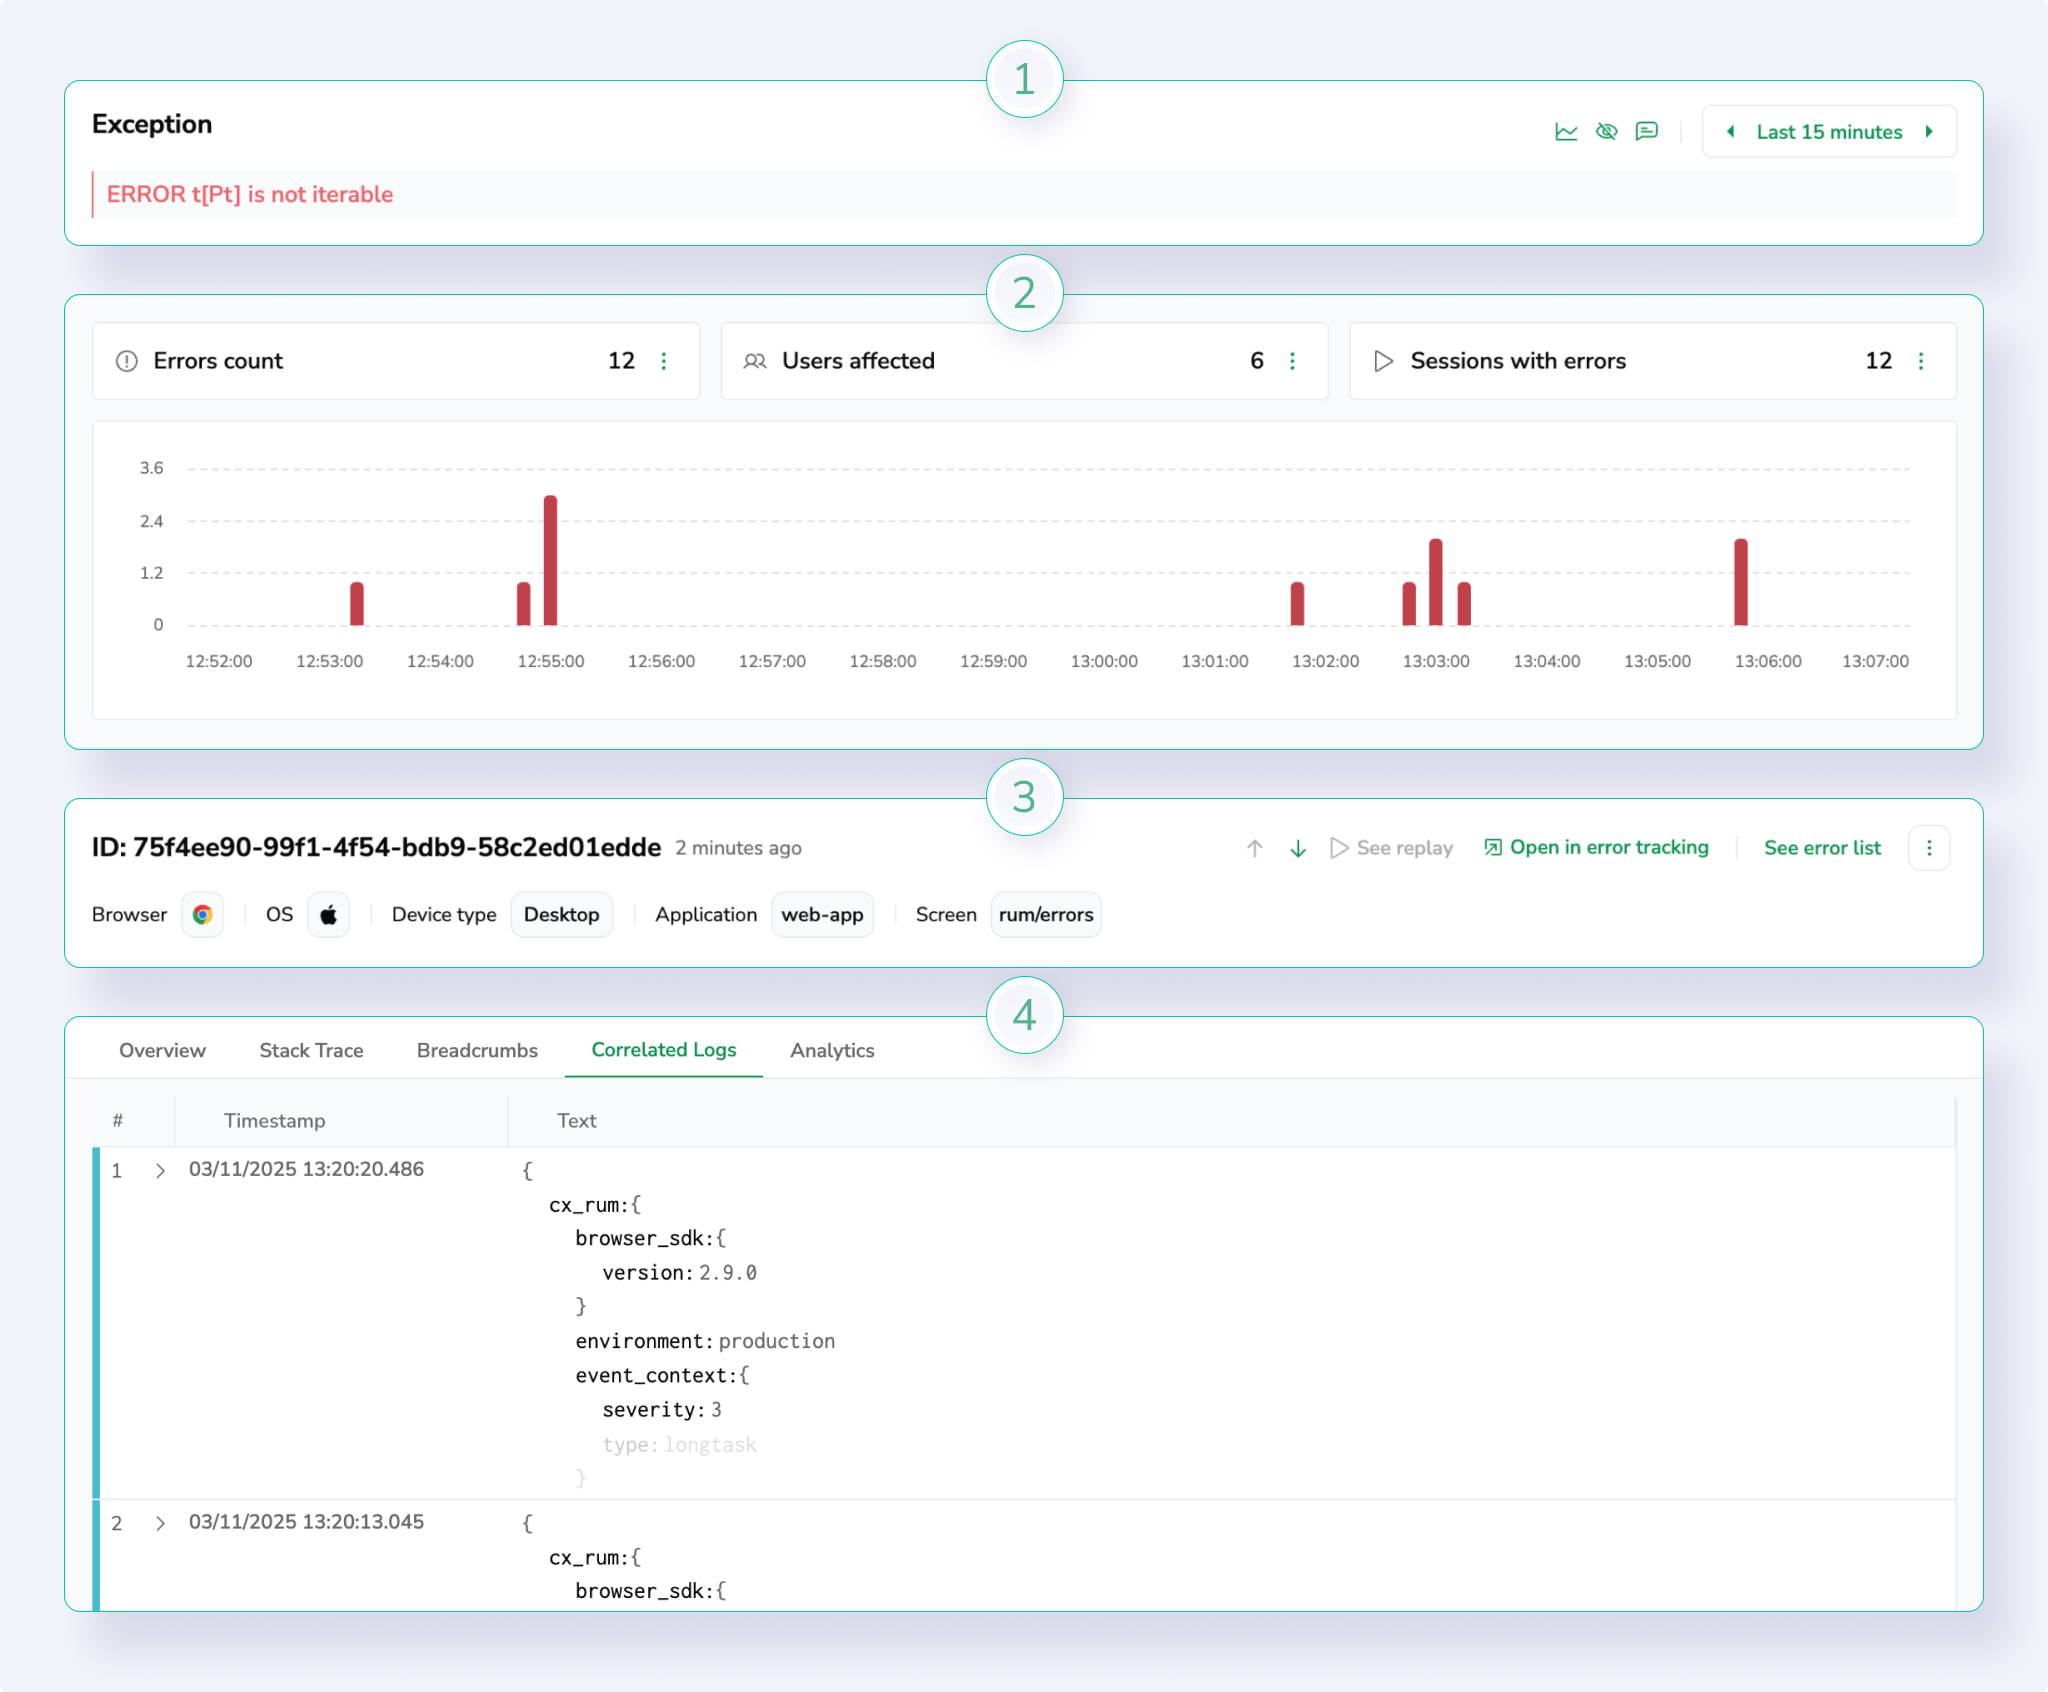
The info panel displays all details previously found in the dedicated error view, now organized into collapsible sections.
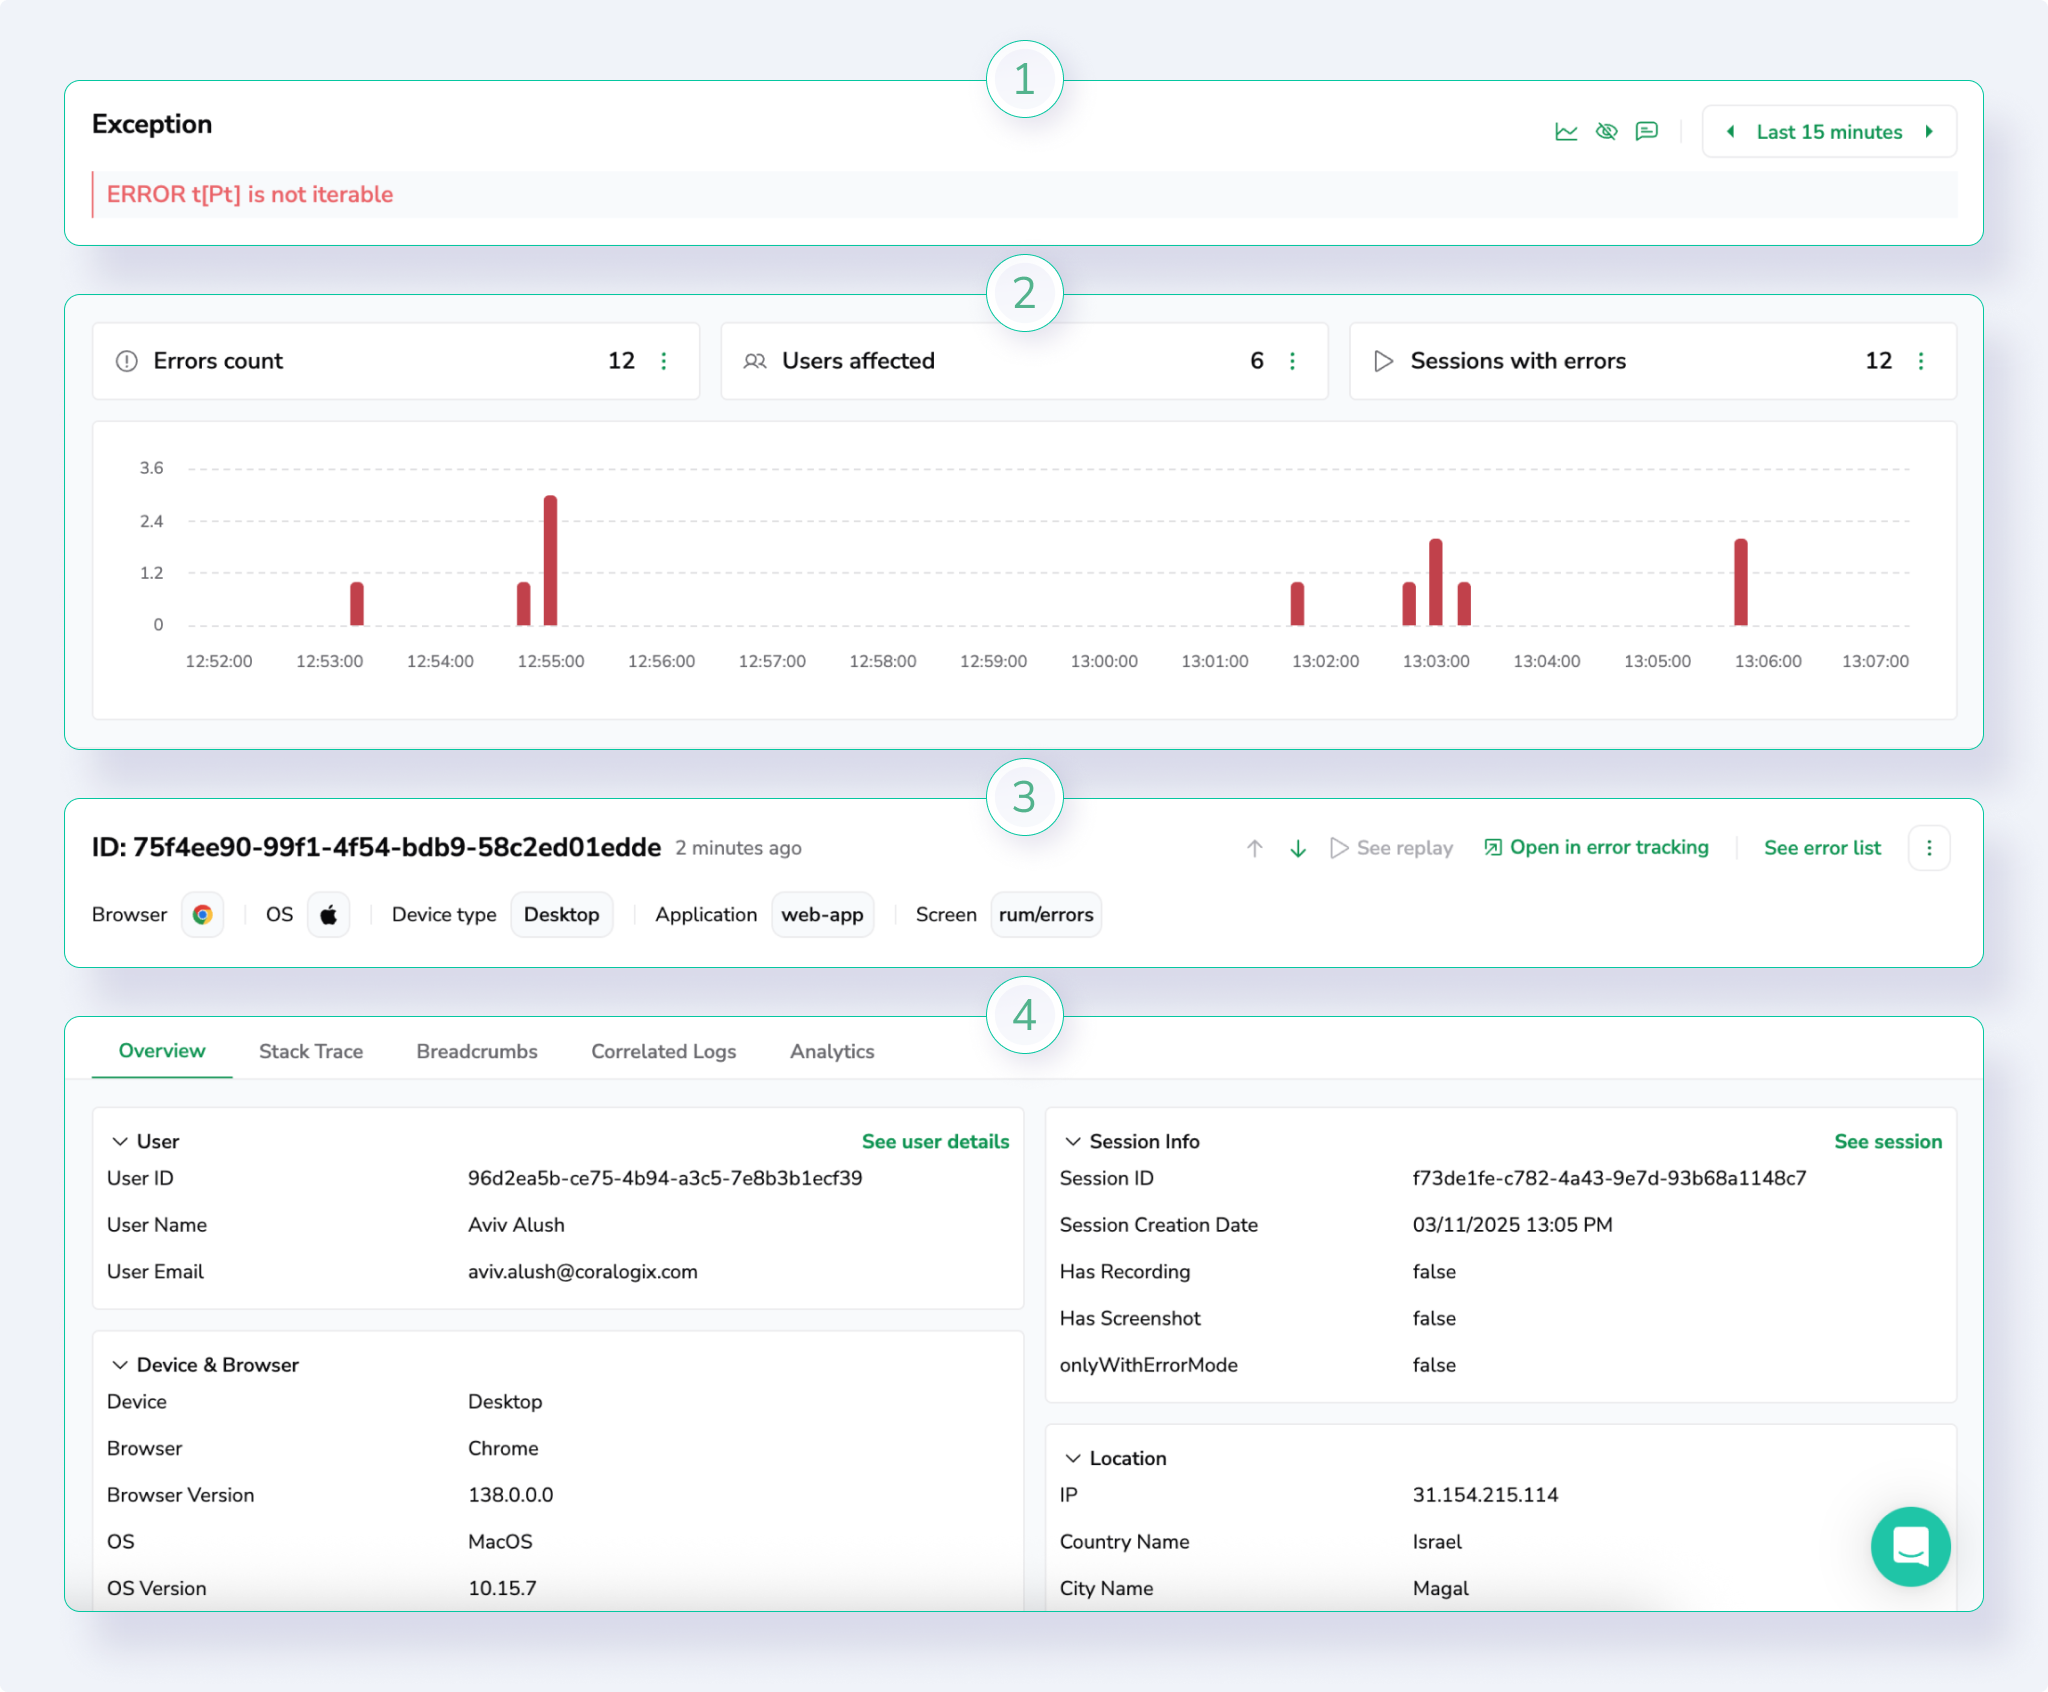
At the top of the panel, view key metrics for the selected error:
- Users affected: Total number of unique users who encountered the error.
- Error count: The number of times this error occurred during the selected time range.
- Sessions with errors: The number of recorded sessions that include this error.
Each metric includes a more actions menu to View Query in DataPrime or Copy Query, so you can open or modify the query directly in Explore or Custom Dashboards for deeper analysis.
Overview
The Overview section provides essential context and attributes for the selected error.
The following image shows an example overview panel with key attributes such as event ID, status, and environment details.
Provides essential context and attributes for the selected error, including:
- Event ID and error type
- Status and group
- Browser, device type, and country
- User labels and metadata
Stack trace
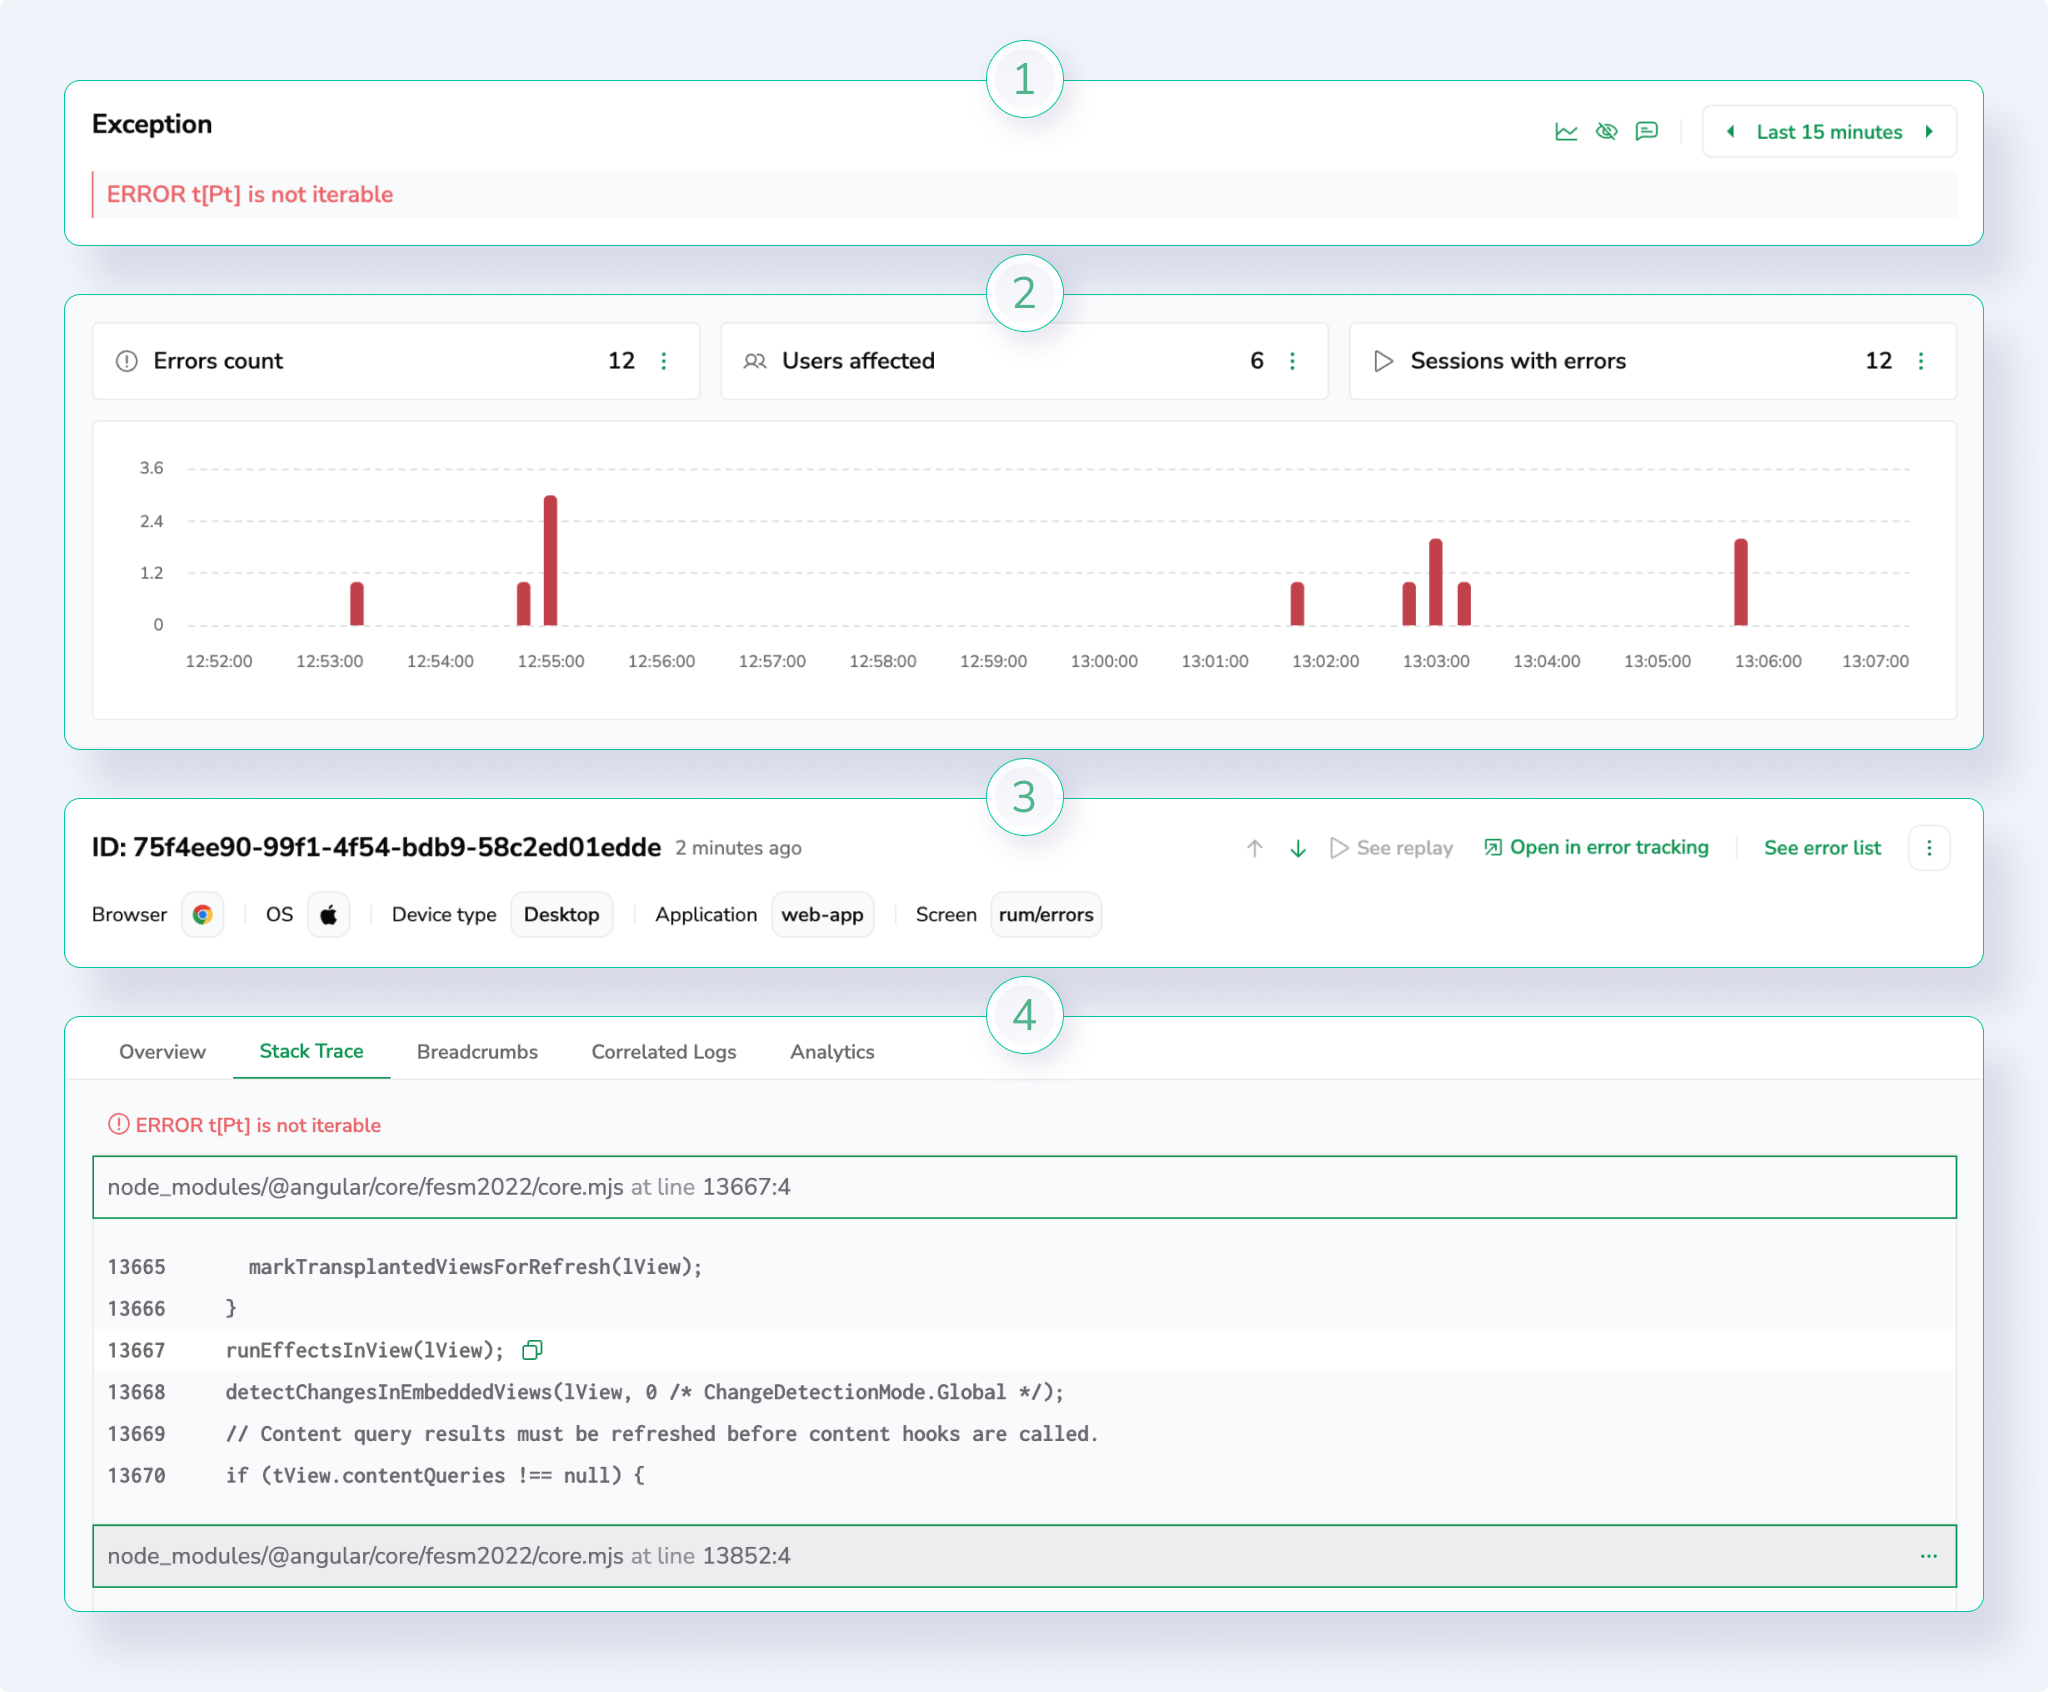
When available, the Stack Trace section shows the code-level traceback for unhandled exceptions. Use this to pinpoint the exact source or function that triggered the error.
The following image shows a sample stack trace view within the info panel.
Breadcrumbs
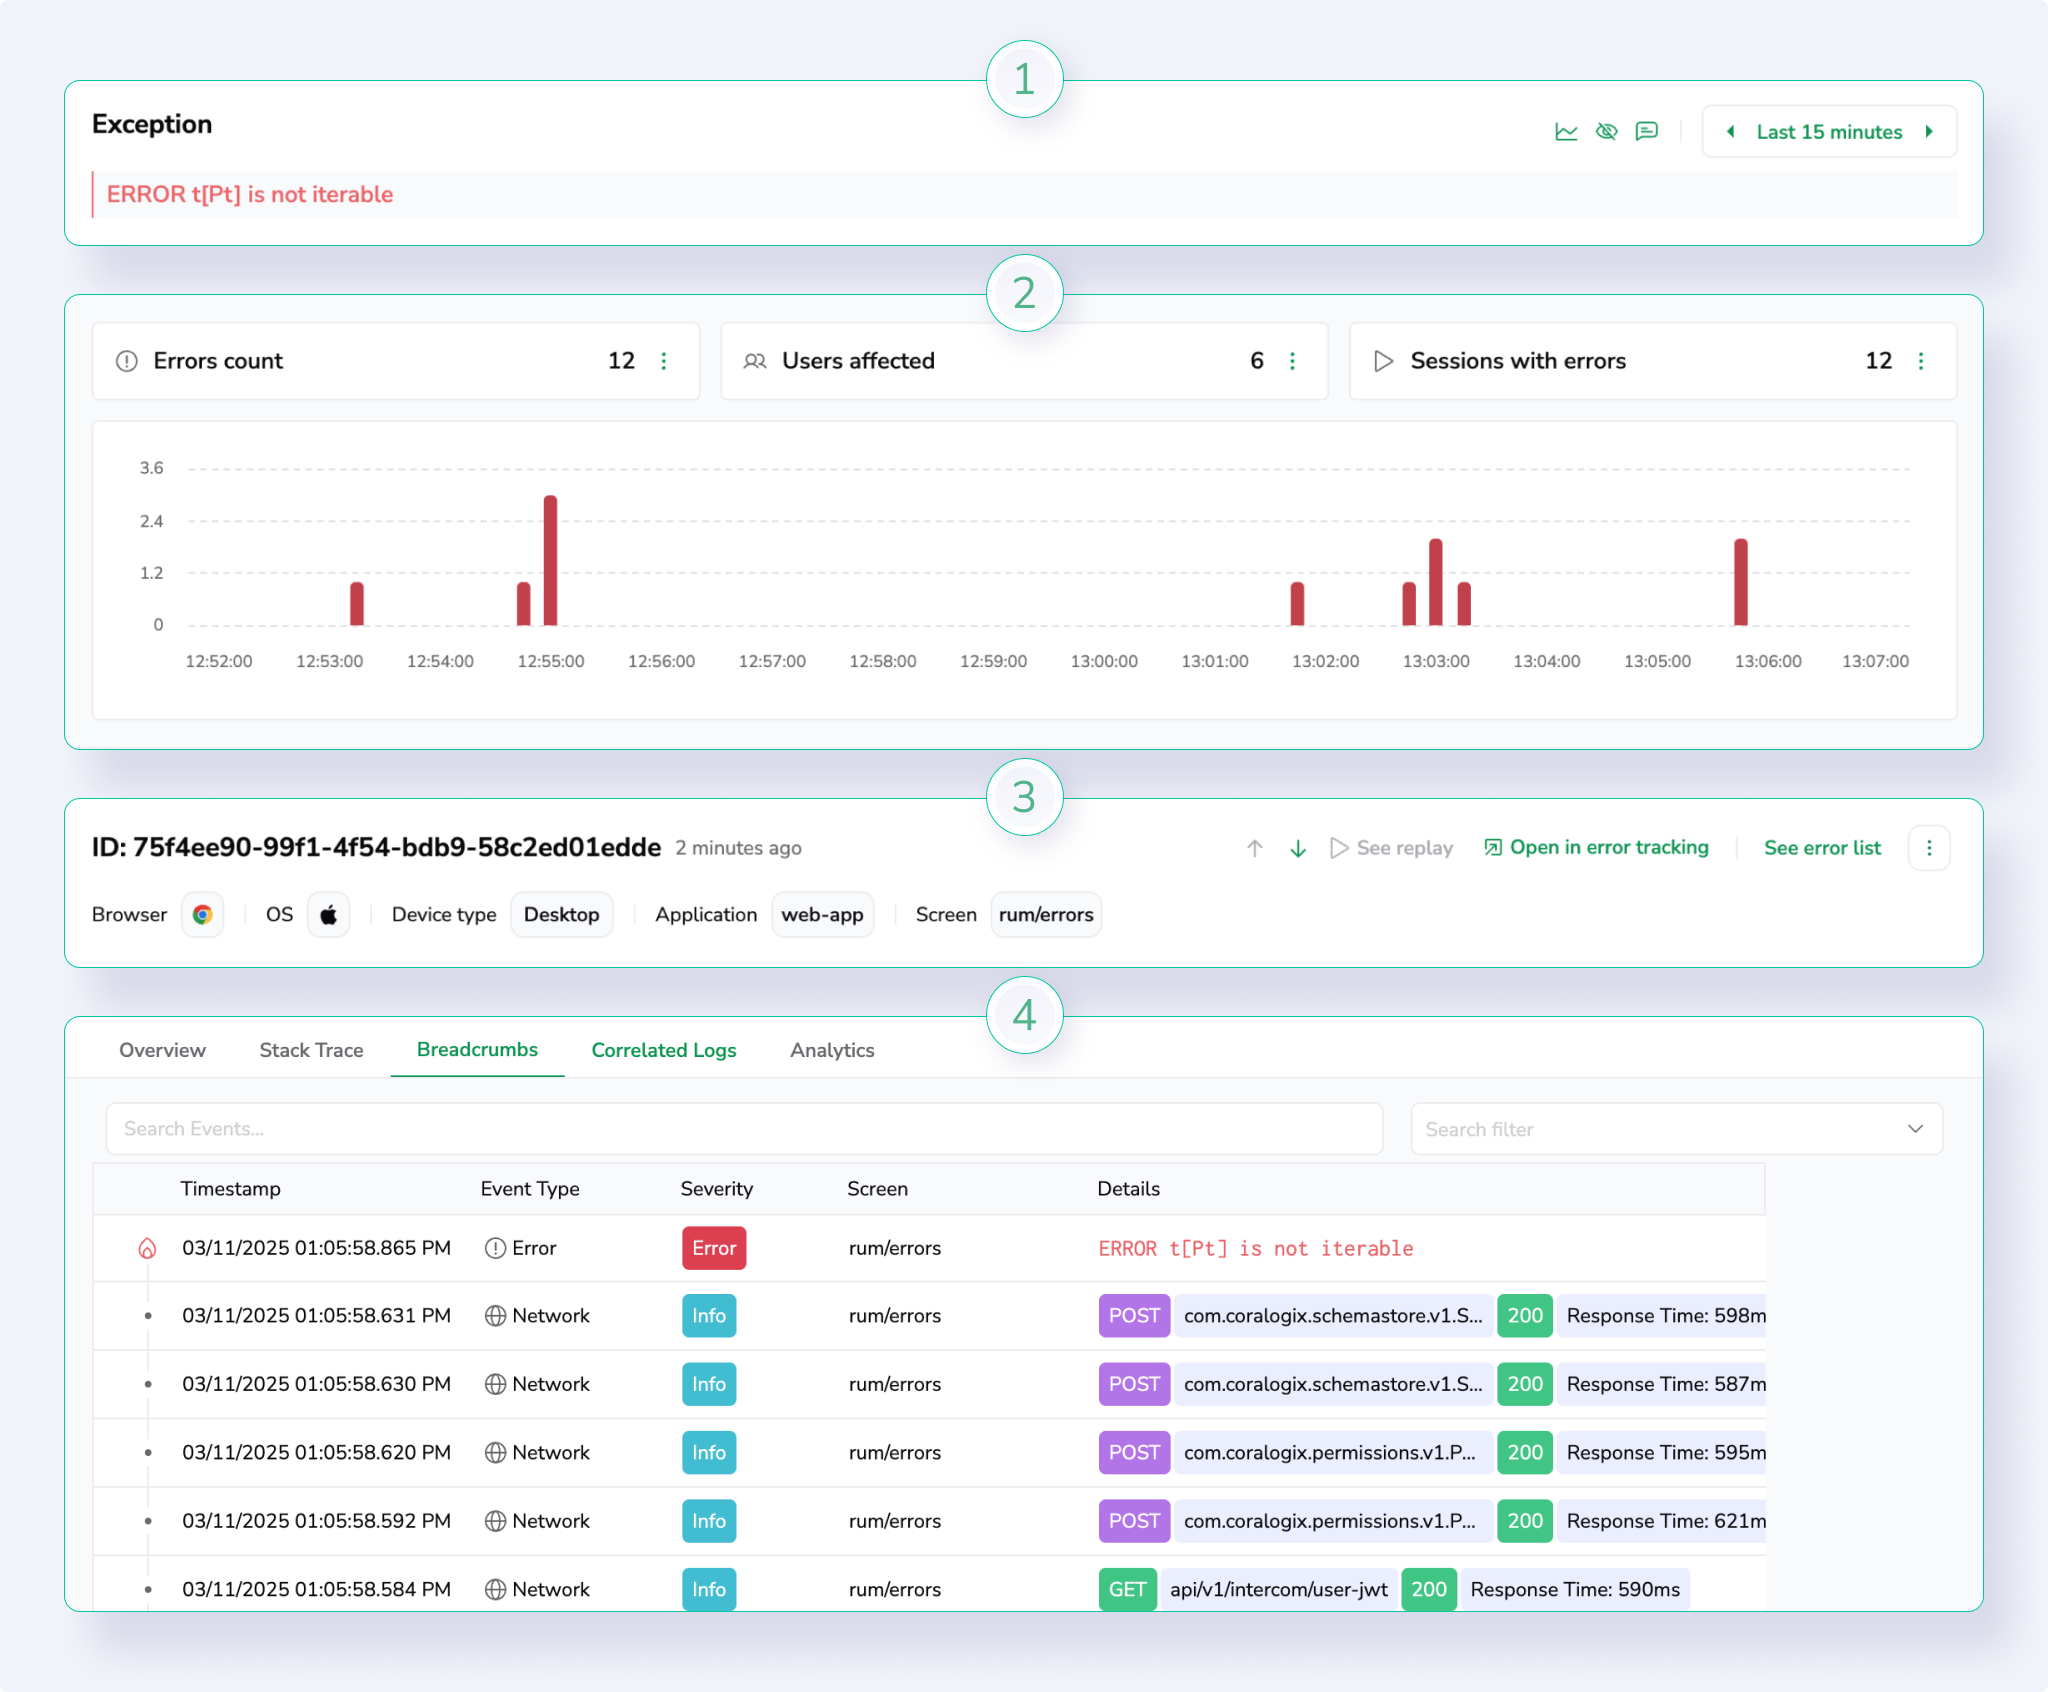
The Breadcrumbs section lists events leading up to the error, helping you understand the user’s journey before the issue occurred. Each event includes its timestamp, type, severity, and URL, with filtering and search controls to refine the view.
The following image shows a breadcrumbs list with event types, timestamps, and severity indicators.
Correlated logs
The Correlated Logs section surfaces logs tied to the same session and context, providing deeper diagnostic data for root-cause analysis.
You can open any correlated log query directly in Explore by selecting View query in DataPrime or copy it for use in a custom visualization.
The following image shows correlated logs with options to view or copy their DataPrime queries.
Navigation
- Switch between error entries in the table to update the info panel instantly without leaving the main screen.
- To close the panel, select Close in the top-right corner or click anywhere outside the drawer.
Add an alert to track an error
Alerting refers to the practice of setting up automated notifications or alarms that trigger when certain predefined conditions or thresholds are met. These conditions can be related to the performance, health, or behavior of the systems, applications, or infrastructure being monitored. The main purpose of alerting is to promptly notify DevOps teams and developers – when something unusual or problematic occurs, so you can take appropriate actions to resolve the issue before it escalates.
For more detailed information on Coralogix Alerts, see Getting Started with Coralogix Alerts.
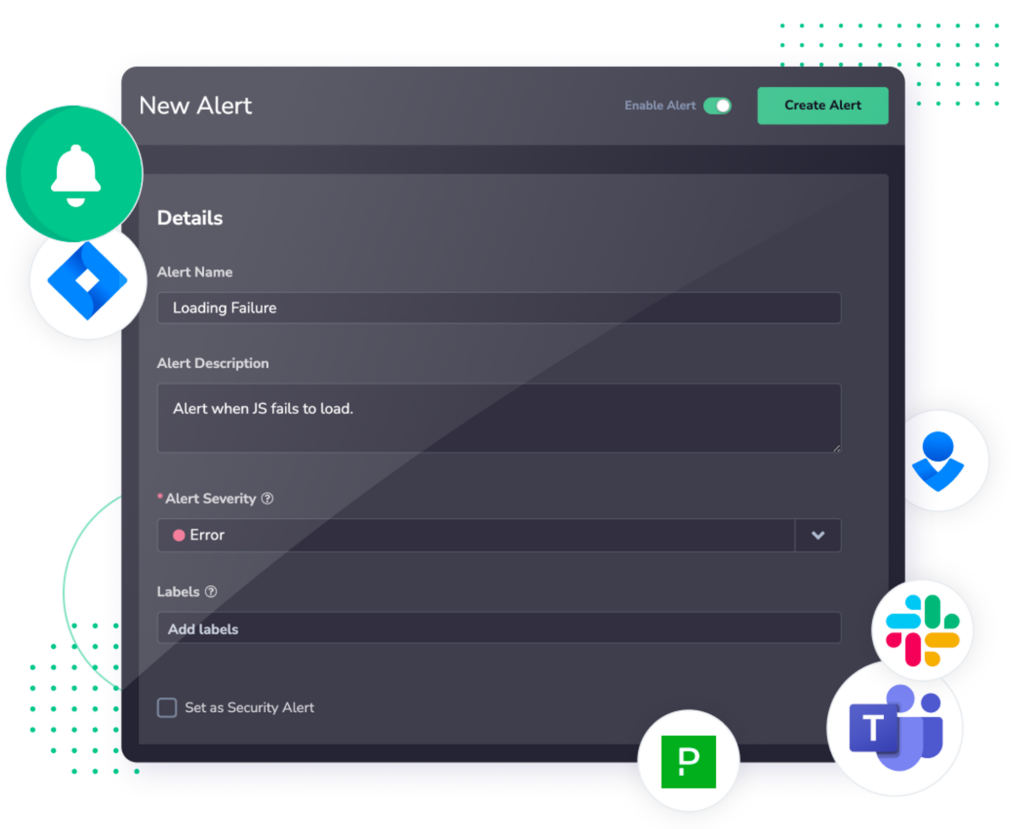
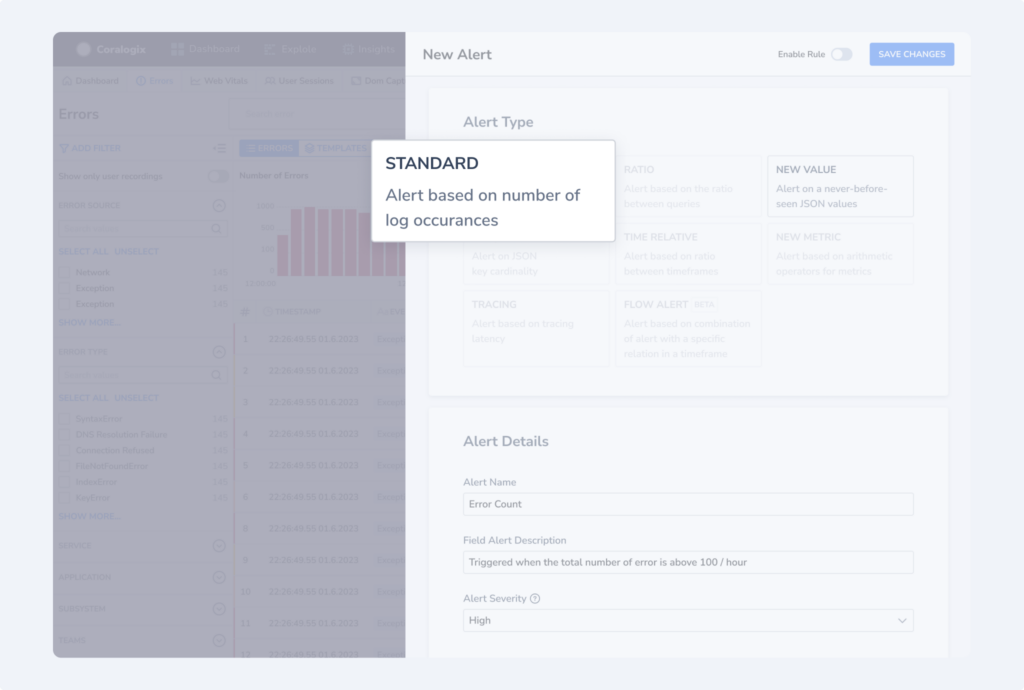
Coralogix enables you to create alerts directly from the Error Tracking screen, with several different available options for alert creation.
Create a custom alert directly from the Error Tracking screen. Select the Create Alert in the right-hand side of the screen to open the alert creation panel.
Create an alert from a specific error. Select on the left-hand side of the error, then select Create Alert. The alert creation panel opens with the specified error details already in the query.
Create an alert from a specific template. Select on the left-hand side of the template number and select Create Alert. The alert creation panel opens with the specified template details already in the query.
Create an alert from a template or error drill-down page. Select Create Alert in the right-hand side of the screen. The alert creation panel opens with the specified error or template details already in the query.
Additional resources
| Documentation | Real User Monitoring Error Tracking Error Template View Browser SDK Installation Guide |
Support
Need help?
Our world-class customer success team is available 24/7 to walk you through your setup and answer any questions that may come up.
Feel free to reach out to us via our in-app chat or by sending us an email at [email protected].
