RUM overview
This feature is available for early-access customers. To request access and confirm your organization meets the feature criteria, contact your account representative or Customer Support.
The Overview page is the home view for Real User Monitoring (RUM). It shows every monitored application as a card on a single page so you can see error and session volumes, crash-free rates, and recent activity for the whole fleet without opening each app individually. Select an app name to open a focused drilldown drawer with reliability metrics, top errors, recent releases, and platform-specific performance data.
What you need
- A Coralogix account with RUM configured and at least one application sending data through the RUM SDK.
- The
RUM:VIEWpermission.
Open the overview
- In Coralogix, navigate to RUM. The page opens on the Overview tab.
- Use the time range picker in the page header to select the period to summarize. The selection is saved in the URL so you can share or reload the view.
- To narrow the fleet, use the filters in the page header:
- Search for applications by name — filter cards by application name.
- Filter by environment — select one or more environments (for example,
production,staging). When you select all environments, the page applies no environment filter.
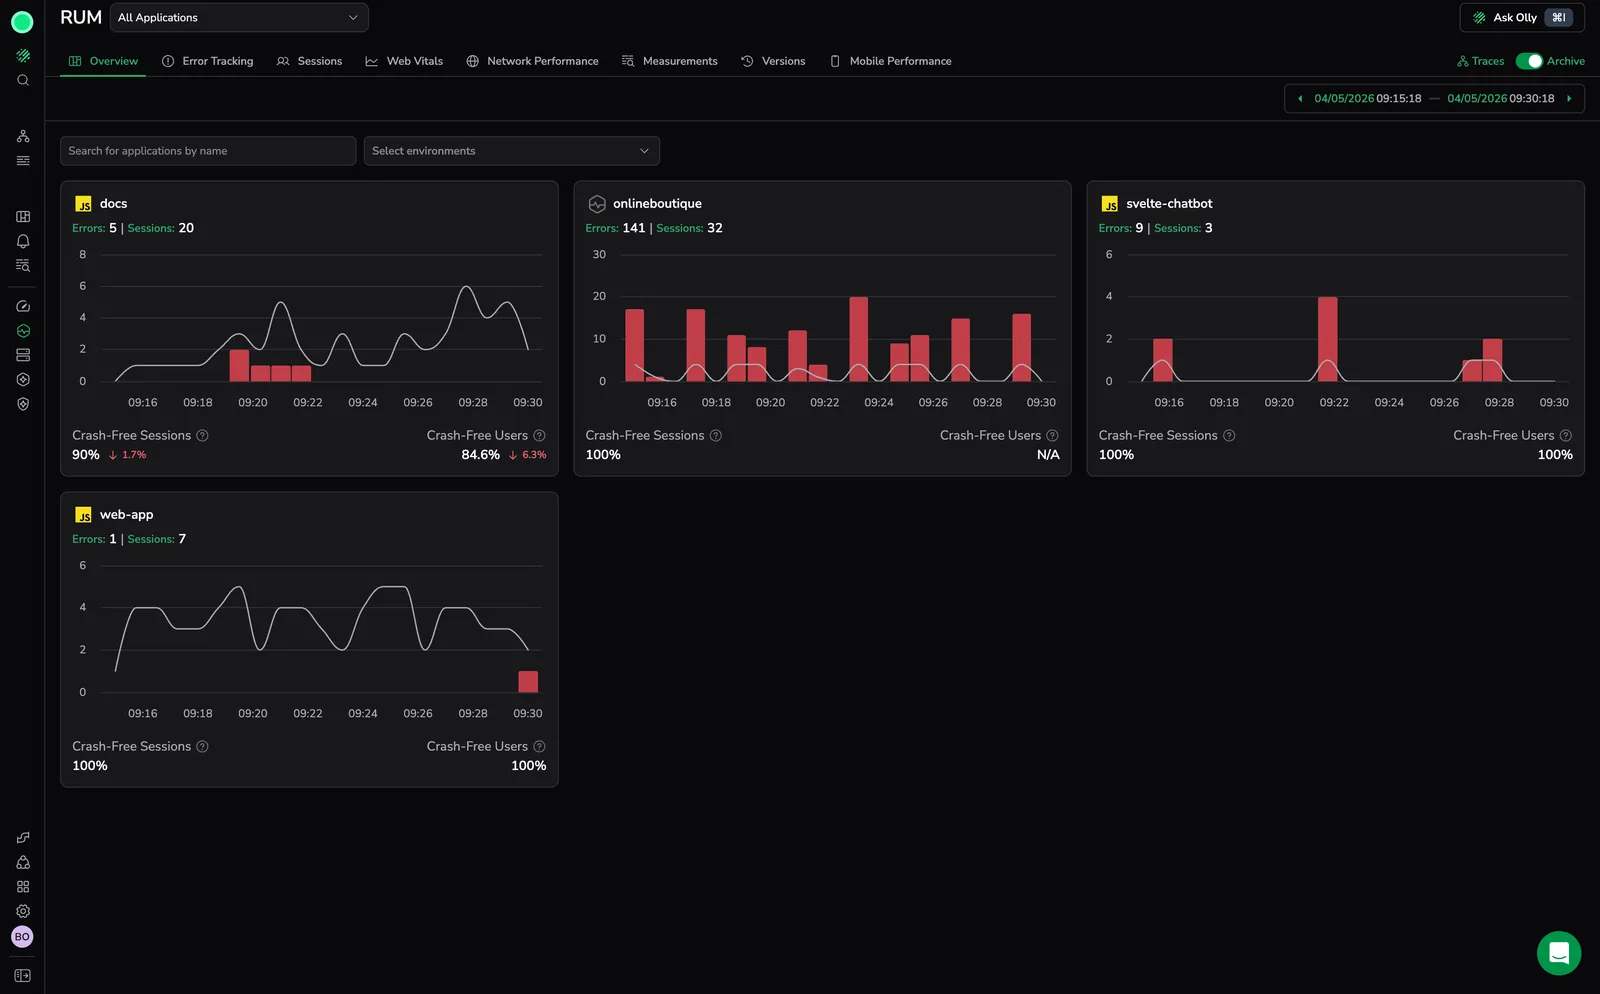
Displays one card per application, each summarizing errors, sessions, activity over time, and crash-free rates.
Read an application card
Each card represents one monitored application:
- Application name with a framework icon and an MFE chip for Micro-Frontend (MFE) apps.
- Errors — total error count for the selected period. Select the value to open Error Tracking pre-filtered to this app.
- Sessions — total session count for the selected period. Select the value to open User Sessions pre-filtered to this app. Hidden for MFE apps.
- Activity chart — combined errors-and-sessions time series for the period, with markers for Releases deployed during the window. Drag a range on the chart to zoom the page time range to the selected interval.
- Crash-Free Sessions — percentage of sessions that did not experience an unhandled exception (web) or native process crash (mobile) that broke the app. Hidden for MFE apps.
- Crash-Free Users — percentage of unique users that did not experience a crash during the period. Hidden for MFE apps.
Both crash-free metrics show a period-over-period delta arrow indicating whether the rate improved or worsened compared to the previous equivalent window.
When no monitored application has data for the selected period and filters, the page shows the empty state No Applications Found.
Drill down into an application
Select the application name on any card to open the app detail drawer. The drawer slides in over the Overview, so closing it returns you to the full fleet view. The drawer has its own time range picker and environment filter, allowing you to investigate one app without changing the Overview context behind it.
The drawer is organized into the following sections:
- Summary stats — Crash-Free Sessions, Crash-Free Users, Errors, Templates, and Sessions for the selected period, each with a period-over-period delta. Session, user, and crash-free metrics are hidden for MFE apps.
- Activity Over Time — combined errors-and-sessions chart with release markers. Drag to zoom into a specific incident window.
- Top Errors — table of the most frequent error templates in the period (template, error count, affected users), with a Go to Errors link to investigate further in Error Tracking.
- Performance overview — shown for browser and mobile apps (hidden for MFE apps):
- For mobile apps: Cold Start, Crashes, Application Not Responding (ANR) events, frames per second (FPS), and Loading Time, with a link to Mobile Performance.
- For browser apps: Largest Contentful Paint (LCP), First Contentful Paint (FCP), and Cumulative Layout Shift (CLS), each rated Good, Fair, or Poor against Web Vitals thresholds, with a link to Web Vitals.
- Latest Releases — table of the most recent releases for the application (app, version, release date), so you can correlate regressions with deploys.
The drawer URL includes the application identifier, so you can share a deep link that opens the same drilldown for another user.
How crash-free metrics are calculated
Crash-free metrics measure reliability for the selected period:
- Crash-Free Sessions — the share of sessions that did not include a crash event. On the web, a crash is an unhandled exception (such as a global JavaScript error) that effectively broke the application's functionality. On mobile, a crash is a native process crash.
- Crash-Free Users — the share of unique users whose sessions did not include a crash event during the period.
The trend indicator next to each value compares the rate to the immediately preceding window of the same length.
Limitations
- MFE apps display only error metrics. Sessions, users, and crash-free metrics are hidden because MFE apps do not own the host session.
- Time range, application search, and environment filters apply to the Overview cards. The drawer has its own time range picker that does not change the underlying Overview view.
Next steps
Investigate a specific error by opening the app drilldown and selecting an entry in Top Errors, which deep-links into Error Tracking.