User Measurements
Overview
Coralogix RUM collects and analyzes the Real User Monitoring data within Coralogix to track how users interact with your web applications in real time. This feature helps monitor performance, user behavior, and interaction patterns, providing valuable insights into the user experience (UX).
Benefits
- Real-time insights. Monitor how users experience your application in real-time, allowing you to quickly detect performance or functional issues. This is especially important for identifying high-impact issues in time-sensitive environments like e-commerce or financial services.
- Proactive issue resolution. Track JavaScript errors, slow page loads, and other user-impacting issues, enabling faster fixes.
- Improved user experience. Identify performance bottlenecks and resolve them to optimize the overall user experience. Understanding exactly how users experience your application allows you to make informed decisions to improve usability, speed, and overall engagement.
- End-to-end visibility: When integrated with APM, you can correlate frontend performance with backend metrics, providing a comprehensive view of your application.
Use cases
E-commerce. Track your customers' experience during the checkout process to identify any page load delays or errors that may be impacting conversions.
SaaS applications. Monitor user interactions within the app, monitor performance, and resolve frontend issues that impact user satisfaction.
Content websites. Track the loading speed of your content across different audiences and pinpoint areas for optimization.
Key user metrics
The following user metrics are available:
- Sessions - Number of user sessions.
- Page View - Number of pages the user visited.
- Action Count - Number of interactions that user performed.
- Errors - Total number of errors.
- Network Error Rate - Percentage of errored network requests.
- Page Error Rate - Percentage of errored page views.
- Session Error Rate - Percentage of errored sessions.
- Network Avg Duration - Average duration of a user session.
Monitor user metrics
View your RUM user metrics on the User Sessions page (RUM > User Sessions > Users).
On the Users page:
- Enter free text or use queries in the search bar to find users.
- Select the timeframe for which you want to view your user metrics.
- Filter the users.
- View the user and session counts.
- Use the main graph to analyze user metrics.
- View an overview of all users in the user grid, or focus on a specific user to see their complete details.
Filters
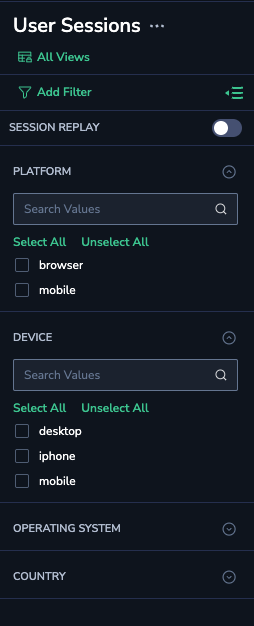
On the left-hand sidebar, you can filter your user metrics according to device platform, OS type, application, event/crash/exception type, etc.).
Main graph
The graph section presents detailed visualizations that break metrics data per each user, as illustrated below. In the graph section:
- Use the dropdown menus at the top left of the chart to select the desired metric (sessions, page views, actions count or errors) and choose whether you want to see the average, maximum, or minimum values.
- Hover over a particular segment to view data distribution for that specific time period.
- Use the chart legend to filter users. Select a user to display it or unselect it to hide. When hidden, the user data is removed from the view, but not from the underlying data. Choose Select all to display all users or unselect it to hide all of them.
User grid
The user grid provides a comprehensive overview of all users, displaying key metrics that reflect the performance of your user base.
Metrics
Each row of the grid represents an individual user, providing a detailed snapshot of its metrics. This view is especially valuable for in-depth analysis and troubleshooting of user experience, enabling developers to closely examine key aspects of each interaction.
Hover over the # column, and click the ellipsis (…) to display additional user-related metrics:
User details
Click on a user row in the grid to open a side panel with detailed information about the user. The data includes various user-related details, such as user ID, metadata, geolocation, device type, and more.
Support
Need help?
Our world-class customer success team is available 24/7 to walk you through your setup and answer any questions that may come up.
Feel free to reach out to us via our in-app chat or by sending us an email to [email protected].


