Design reliable SLOs
An SLO is a measurement system built from several moving parts: the target, time frame, SLI type, query shape, grouping, traffic volume, and alerting strategy all have to fit the service. When they don't, the SLO still produces numbers, they just stop meaning what you expect.
This guide explains how to design SLOs that stay stable and operationally useful, and how to recognize when an SLO is the wrong tool. It builds on Create Service Level Objectives, which covers the creation workflow itself.
Most surprising SLO behavior comes from a small set of causes:
- Too little data for the chosen target.
- Too many grouping permutations, which splits the data into tiny per-label SLOs.
- Sparse or intermittent time series.
- Rolling-window effects, where old good or bad data enters or leaves the window.
- Request spikes changing the denominator for event-based SLOs.
- Latency percentiles measured over too few requests.
- Alerting on an SLO that a direct metric, log, or trace alert would handle better.
Match the SLO type to the signal
Coralogix supports three SLO types. Start from the question you want the SLO to answer, then pick the type that fits.
| Question | Best SLO type |
|---|---|
| What percentage of requests succeeded? | APM or event-based |
| What percentage of requests were under a latency threshold? | Event-based, if histogram buckets or counts exist |
| Was latency or error rate below a threshold in most windows? | Time window-based |
| Did the batch job run successfully? | Usually a direct alert; an optional reporting SLO |
| Did expected traffic disappear? | A no-data or absence alert, not a request-ratio SLO |
For instrumented services already in APM, an APM SLO is the best default, Coralogix generates the underlying PromQL for you.
Understand what the error budget measures
Every SLO reduces to two counts: good (events or windows that met the objective) and total (all events or evaluated windows). Compliance is good / total, and the error budget is how much of the allowed badness you have consumed.
Two percentages describe the same SLO, and they are easy to confuse:
- Observed bad rate: bad events as a percentage of all events.
- Error budget used: how much of the allowed badness has been consumed.
For a 99% target over 10,000 requests with 52 failures:
- Allowed bad requests: 1% of 10,000 = 100
- Observed bad rate: 52 / 10,000 = 0.52%
- Error budget used: 52 / 100 = 52%
- Remaining error budget: 100% − 52% = 48%
So the accurate phrasing is: the service had a 0.52% observed error rate, which consumed 52% of the allowed error budget, leaving 48% remaining. Status follows the remaining budget, not raw compliance.
| Remaining error budget | Status |
|---|---|
| 75%–100% | OK |
| 25%–<75% | Warning |
| >0%–<25% | Critical |
| 0% | Breached |
A key consequence: a 99% SLO running at exactly 99% compliance has used all of its error budget. It sits at the floor, not in a healthy state. For the full calculation walkthrough per SLO type, see SLO calculation example.
Give the SLO enough data
Low traffic is the most common reason an SLO looks wrong. Because compliance is good / total, the smallest non-zero error rate an SLO can represent is 1 / total. When that is larger than the error budget, a single bad event breaches the SLO.
For a 99% SLO with 50 requests in the window and one failure:
- Allowed bad requests: 1% of 50 = 0.5
- Actual bad requests: 1
- Error budget used: 1 / 0.5 = 200%
- Remaining error budget: 0%, breached
This does not mean the calculation is wrong. It means the target is too strict for the available data.
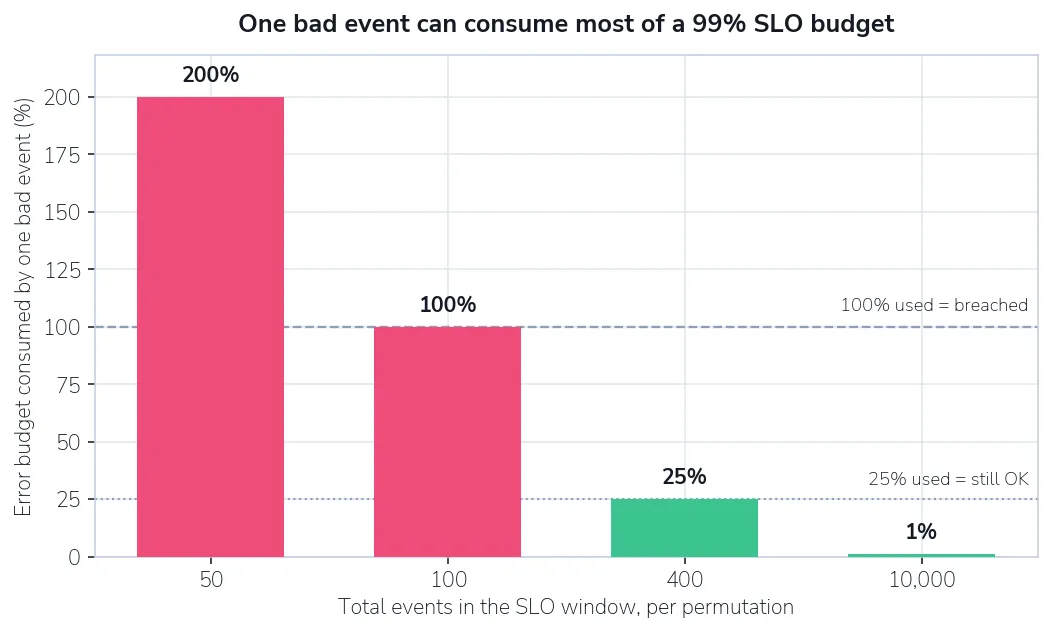
Shows how much of a 99% error budget a single bad event consumes as total volume grows. Target choice must follow volume.
To survive one bad event without breaching, you need total_events_in_window > 1 / (1 - target). To stay OK after one bad event, you need total_events_in_window >= 1 / (0.25 × (1 - target)), because OK requires at least 75% of the budget remaining.
| Target | Error budget | Events to survive 1 bad event | Events to stay OK after 1 bad event |
|---|---|---|---|
| 95% | 5% | >20 | ≥80 |
| 99% | 1% | >100 | ≥400 |
| 99.9% | 0.1% | >1,000 | ≥4,000 |
| 99.99% | 0.01% | >10,000 | ≥40,000 |
These numbers are per SLO window and per permutation. If an SLO groups by service, route, and region, run the volume check for each resulting combination, not for the whole service.
Use the volume per permutation to decide whether an SLO is even the right tool:
| Volume per permutation per window | Create an SLO? | SLO alerting | Direct alerting |
|---|---|---|---|
| 0 events | No useful request-ratio SLO. No data is not proof of health. | Do not use SLO alerts. | Use a no-data, absence, or heartbeat alert if traffic is expected. |
| 1–99 events | Usually no, unless it is clearly reporting-only. One event can dominate the budget. | Avoid. | Use direct alerts for specific failures. |
| 100–399 events | Maybe, with a loose target and minimal grouping. 99% can still breach from a few errors. | Prefer only an Error budget alert, if any. | Use direct alerts for urgent failures. |
| 400–3,999 events | Yes for 99% if the SLI is clear. Usually not enough for 99.9%. | Error budget alerts are reasonable; Burn rate alerts only after testing. | Keep direct alerts for hard outages and no-data. |
| 4,000–39,999 events | Yes. 99.9% can be meaningful if behavior supports it. | Error budget and Burn rate alerts can work if the signal is stable. | Still needed for immediate failures. |
| 40,000+ events | Yes. Higher targets can be reasonable. | SLO-based alerting is usually viable, if grouping is controlled. | Use for hard failures, saturation, absence, and runbook-triggering conditions. |
Control grouping
Grouping creates one independently evaluated permutation per label-value combination. That is useful when ownership and behavior genuinely differ, but it also splits the data. A service with 100,000 requests over 28 days averages 1,000 requests per route across 100 routes, and only 200 requests per permutation once you add five regions. A service-level 99.9% SLO that looks safe at 100,000 requests can become meaningless split across 500 permutations.
To keep grouping healthy:
- Group only by bounded, low-cardinality labels.
service,environment,region, a controlled endpoint group, or team. - Avoid high-cardinality labels, raw URL, user ID, customer ID, request ID, pod UID, or trace ID.
- Split a high-value tenant into its own filtered SLO rather than one large grouped SLO.
- Keep the expected permutation count well under the SLO permutation limit.
Ownership tags assign Service, Environment, and Team to permutations, but they do not create permutations. The query grouping does. See Tag SLO permutations with ownership.
Expect the budget to move with the rolling window
SLOs evaluate over a rolling window of 7, 14, 21, 28, or 90 days. Every evaluation point answers one question: how good was the service over the previous full window from this moment? The window is always forgetting old data and adding newer data, which can look surprising when you expect the budget to move only during a new incident.
Error budget recovery is when the remaining budget rises because old bad events or bad windows have aged out of the window. It does not mean the service improved at that moment.
Example: old good traffic ages out
This example uses a 28-day event-based SLO over a 50-day timeline. A large traffic spike of mostly-good requests arrives first, followed later by a small burst of 40 bad requests. While the spike is still inside the rolling window, the bad burst is diluted by a large denominator. Once the spike ages out, the same 40 bad requests divide into a much smaller denominator and consume far more of the budget.
At day 22, the shaded window still includes the earlier traffic spike, so the 40 bad requests are diluted by a large denominator and 74.8% of the budget remains.
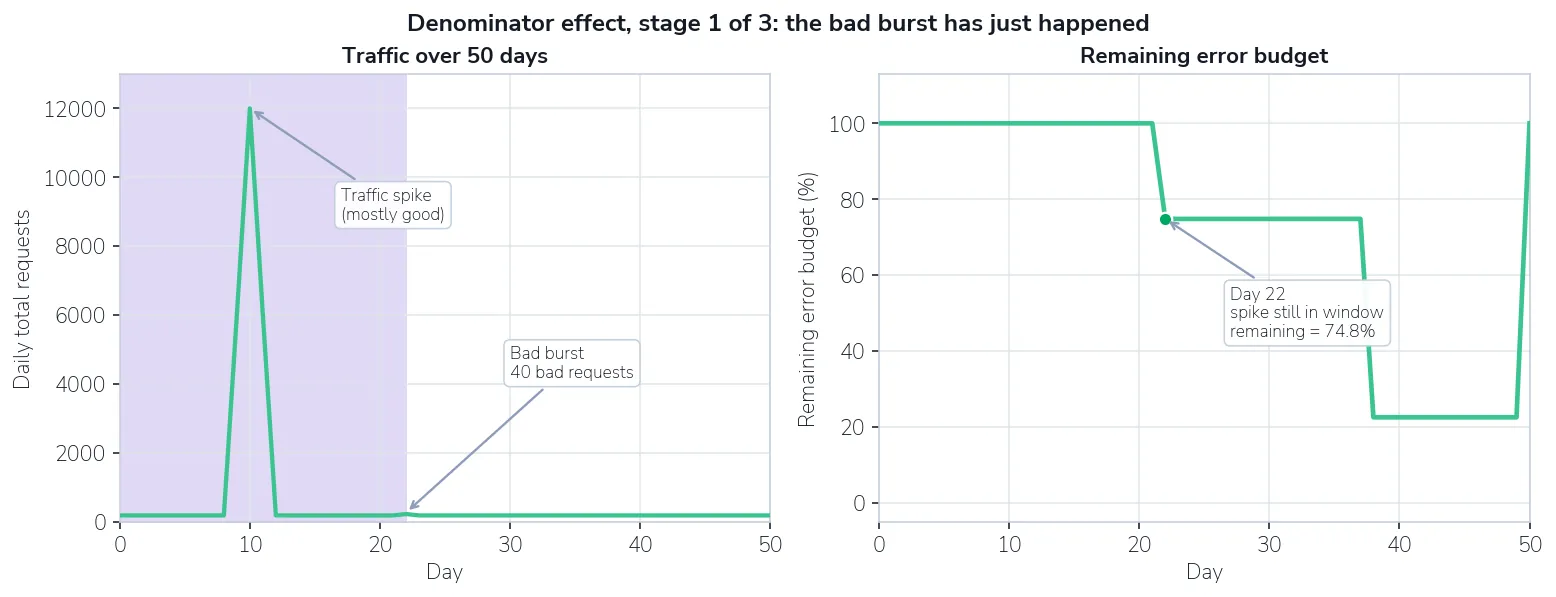
Shows the window still covering the traffic spike when the bad burst lands.
By day 49, the traffic spike has aged out of the window, but the bad burst is still inside it. The denominator is now much smaller, so the same bad requests consume far more of the budget, 22.5% remains.
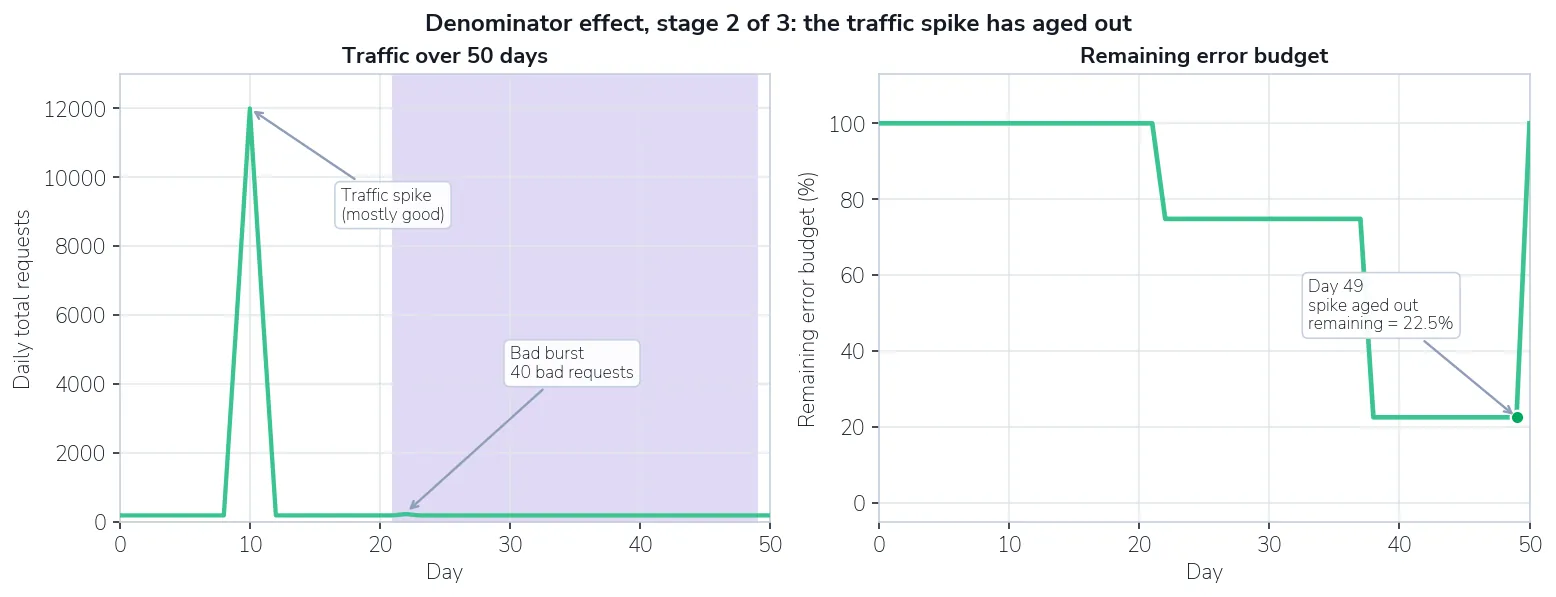
Shows the spike aged out while the bad burst remains inside the window.
By day 50, the bad burst ages out too. It no longer counts, so the remaining budget recovers to 100%.
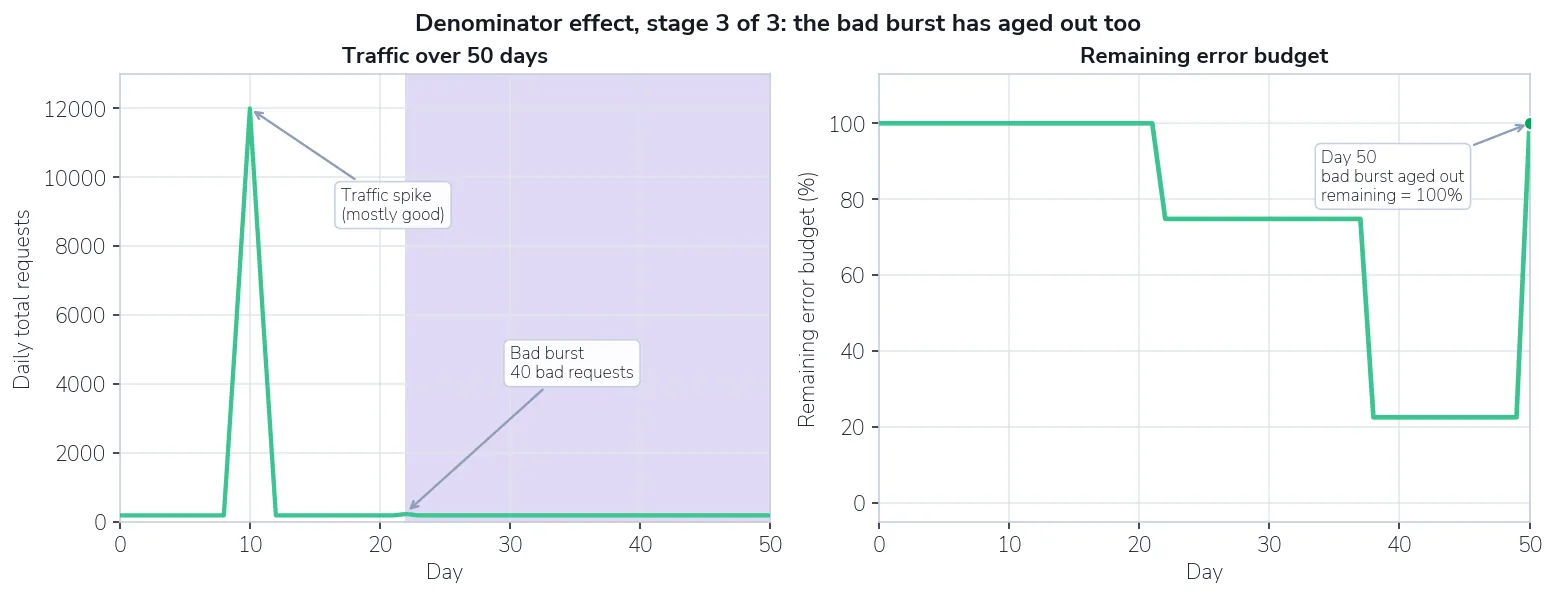
Shows the bad burst aged out of the window.
Example: an incident ages out and the budget recovers
This example also uses a 28-day event-based SLO over a 50-day timeline. A bad-event spike happens and stays inside the rolling window for a while. Once it falls outside the window, the SLO stops counting it and the remaining budget jumps back up, that jump is error budget recovery.
At day 13, the incident spike is fully inside the current window, so it counts against the SLO and pushes the remaining budget down to 7.7%.
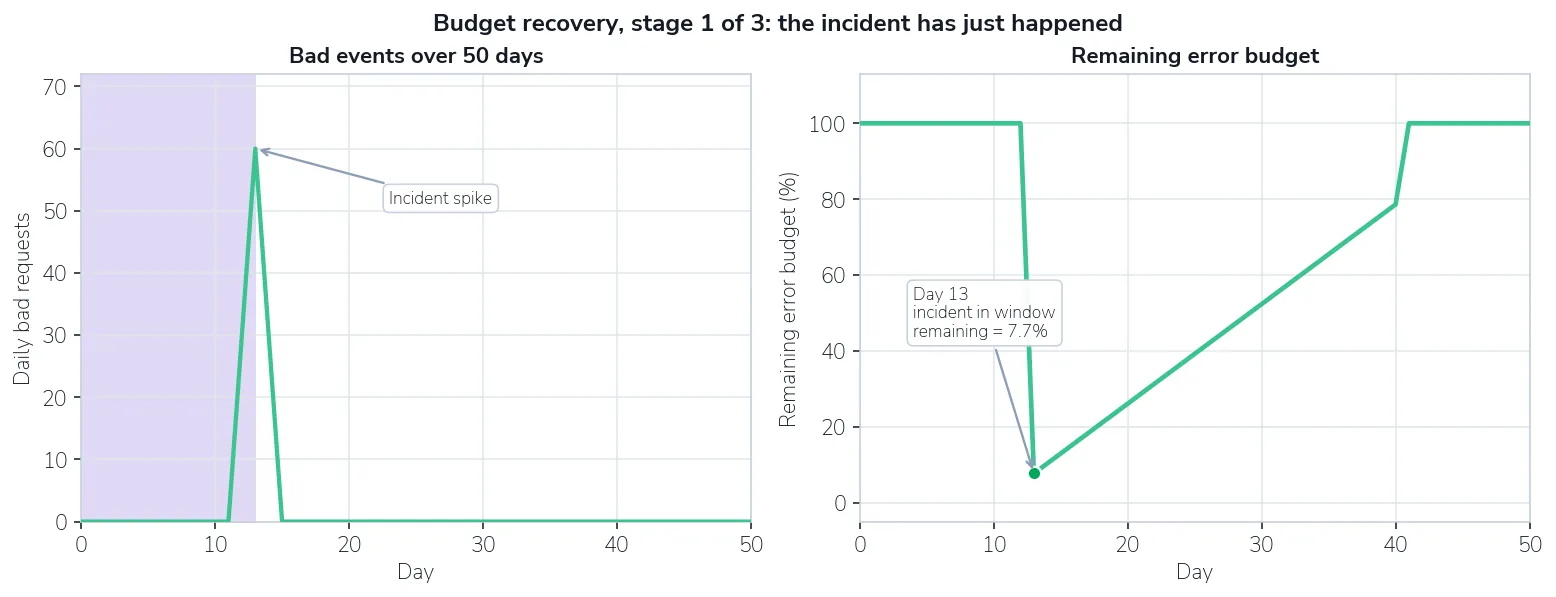
Shows the incident spike fully inside the current window.
By day 40, the incident sits at the left edge of the window. It is old, but it still counts, so the budget has only partly recovered to 78.6%.
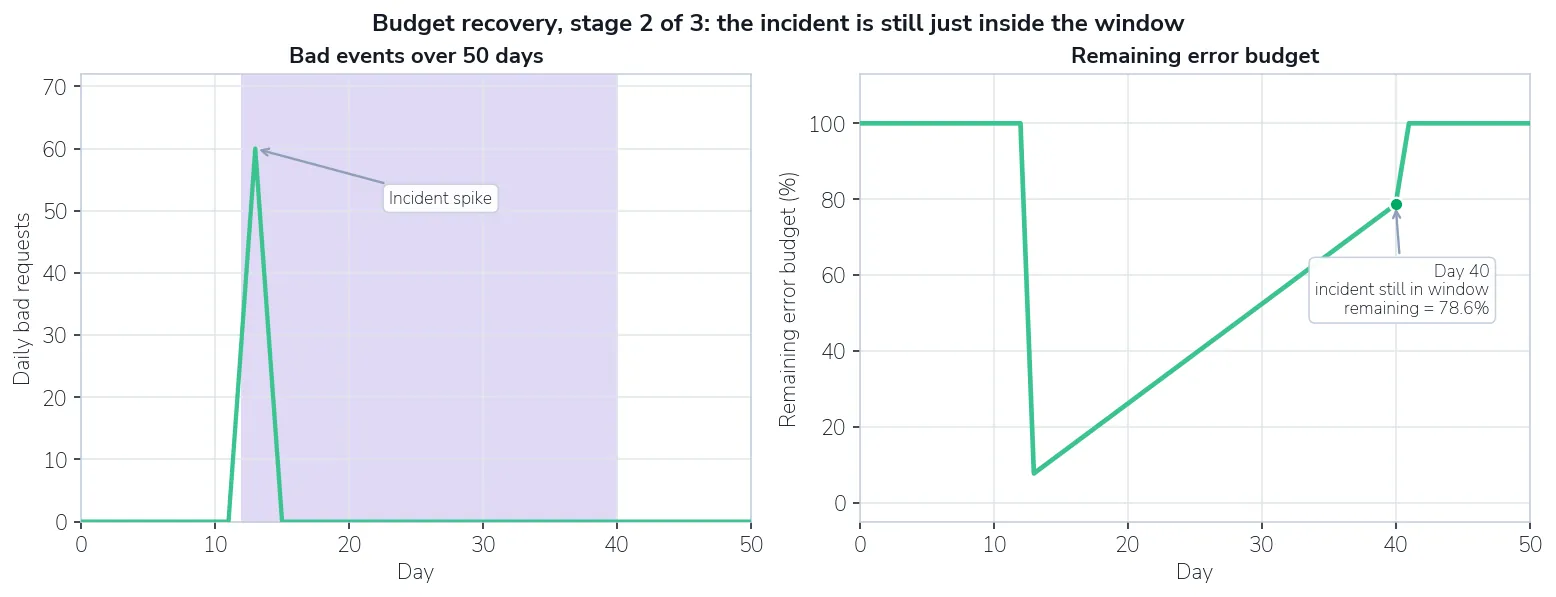
Shows the incident spike at the left edge of the window.
By day 41, the incident has moved outside the window. It no longer counts, so the remaining budget jumps back to 100%. That jump is error budget recovery.
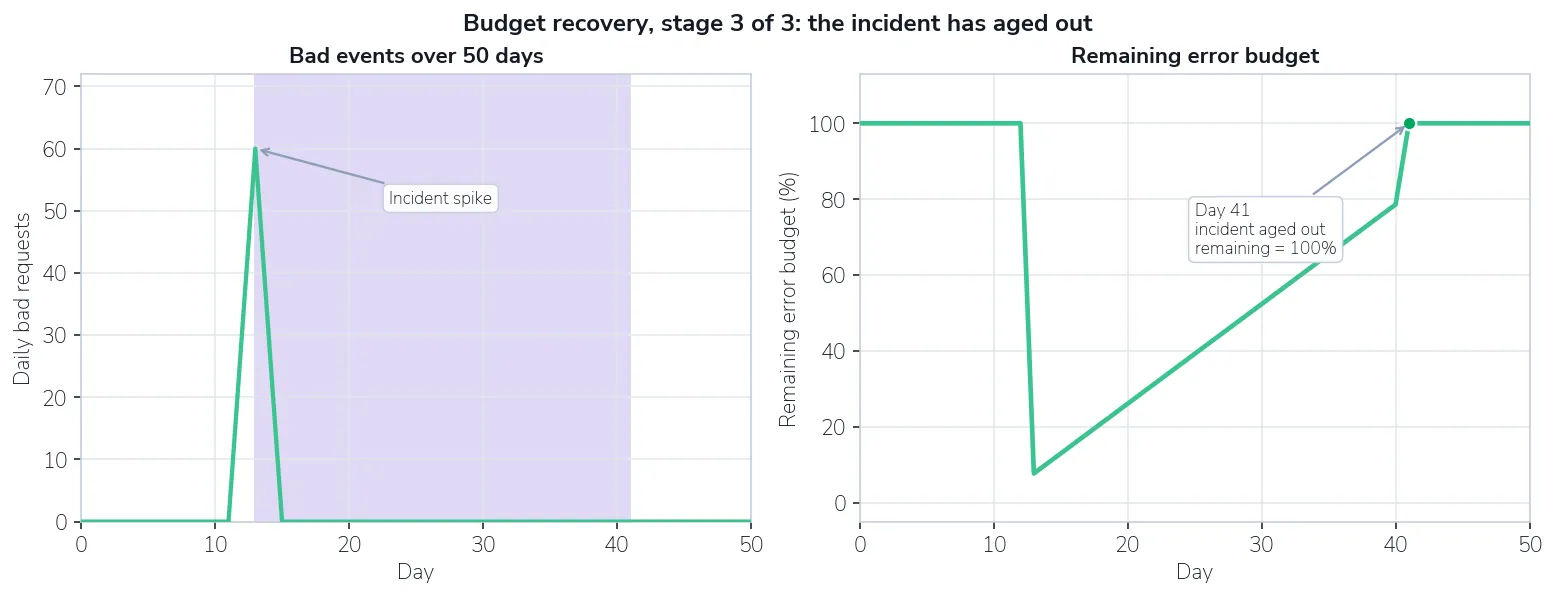
Shows the incident spike aged out of the window.
Time window-based SLOs count a bounded set of windows
Time window-based SLOs count windows rather than individual requests, so the rolling window holds a fixed number of slots. With 5-minute windows, a 7-day SLO has 7 × 24 × 12 = 2,016 windows and a 28-day SLO has 28 × 24 × 12 = 8,064. The query, operator, and threshold mark each window good or bad.
Because a busy 5-minute window and a quiet one each count once, a traffic spike adds no extra weight. This usually makes the denominator effect smaller and easier to reason about than an event-based SLO, where a spike can add thousands of events to the denominator. Time window-based SLOs can still move sharply when:
- A cluster of bad windows enters the rolling window.
- A cluster of bad windows leaves the rolling window.
- Missing-data handling changes which windows are counted.
- Very few windows are evaluated because the service is sparse.
What to check when the budget moves unexpectedly
When the budget moves and no new incident happened, check the inputs before assuming the SLO is wrong:
- For event-based SLOs, did the denominator change because old good traffic entered or left the window?
- For event-based SLOs, did an old incident finally age out?
- For time window-based SLOs, did a cluster of good or bad windows enter or leave the window?
- Did grouping split the traffic so much that one small burst now has a large effect?
- Did missing data or ingestion delays change which events or windows were counted?
Pair SLOs with direct alerts for real-time detection. An SLO explains reliability over the window; it does not always explain what is broken right now.
Build the query before you choose the target
A good SLO starts with a good query, not with a target. Work through these steps in order.
- Define the user-impact question. Good questions read like "what percentage of checkout requests completed below 500 ms?" If the question is "is it broken right now?", use a direct alert instead.
- Choose the SLO type using the table in Match the SLO type to the signal.
- Build the total query first. Total is the population you are judging, all customer-facing requests, all checkout requests, all runs of a job. Exclude health checks, internal retries, synthetic load, and traffic outside the reliability promise.
- Build the good query as a subset of total. Good must be the same population plus the success condition. Comparing good
/apirequests against total requests for every route understates compliance and is hard to explain. - Use
increase()for event-based counts, notrate().rate(counter[1m])returns events per second, which is a throughput signal rather than a count. For event-based SLOs,goodandtotalshould be event counts so52 bad requests out of 10,000stays meaningful. Reserverate()for dashboards, throughput alerts, or time window-based SLOs that explicitly evaluate a per-second rate. - Match the grouping. If good groups
by (service, route), total must groupby (service, route)too. Mismatched grouping produces one series per service+route on one side and one series per service on the other. - Check the query shape with the list below.
- Validate volume before the target. Confirm the data can support the target instead of choosing 99.9% and hoping.
A well-formed event-based pair looks like this:
# Good: non-5xx checkout requests
sum(increase(http_requests_total{service="checkout", route!="/healthz", status!~"5.."}[1m])) by (service)

# Total: all checkout requests in the same population
sum(increase(http_requests_total{service="checkout", route!="/healthz"}[1m])) by (service)
Before creating the SLO, confirm:
- Good is a subset of total.
- Good and total use the same filters except for the success condition.
- Good and total use the same grouping labels.
- Event-based queries use a
[1m]range vector. - Values cannot go negative, and the query aggregates rather than returning too many series.
- Derived metrics from Recording Rules or Events2Metrics have enough offset or delay.
- Preview values make sense, and good never exceeds total.
For more query patterns, see Query examples and Preview and validate SLOs.
Design event-based SLOs
Event-based SLOs are usually the safest choice for request success and error-rate objectives. Use them when you can count good and total events, the success condition is request-level, volume per permutation is high enough, and you want reliability accounting over the SLO window. Be careful when the metric is sparse, the scrape interval is close to the 1-minute range, the source has gaps, grouping splits the data too much, or the service is intermittent.
An availability SLO counts non-5xx responses against all responses:
# Good: non-5xx requests
sum(increase(http_requests_total{service="checkout", status!~"5.."}[1m])) by (service)

# Total: all requests in the same population
sum(increase(http_requests_total{service="checkout"}[1m])) by (service)
For latency, an event-based SLO built on histogram buckets is often more stable than a per-window percentile. Counting requests under a threshold answers "what percentage of requests completed within 300 ms?" rather than "was the p99 below 300 ms in this one window?":
# Good: requests <= 300ms
sum(increase(http_request_duration_seconds_bucket{service="checkout", le="0.3"}[1m])) by (service)

# Total: all observed requests
sum(increase(http_request_duration_seconds_count{service="checkout"}[1m])) by (service)
Design time window-based SLOs
Time window-based SLOs evaluate a condition for each 1- or 5-minute window and mark each window good or bad. They fit sustained-behavior objectives, p95 latency staying below a threshold in most windows, error rate staying low, queue depth or saturation not remaining high for too long. They are risky for very sparse traffic, p99 latency on low request counts, 1-minute windows on bursty traffic, or missing-data handling that isn't thought through.
Time controls the denominator, so a traffic spike does not add SLO weight. A busy 5-minute window and a quiet one each count as exactly one window.
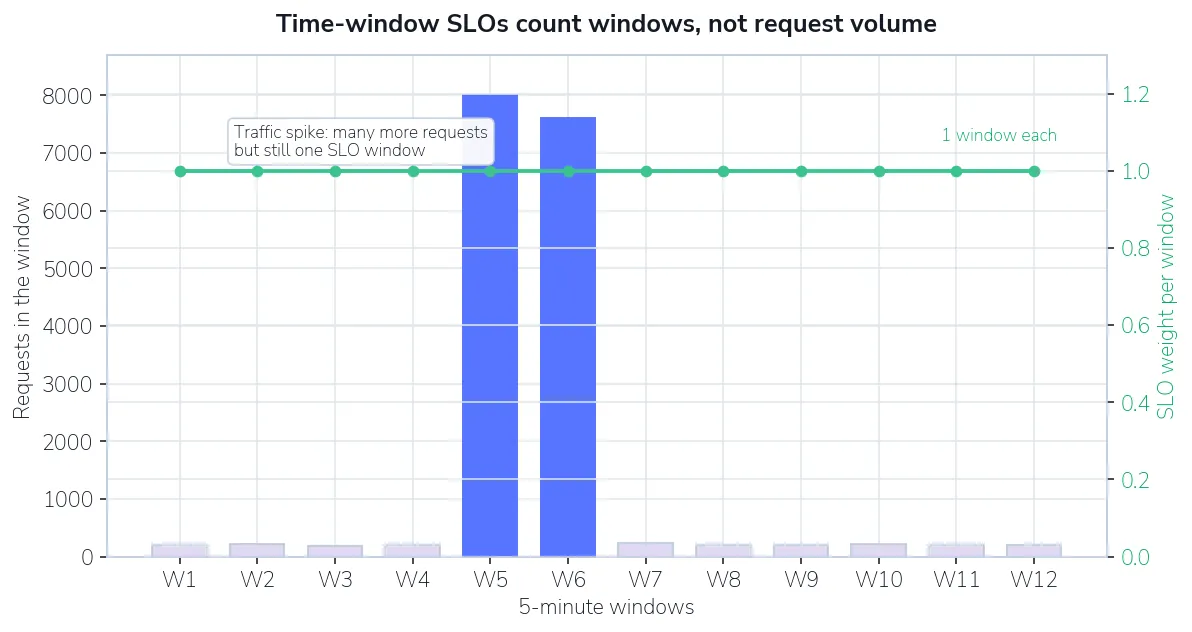
Shows that a busy window and a quiet window carry equal SLO weight, which reduces the traffic-spike denominator effect that event-based SLOs can have.
Two design rules keep time window-based SLOs stable:
- Prefer 5-minute windows for sparse data. A 1-minute window can be too noisy; 5 minutes gives more samples per decision.
- Give percentiles enough samples. A p99 over three requests is essentially "one of those three requests." For sparse latency, prefer average, p90, or p95; use 5-minute windows; base the threshold on observed data; or model latency as event-based requests-under-threshold when histogram buckets exist.
Decide what missing data means for each SLO, do not leave it as an afterthought:
| Missing data counts as | When it fits | Risk |
|---|---|---|
| Uncounted | Bursty services where no traffic should neither help nor hurt | Few windows scored, increasing variance |
| Good | A metric that only emits during failures, or where no traffic is acceptable | Can hide real outages if absence is actually bad |
| Bad | Heartbeats or jobs that must report continuously | Can punish normal idle periods |
Handle no-data, idle, and intermittent services
No data is not the same as healthy. A request-ratio SLO can only evaluate requests that exist, if a service receives no requests, there are no bad requests to count, but that proves nothing about availability. Match the signal to the case:
| Case | Better signal |
|---|---|
| Service must receive regular traffic | Alert when request volume drops below the expected baseline |
| Heartbeat endpoint must be called | Absence or no-data alert |
| Batch job must run hourly or daily | Alert when there is no successful run by the expected time |
| Service has intermittent customer traffic | SLO for reporting, direct alerts for hard failures |
| SLO query has gaps | Fix instrumentation, or avoid SLO-based paging for that permutation |
For intermittent permutations, budget movement can be misleading, because the SLO lacks enough continuous data to produce a stable signal.
Choose the right alert
A healthy reliability setup usually pairs SLOs for accountability with direct alerts for immediate detection. Coralogix offers two SLO alert conditions plus standard alerts:
| Alert | Answers | Best for | Avoid when |
|---|---|---|---|
| Error budget | How much budget is left? | Slow-moving reliability risk; warning before breach | The SLO is new, sparse, or not trusted yet |
| Burn rate | How fast is the budget being spent? | High-volume SLOs where a sharp drop signals real degradation | Low-volume, bursty, sparse, or noisy SLOs |
| Direct metric, log, or trace alert | Is something broken right now? | Immediate action, high 5xx rate, high latency, failed job, missing heartbeat, saturation | Long-term reliability reporting |
An Error budget alert is the safest SLO alert for low- and medium-volume SLOs, because it does not assume short-term movement is always meaningful. A Burn rate alert catches a sharp drop over a lookback, so use it only when the SLO has enough volume for the drop to mean something. Before enabling one, inspect historical behavior and ask whether it would have fired only on incidents you actually wanted to act on.
Use this matrix to avoid turning every reliability question into the same alert:
| Need | Best answer |
|---|---|
| Measure long-term reliability | Create an SLO |
| Alert when budget is nearly gone | Error budget alert |
| Alert when budget drops sharply | Burn rate alert, for high-volume, stable SLOs |
| Page on a hard outage | Direct metric, log, or trace alert |
| Page on one critical job failure | Direct job-failure alert; optionally keep an SLO for reporting |
| Detect no traffic or a missing heartbeat | No-data or absence alert |
| Report reliability to customers or teams | Create an SLO and report compliance and error budget |
Do not page from a low-volume SLO just because it is an SLO. If one event can dominate the budget, keep the SLO for reporting and page from a direct, concrete failure signal instead.
Let the SLO warm up before you trust it
Data collection for an SLO's metric begins at creation, and initial calculations cover only data from that point onward. Once the SLO is older than its time frame, it evaluates a full rolling window. So a new SLO is not a reliable 7/14/21/28/90-day statement until one complete window has elapsed, and editing an SLO can reset historical evaluation for the previous configuration.
We recommend this sequence:
- Preview and validate the SLO.
- Create it without paging alerts, unless the signal is already proven.
- Let it run for a full window.
- Review volume, bad events, grouping, and budget behavior.
- Add alerts once the SLO behaves as expected.
Pre-flight checklist
Run through these checks before creating an SLO.
SLO type
- For an APM service, an APM SLO was considered before custom PromQL.
- Request success or error rate is modeled as event-based where possible.
- Latency is modeled as either request-level success rate or pass/fail windows, deliberately.
- For batch, heartbeat, or no-traffic cases, an SLO is actually the right tool.
Query correctness
- Good events are a subset of total events.
- Good and total use the same filters except for the success condition.
- Good and total use the same grouping labels.
- Event-based queries use the required
[1m]range. - Event-based counter SLOs use
increase(counter[1m]), notrate(counter[1m]). - Values cannot go negative, and the query aggregates.
- Derived metrics have enough offset or delay.
- Preview shows the expected good/total or metric/status values, and good never exceeds total.
Volume and target
- Total events or windows are high enough for the chosen target.
- The volume check was done per permutation.
- The target is the loosest target that is still meaningful.
- A single bad event will not unexpectedly breach the SLO, unless that is intentional.
Grouping and ownership
- Grouping labels are bounded and low-cardinality.
- Expected permutations are well under the limit.
- High-value tenants or routes are split into separate filtered SLOs if needed.
- Ownership tags give each permutation a clear Service, Environment, and Team.
Window and warm-up
- The window is one of 7, 14, 21, 28, or 90 days and long enough for the traffic pattern.
- Low-volume services use the longest acceptable window.
- The team knows the SLO is not trustworthy until one full window has elapsed, and that edits reset historical comparisons.
Alerting
- Error budget alerts cover low-volume or slow-moving risk.
- Burn rate alerts are used only for stable, high-volume SLOs.
- Direct alerts cover hard failures, absence, job failures, and urgent conditions.
- Alerts were tested against historical behavior before paging.
Troubleshoot unexpected SLO behavior
| Symptom | Likely cause | Fix |
|---|---|---|
| One error breached the SLO | Too little data for the target | Loosen the target, lengthen the window, reduce grouping, or use direct alerting |
| SLO looks fine at service level but one route breached | Grouping split the traffic | Remove grouping, group by endpoint class, or create filtered SLOs for important routes |
| Green summary but no useful drilldown | No data or an idle permutation | Add a traffic or absence alert if no data should count as bad |
| Compliance keeps changing after creation | The SLO window is still warming up | Wait one full window |
| SLO reset after an edit | New configuration | Expected. Avoid editing while evaluating |
| Error budget dropped with no new incident | Rolling-window denominator changed, or old good traffic aged out | Explain the rolling-window effect; lengthen the window if needed |
| Error budget suddenly recovered | An old incident or bad windows aged out of the window | Expected rolling-window recovery |
| Burn rate alert flaps | Low volume, sparse data, or too short a lookback | Use an Error budget alert or a direct alert |
| p99 latency SLO jumps around | Too few requests per window | Use p95 or average, 5-minute windows, an event-based histogram SLO, or a direct alert |
| Good events exceed total events | The good query is not a subset of total | Align the good and total query logic |
| Cardinality or permutation error | Too many groups | Reduce grouping, filter, or split SLOs |
| Query passes elsewhere but SLO creation fails | Coralogix SLO query restrictions | Adjust the query to an SLO-compatible shape. See Query validation |
SLO says "requests" but uses rate() | The query returns a per-second rate, not a count | Use increase(counter[1m]) for event-based request-count SLOs |
When an SLO behaves unexpectedly, start from this: the SLO is probably measuring a signal that is too sparse, too strictly targeted, too heavily grouped, or not suited to SLO-based alerting. The fix is usually one of, loosen the target, lengthen the window, reduce grouping, switch SLO type, fix missing or inconsistent data, use a direct alert, separate high-volume services from intermittent ones, or switch event-based queries to count semantics. A good SLO is boring most of the time; when it surprises people, treat that as feedback on its design.
Recommended defaults
For most customer-facing services:
| Setting | Default |
|---|---|
| SLO type | APM or event-based |
| Target | 99% initially; tighten only after observing real data |
| Window | 28 days for reporting; shorter windows only when justified |
| Grouping | Service, environment, region, or a controlled route class |
| Query shape | increase(counter[1m]) for event-based counts |
| Alerting | Error budget plus direct alerts; Burn rate alerts only when high-volume and stable |
| Latency | p95 or request-under-threshold; avoid p99 unless high-volume |
| Warm-up | Wait one full window before trusting or reporting |
For low-traffic services, prefer event-based SLOs if possible, otherwise keep them reporting-only. Use a 95% or 99% target, the longest acceptable window, minimal or no grouping, and average or p95 latency. Avoid Burn rate alerts, use direct alerts for immediate action, and use an absence alert when traffic is expected.
For batch jobs, page from direct signals (job failed, no successful run by the expected time, or duration exceeded) and keep any SLO for reporting only, such as the percentage of scheduled runs that succeeded. Avoid sparse time window-based latency SLOs and Burn rate paging.