Create Service Level Objectives
Service Level Objectives (SLOs) measure how reliably your services meet their targets. Coralogix supports three SLO types so you can match the SLO to the signal you actually want to track. Pick one, share the same creation workflow, and only diverge where the configuration genuinely differs.
Go to APM → SLO Center → + Create SLO and follow the steps in this guide.
Pick your SLO type
| Type | Best for | SLI mechanism | Query style |
|---|---|---|---|
| APM | Service-level errors and latency on instrumented services | Built-in: errors over total events, percentile or average latency against a threshold | Pick a service and filters; Coralogix generates the PromQL |
| Event-based | Reliability as a ratio of successful events to total events | good / total over the SLO time frame | Two PromQL queries |
| Time window-based | Pass/fail per fixed interval, useful for sustained-latency targets | Count of windows that meet a threshold over total windows | One PromQL query plus operator and threshold |
What you need
The metric you want to measure sent to Coralogix, either directly, or derived from logs and spans with Event2Metrics.
Step 1: Define the SLO
In the Coralogix portal, go to APM, then SLO Center, and select + Create SLO.
Fill in the SLO details:
| Field | Description |
|---|---|
| Name | The unique name identifying your SLO. |
| Owner | The user responsible for maintaining and reviewing the SLO. Ownership defaults to the creator, but can be reassigned to any Coralogix team member. |
| Entity labels | (Optional) Metadata used for filtering SLOs. |
| Description | (Optional) Additional context or purpose of the SLO to clarify its scope and intent for other users. |
Step 2: Select the SLO type
Under SLO type, pick APM, Custom → Event-based, or Custom → Time window-based. If you pick APM, you then choose whether to track Errors or Latency.

Step 3: Configure the SLO
Select your SLO type to see its configuration steps. The remaining steps are shared across all types.
- APM - Errors
- APM - Latency
- Custom - Event-based
- Custom - Time window-based
APM SLOs let you define reliability for a service without writing PromQL. Track a service's error rate against a target.
-
Select a service to associate with the SLO.
-
Apply Filters: narrow the scope of the SLO using label selections.
-
Pick a Grouping Key: select one or more labels to split the SLO into permutations (for example,
service_name,route). Each unique combination of label values becomes its own permutation, tracked independently. Available labels come from the selected service. -
Define the time frame and target success rate in Step 4: Set the target and time frame.
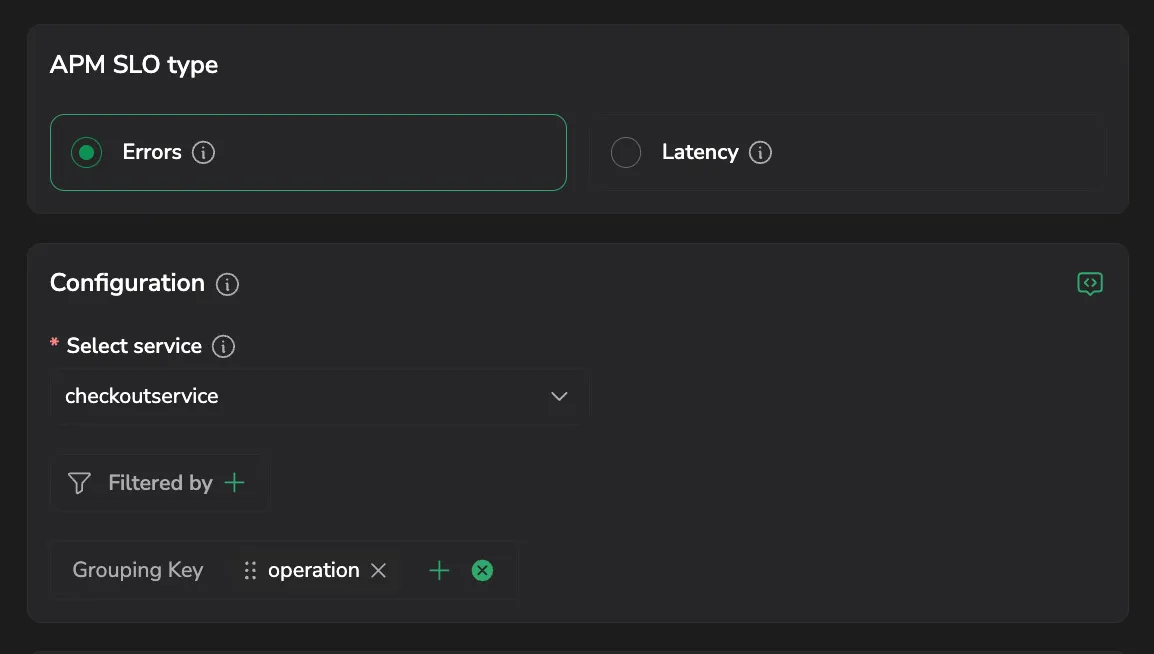
- Filters can be adjusted through the builder.
- To preview the underlying PromQL query that Coralogix generates from your APM SLO configuration, select the Show query icon in the top-right of the Configuration section. The query updates as you change the configuration.
APM SLOs let you define reliability for a service without writing PromQL. Track a service's latency against a threshold.
-
Select a service to associate with the SLO.
-
Apply Filters: narrow the scope of the SLO using label selections.
-
Pick a Grouping Key: select one or more labels to split the SLO into permutations (for example,
service_name,route). Each unique combination of label values becomes its own permutation, tracked independently. Available labels come from the selected service. -
Set up a time window to evaluate performance in fixed intervals of 1 or 5 minutes.
-
Select the aggregation method for latency:
- Average: average latency per time window. Smooths spikes to show overall performance.
- Percentile: tail-latency view: captures the slowest requests and their impact on user experience. Enter the percentile value (for example, P90, P95).
-
Define the Query threshold: pick the operator (for example,
<,≥), the threshold value (for example,30), and the unit (μs, ms, or s) required in each time window.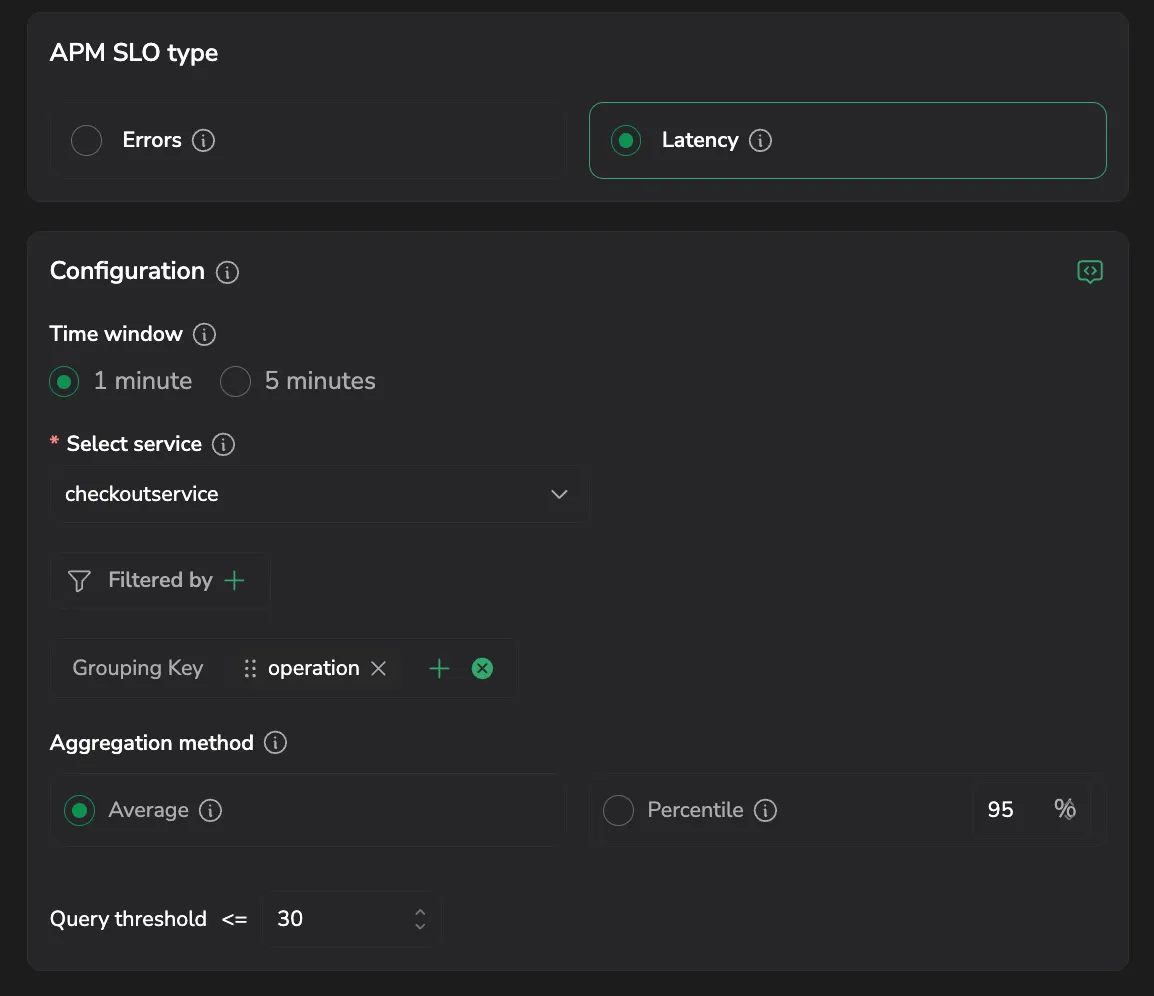
- Filters can be adjusted through the builder.
- To preview the underlying PromQL query that Coralogix generates from your APM SLO configuration, select the Show query icon in the top-right of the Configuration section. The query updates as you change the configuration.
Event-based SLOs measure reliability as the ratio of successful (good) events to total events.
Define two PromQL queries:
- Good events: the numerator. Counts events that meet your success criteria (for example, HTTP responses with
200or204, transactions completed in under 2 seconds). - Total events: the denominator. Counts the full population of events the SLO measures (for example, all requests to a given service endpoint, transactions excluding health checks).
Both the good events and total events queries must use a 1-minute range vector ([1m]), for example sum(increase(calls_total[1m])) by (service_name). Any other range, such as [5m], returns a 400 Bad Request. The fixed 1-minute range keeps time-window evaluation consistent across the SLO.
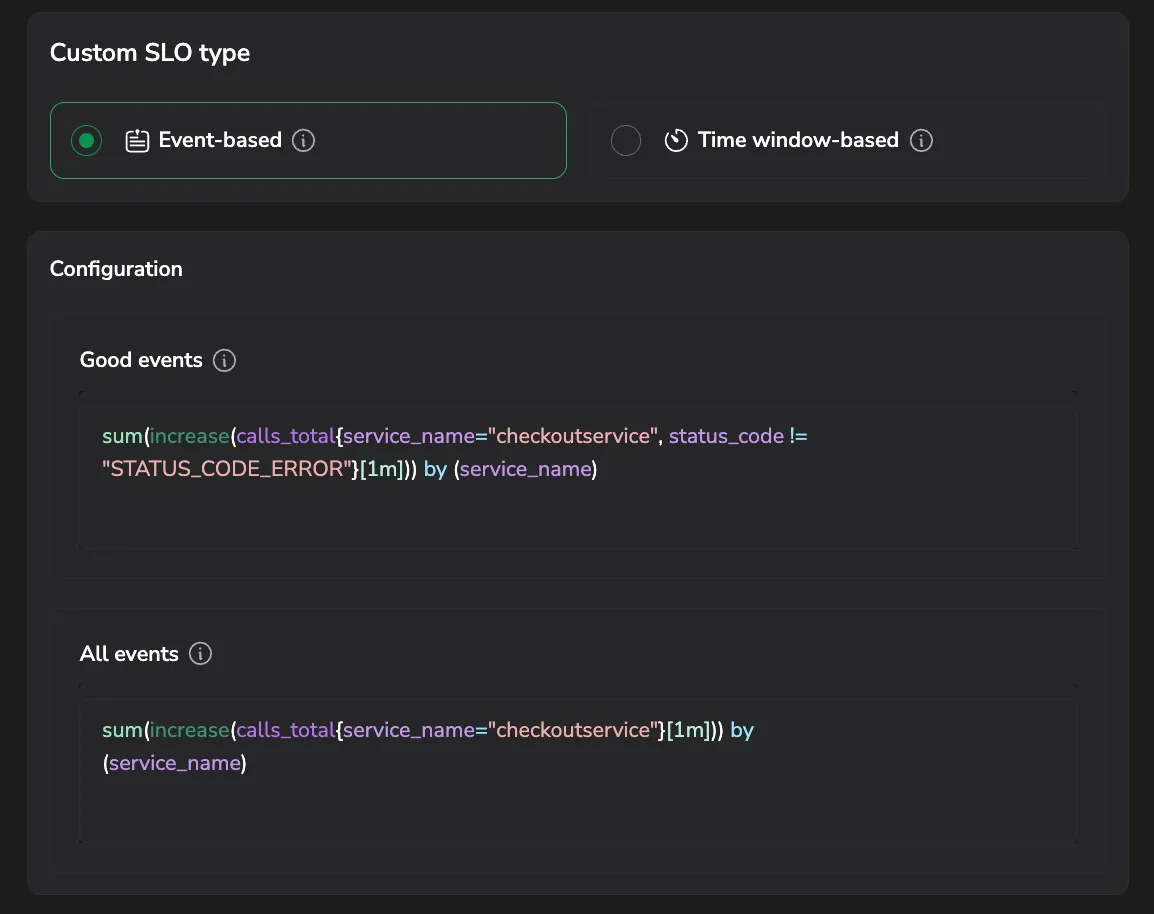
The SLI is the ratio of good events to total events, measured over the SLO time frame:
SLI = Good events / Total events
Group events to produce permutations. Use group by in the queries to split the SLO into permutations, one per value of the grouping field (for example, service_name, region). For example, grouping by service_name creates a separate SLO for each service while sharing one definition.
For more query patterns (HTTP method, Redis commands, Postgres transactions), see Event-based query examples.
Time window-based SLOs evaluate performance in fixed intervals of 1 or 5 minutes. Each window is marked good or bad based on whether it meets a threshold. The SLI is the percentage of good windows over the SLO time frame.
SLI = 100 × (compliant time windows / total time windows)
Configure:
- A time window of 1 or 5 minutes.
- A PromQL query that returns a value to evaluate (for example, p95 latency, average error rate).
- An operator (for example,
<,>=,!=). - A threshold the value must satisfy.
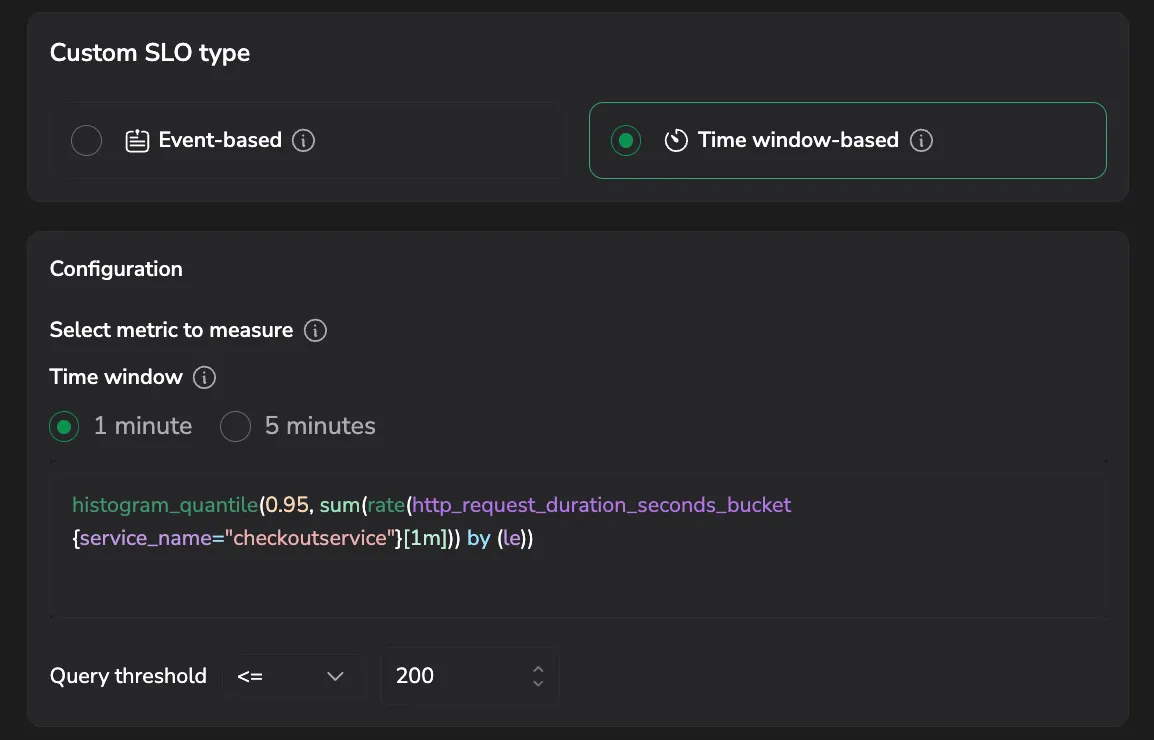
For more query patterns (p95 latency, total latency grouped by dimension), see Time window-based query examples.
Step 4: Set the target and time frame
Define:
- Time frame: the rolling compliance window (for example, 7, 14, 21, 28, or 90 days).
- Target success rate: the percentage required to meet the SLO (for example, 99.9%).

These parameters bound the error budget and keep reliability goals aligned with operational requirements.
Data collection for the SLO's metric begins at SLO creation. Initial calculations cover only data from that point onward. Once the SLO is older than its time frame, the system evaluates a full rolling window.
Step 5: Add exclusion windows
While configuring an SLO, you can add exclusion windows: time ranges left out of the SLO's evaluation, so expected downtime such as planned maintenance is not held against it. Windows are defined per SLO, and all times are in UTC.
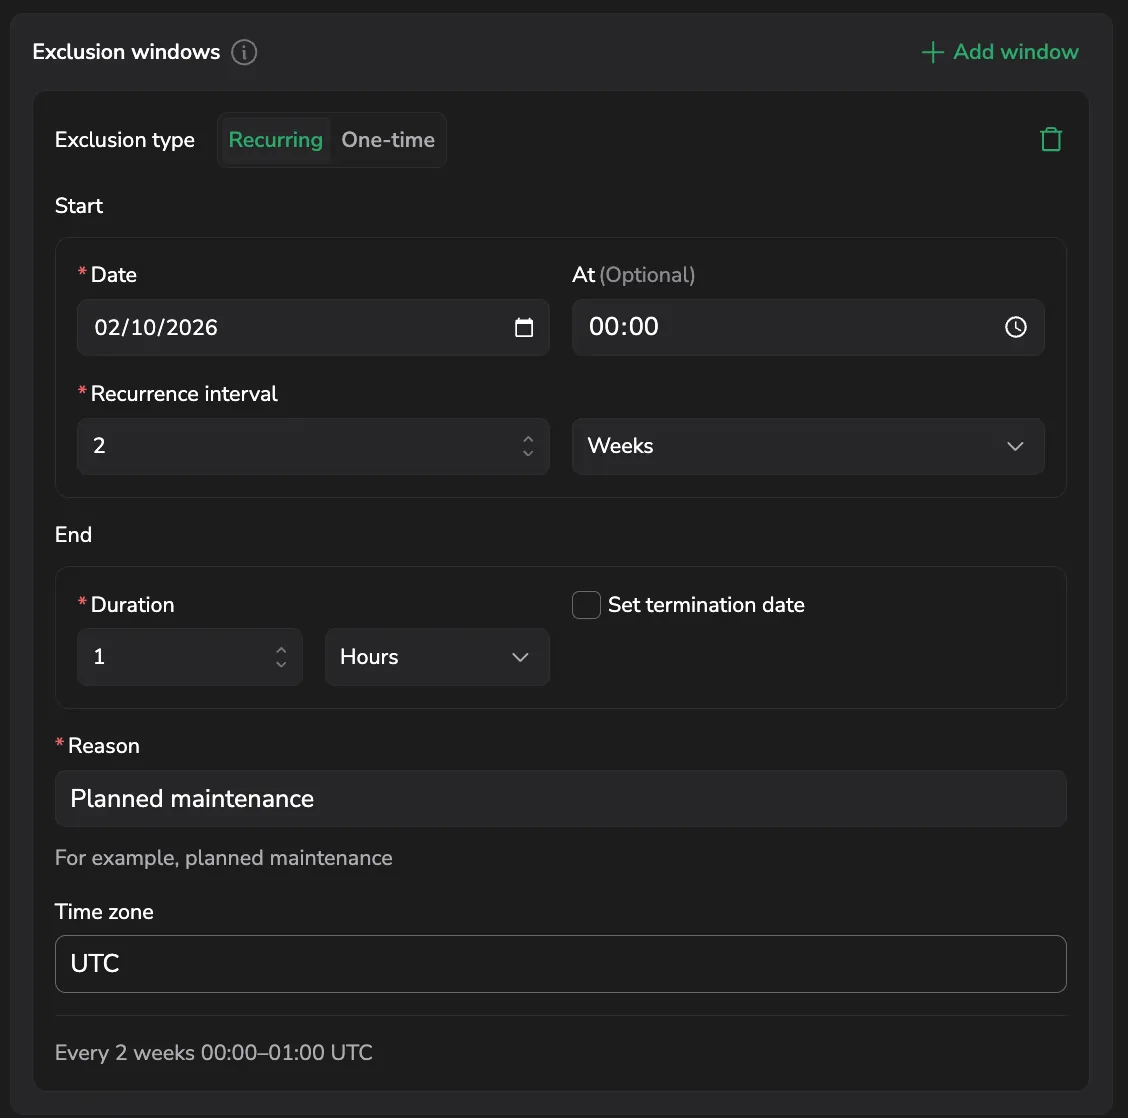
- In the Exclusion windows section of the create or edit drawer, select Add window.
- Set the Exclusion type:
- Recurring: repeats on a schedule. Set a Start date and time, a Recurrence interval (a number of hours, days, or weeks), and a Duration (a number of minutes, hours, or days). To end the series on a date, select Set termination date.
- One-time: applies once. Set a Start, then set the End as either a date and time or a duration.
- Enter a Reason, such as planned maintenance.
- Save the SLO.
As you fill in the schedule, a preview shows when the window applies, for example Every 2 weeks 00:00–01:00 UTC. The duration must be shorter than the recurrence interval, and the start must be in the future.
After you save, manage these windows and see where they appear from the SLO Center.
Step 6: Tag SLO permutations with ownership
Use Ownership tags to identify who owns each permutation of a grouped SLO. Each permutation can carry Service, Environment, and Team tags. Set values for the whole SLO group, or derive them from labels in the query so the tags follow the data.
The Ownership tags card sits at the bottom of the SLO creation form. A spinner appears in the card title while the SLO configuration is being validated.
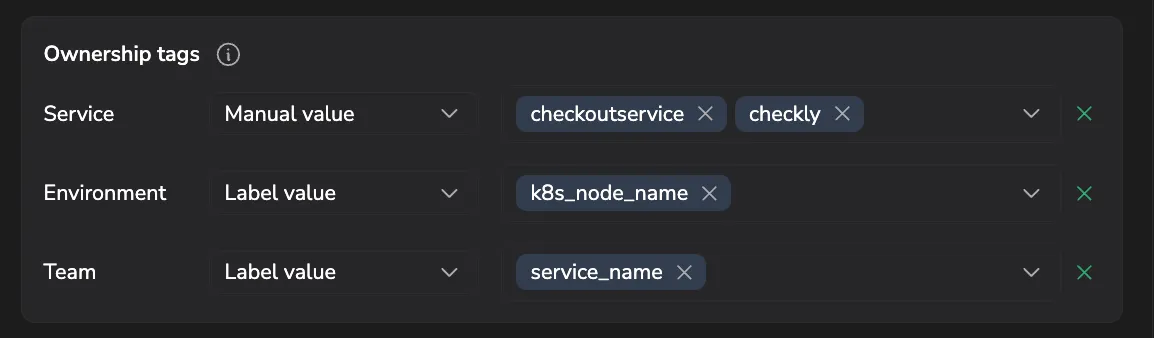
For each of the three dimensions. Service, Environment, and Team: pick how to assign the tag:
| Mode | Description |
|---|---|
| Manual value | Apply fixed values to every permutation in the SLO group. For Service, pick one or more services already reported to your account. For Environment and Team, type a single value (for example, prod, payments). |
| Label value | The tag values are read from labels in the SLO's query, so each permutation can carry a different owner. Pick one or more label keys from the dropdown; only label keys available in the current query are listed. |
To clear a row, select the ✕ icon next to its value.
Ownership tags label permutations; they do not create them. To split the SLO into permutations, use grouping in your query.
Step 7: Preview and validate
The Preview panel validates your SLO in real time, ranks the worst-performing permutations, and surfaces AI-generated suggestions for the target, metric fit, and query shape. For details, see Preview and validate SLOs.
Quick summary:
- Query validation: real-time checks with pass, warning, and fail statuses.
- SLO smart-tip: AI-suggested target, metric-fit analysis, and query-shape guidance.
- Status: the worst-performing permutations ranked by compliance, with per-permutation good/total counts and an overall state against your target.
Step 8: Save the SLO
- Select Create (or Save) to store the SLO.
- Or select Save & create alert to immediately set up alerting based on the new SLO.
Only two things stop you from saving: a missing required field (such as the Name or Target) or a query that can't parse or run. Every other check in Query validation is advisory: a query that returns no data, or one that raises a warning, still saves. This lets you track valid but unconventional SLIs instead of having the form reject them.
SLO calculation example
- APM
- Event-based
- Time window-based
For an APM SLO with a 99% target evaluated over 7 days:
- Total requests: 10,000
- Threshold violations: 52
Current state:
SLI = (10000 − 52) / 10000 × 100 = 99.48%
The error budget allows 1% of requests to violate the threshold, 100 violations out of 10,000. After 52 violations, 48 remain.
Remaining budget = (100 − 52) / 100 × 100 = 48%
If your system logs 9,800 successful responses out of 10,000 total requests:
SLI = 9800 / 10000 = 0.98 (98%)
98% is then compared against your defined SLO target (for example, 99%) to determine compliance.
An SLO is configured with 5-minute windows. The uptime condition is p95 latency must be ≤ 1.5 seconds. Over a 12-hour monitoring period (720 minutes), there are 144 windows. One window violates the threshold, so the service is up for 715 minutes and down for 5.
The resulting uptime is:
Uptime = (143 / 144) × 100 = 99.305%
Underlying PromQL
histogram_quantile(0.95, sum(rate(http_request_duration_seconds_bucket)) by (le))
This query calculates p95 latency over 5-minute windows using Prometheus histograms. Each window is evaluated against the threshold: a p95 value greater than 1.5 seconds marks the window as downtime.
Query examples
- APM
- Event-based
- Time window-based
APM SLOs don't require you to write queries. When you select a service and choose Errors or Latency, Coralogix generates the underlying PromQL for you: the Good events and Total events queries for Errors, or the Window query for Latency. The generated queries run on span metrics (request counts for Errors, duration histograms for Latency). To view the exact PromQL for your configuration, select Show query in the APM step (Step 3).
Measures request success rates by HTTP response code per service.
Good events:
sum(increase(calls_total{status_code != "STATUS_CODE_ERROR"}[1m])) by (service_name)
Total events:
sum(increase(calls_total[1m])) by (service_name)
Tracks successful versus total HTTP requests per service and method.
Good events:
sum(increase(http_requests_total{status_code!~"5.."}[1m])) by (service_name, http_method)
Total events:
sum(increase(http_requests_total[1m])) by (service_name, http_method)
Monitors Redis command reliability by grouping total and error-free command counts by instance, database, and command.
Good events:
sum(increase(redis_commands_processed_total{result!="err"}[1m])) by (instance, redis_db, cmd)
Total events:
sum(increase(redis_commands_processed_total[1m])) by (instance, redis_db, cmd)
Compares committed transactions (good events) against the total number of transaction attempts (commits + rollbacks) per database.
Good events:
sum by (datname) (
  increase(pg_stat_database_xact_commit_total[1m])
)
Total events:
sum by (datname) (
  increase(pg_stat_database_xact_commit_total[1m]) +
  increase(pg_stat_database_xact_rollback_total[1m])
)
Divides the sum of durations by the count of requests. Pair with a threshold such as < 300ms.
sum(increase(duration_ms_sum{service_name="my-service"}))
/
sum(increase(duration_ms_count{service_name="my-service"}))
Evaluates total latency in each window and groups by one or more labels (for example, route, instance, service_name).
sum(increase(duration_ms_sum{<some filter>})) by (<selected group labels>)
Limitations
When an SLO is first created, data collection for its metric begins at that point in time. Initial calculations are based solely on data from the moment of creation onward. Once the SLO age exceeds its time frame, the system uses the full SLO time frame as a rolling window.
Additional resources
Use recording rule–based metrics safely in your SLO creation: see Recording rule–based metrics.
Next steps
Learn how to evaluate the SLO in real time in Preview and validate SLOs, then set up notifications with SLO alerts.