View and manage Service Level Objectives
Overview
The SLO Center is the centralized dashboard for tracking and managing Service Level Objectives (SLOs) across your environment. It helps you stay on top of system reliability with clear visuals, real-time status, and actionable insights.
Use it to:
- Create and update SLO group definitions and associated alerts all in one place.
- Monitor SLO compliance, remaining error budgets, and performance trends at a glance.
- Filter and search SLOs by entity labels, status, and remaining budget.
- Pivot the list by a grouping key to read reliability per entity, for example per region or per cluster, instead of per objective.
- Drill down into individual SLOs to analyze grouped data, alerts, and triggered alert events.
- Exclude planned maintenance and other expected downtime from SLO evaluation with exclusion windows.
- Quickly understand what is actually burning the SLO error budget.
Visualize your SLO performance trends
The SLO Center opens with a row of charts that summarize the health of every SLO across your environment at a glance. Below them, the SLO grid lists each SLO group so you can investigate individual objectives in detail.
Each SLO or SLO group is categorized based on its remaining error budget. These categories reflect system health and help teams prioritize response actions.
| Status | Remaining error budget (%) | Color | Description |
|---|---|---|---|
| OK | 75%–100% | 🟢 Green (healthy) | The SLO is within its defined target. The system is performing as expected. No action is required. |
| Warning | 25%–74% | 🟡 Yellow (monitor) | The SLO is approaching its threshold. There is a risk of breaching the target if performance does not improve. Users should monitor closely. |
| Critical | 1%–24% | 🟣 Purple (high risk) | The SLO is at high risk of breaching, with very little error budget remaining. Immediate attention is recommended. |
| Breached | 0% | 🔴 Red (failure) | The SLO has exceeded its defined target. This indicates failure to meet reliability expectations. Immediate action is required. |
Overview charts
The top of the SLO Center shows three complementary charts, each answering a different question about your SLOs. The charts summarize health at a glance (hover over one to see a tooltip) but they do not filter the SLO grid below. Drill-down happens through the grid.
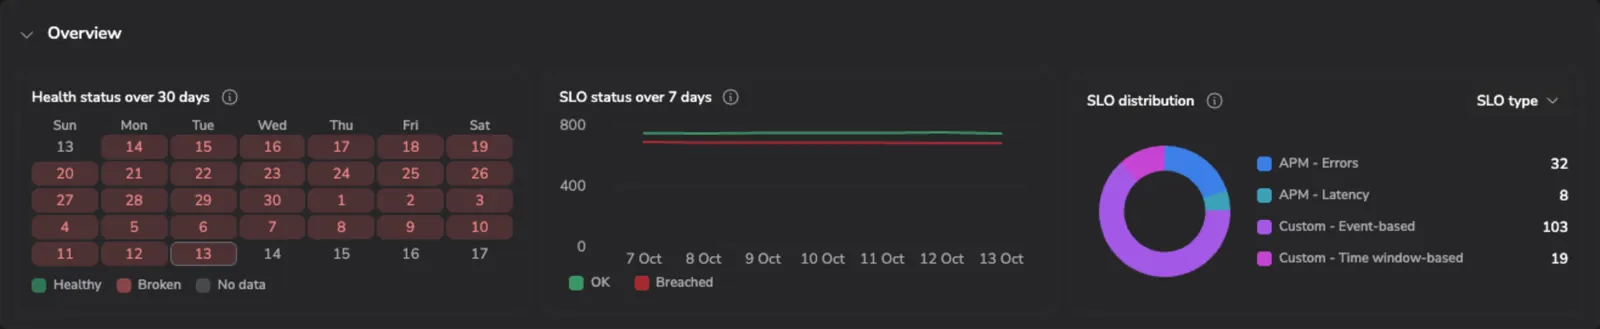
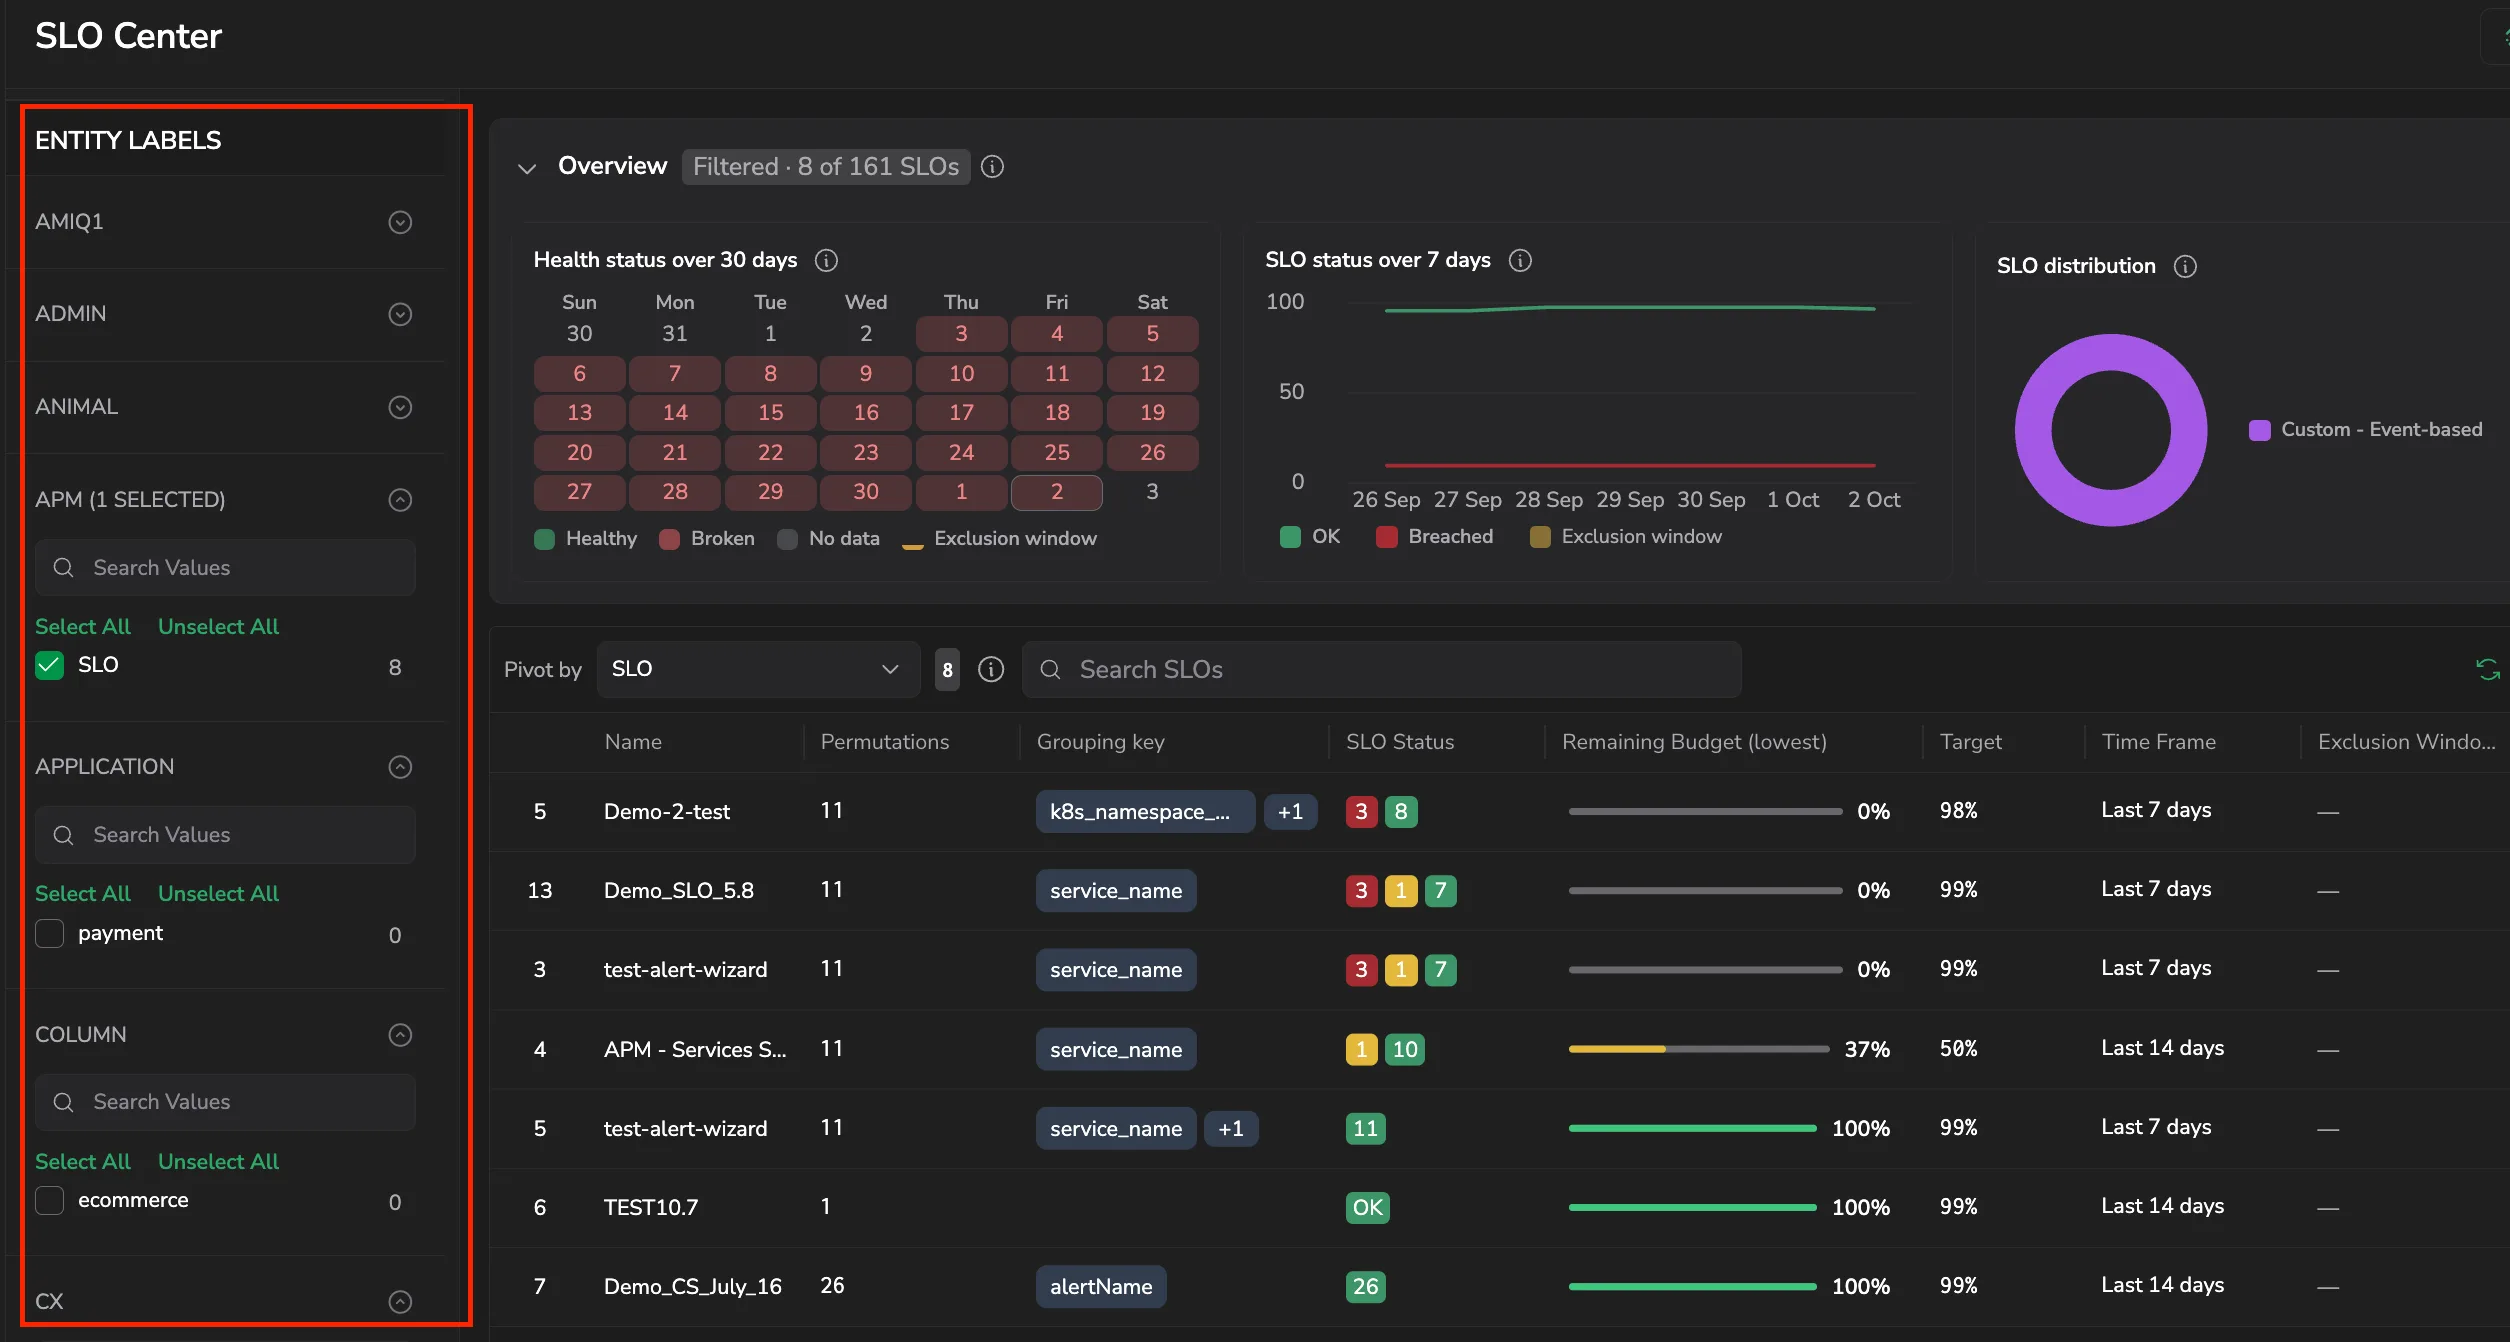
The charts follow the filters you apply to the SLO list. When you narrow the list from the sidebar filters, or by status or remaining budget, all three charts and the collapsed preview chips recalculate to cover only the matching SLOs, and the Overview header shows a Filtered · N of M SLOs chip, where N is the number of SLOs in the filtered view and M is the total number tracked. Select the info icon next to the chip for a reminder of what the scoped view shows:
- Counts are SLO permutations, the same as the SLO grid's status column.
- History reflects today's filter membership projected backward, so an SLO that no longer matches the filters (for example, one that was deleted) drops out of the scoped view.
When no filters are active, or the active filters still cover every SLO, the charts summarize your whole environment and no chip appears.
Health status over 30 days
A calendar view of overall SLO health over the last 30 days, where the most recent day is always today. The grid renders complete Sunday–Saturday weeks, the days just before and after the tracked window are filled in, so the calendar reads as clean weekly rows instead of leaving blank cells at the edges. Each cell shows the aggregated status across the SLOs in view for that day:
- Healthy: no SLO was breached that day.
- Broken: at least one SLO in at least one group was breached that day.
- No data: no SLO reported data that day.
Hover over a day to see its date and the number of SLOs at each status (OK, Warning, Critical, and Breached) for that day. Days with no data show "No SLO had data on this day."
Days that fall inside an exclusion window carry a yellow bar along the bottom of the cell, the day's tooltip adds the exclusion-window count, and a matching Exclusion window swatch appears in the legend.
SLO status over 7 days
A trend line of daily SLO status over the last 7 days that plots two series (OK and Breached) so you can see which direction reliability is heading. Warning and Critical are omitted from this view to keep the trend readable. Hover over the chart to see the OK and breached counts for a given day. Exclusion windows appear as yellow bands behind the trend, with a matching Exclusion window entry in the legend.
SLO distribution
A point-in-time snapshot of how your SLOs are composed right now, shown as a donut chart with a legend that lists each segment and its SLO count. Use the dimension dropdown at the top right of the chart to switch what the SLOs are split by:
- SLO type: the type set at SLO creation (APM - Errors, APM - Latency, Custom - Event-based, or Custom - Time window-based).
- Status: the current status of each SLO (OK, Warning, Critical, or Breached).
Hover over a segment to see its SLO count.
Collapse the overview
The overview section is collapsible, so you can hand more room to the SLO grid without losing the headline signals. It is expanded by default.
Select the chevron next to the Overview header to collapse it. The three charts give way to a compact preview strip:
| Preview chip | What it shows |
|---|---|
| Broken days | The number of broken days over the last 30 days, shown against the number of days that reported data (for example, 2 / 4 last 30 days). |
| OK now / Breached | The current count of SLOs that are OK and the count that are breached. |
| SLO types | The number of SLO types in view, with the largest type group named as the leader (for example, APM - Errors leads). |
Select the chevron again to bring the full charts back. Collapsing and expanding does not reload the chart data, so switching between the two views is instant.
Understand multiple statuses in a single row
If you see more than one status icon (for example, OK, Warning, Critical) in the SLO grid, it means the SLO was defined with a group by clause in the SLO setup. This creates a grouped SLO, where each unique value in the grouping field (such as service.name, region, or customer.id) becomes an individually tracked objective under the same SLO definition.
Each group is evaluated independently and may have a different health status, depending on its own compliance and remaining error budget. The SLO grid aggregates these statuses into a single row to give a high-level view.
Selecting the row opens the SLO Details view, where you can drill down into specific permutations, view group-specific performance metrics, and monitor alerts per group.
Filter the SLO list
Use the sidebar to narrow the SLO grid across multiple dimensions:
| Filter | What it matches |
|---|---|
| SLO Type | SLO type (event-based, time window-based, APM). |
| Entity labels | Custom labels assigned at SLO creation (for example, env:prod). Each label key is a separate filter, so you can combine keys to narrow the list. |
| Status | OK, Warning, Critical, Breached. |
| Remaining budget | A remaining error-budget range. |
| Creator | The user who created the SLO. |
| Service | Ownership tag, the service responsible for each permutation. Values come from the Service dimension on the SLO creation form. |
| Environment | Ownership tag, the environment for each permutation (for example, prod, staging). |
| Team | Ownership tag, the team responsible for each permutation. |
Each filter value shows a count of matching SLOs. Selecting multiple values within a single filter matches any of them. Different filters combine. An SLO appears in the grid only if it matches every active filter. Selected filters appear in the URL, so you can share a filtered view by copying the page link.
Because each entity-label key is its own filter, values of the same key match any of them, while different keys must all match. This lets you narrow the list to an intersection across keys. For example, selecting region:eu and region:us widens the results to either region, while also selecting team:payments narrows them to SLOs that carry the payments team label.
Examine SLO groups
Scroll down to view the SLO grid, which lists all SLOs in your account.
Each column includes key indicators that help you evaluate performance at a glance.
| Parameter | Description |
|---|---|
| Name | The user-defined name of the SLO group. |
| Grouping key | The key (for example, service.name, customer.id) used to break the SLO group into multiple SLO permutations for individual tracking. |
| SLO status | Status of the permutation with the lowest remaining error budget. |
| Lowest remaining error budget | Percentage (%) of allowable errors left. For grouped SLOs, the information for the group with the lowest remaining budget is displayed. |
| Target | The SLO compliance target (for example, 99.9%). |
| Time frame | The SLO period (for example, 7 days, 28 days). |
| Alerts | Number of unique alert definitions that were triggered within the selected SLO time frame. This includes alerts of any status, triggered or acknowledged. Selecting the value redirects to Incidents, pre-filtered to show all incidents associated with those alert definitions for deeper investigation. |
| Creator | The user who created the SLO. |
| Entity labels | A custom label assigned to the SLO at creation, used for filtering or grouping (for example, env:prod, team:payments). |
| Service | Ownership tag identifying the services responsible for each permutation. Values come from the Service dimension in the Ownership tags card on the create form. |
| Environment | Ownership tag identifying the environment for each permutation (for example, prod, staging). Values come from the Environment dimension in the Ownership tags card. |
| Team | Ownership tag identifying the team responsible for each permutation. Values come from the Team dimension in the Ownership tags card. |
| Last updated | Timestamp of the most recent change to the SLO's configuration. |
| Permutations | Number of individual SLO permutations per SLO group. |
| Exclusion windows | The number of active or upcoming exclusion windows on the SLO. Hover to see each window's reason and schedule; a window that is currently running is marked Running now. |
Select any column header to sort the table, for example, sort by lowest remaining budget to quickly find the most at-risk SLOs.
Pivot the SLO list by a grouping key
By default, the SLO grid lists one row per SLO group. Pivoting rebuilds the grid around a single grouping key, so each row becomes one value of that key, aggregating every permutation that carries that value. Use it when you are responsible for an entity rather than an objective, and you need to see what is breaching in us-east-1 without opening each SLO in turn.
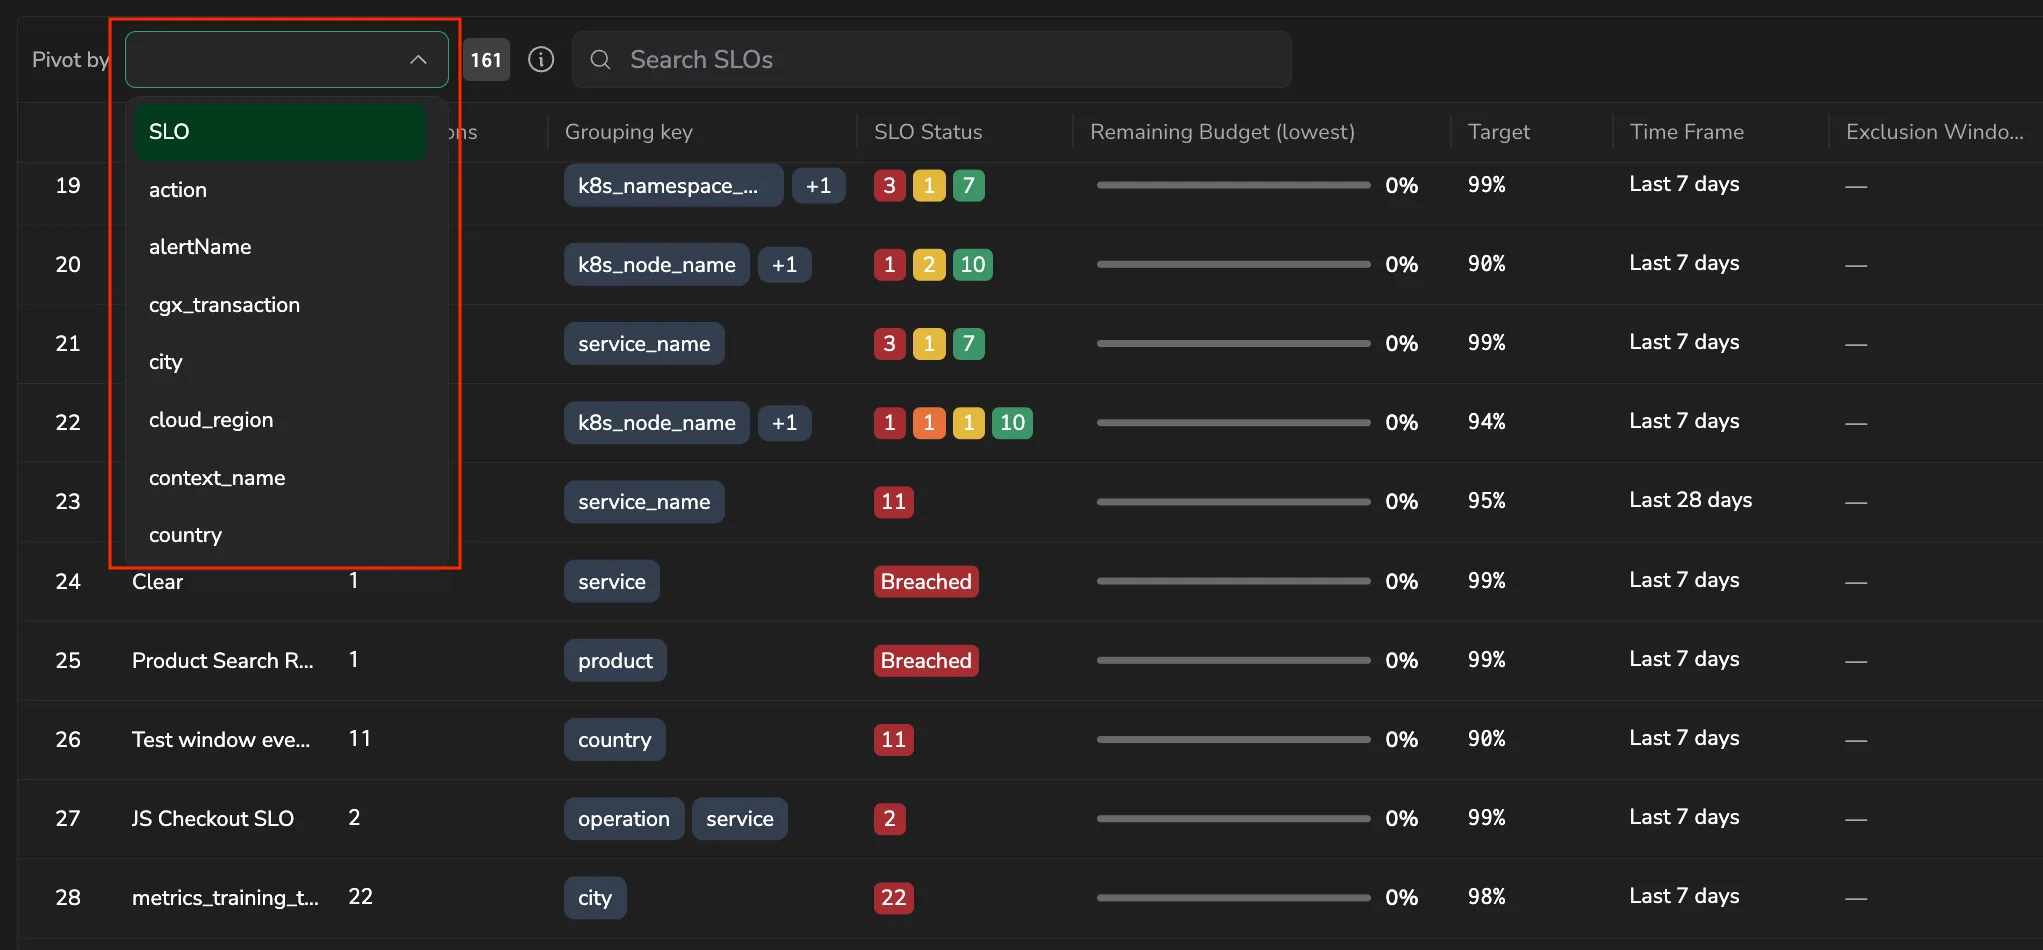
Select Pivot by in the grid toolbar, then choose what to pivot by:
- SLO: the flat list, one row per SLO group. This is the default.
- A grouping key: for example,
region,cluster, orservice.name. The list is built from the keys your SLOs are actually split by, so it only offers keys that are in use.
The counter beside the control shows how many values the pivoted grid contains.
A saved view remembers the pivot you choose, so you can reopen a pivoted layout without setting it up again.
Read a pivoted row
Each row aggregates every permutation that carries its value, across all SLOs. An SLO split across several regions is counted in each region's row, with only that region's permutations.
| Column | Description |
|---|---|
| Pivoted key | The first column takes the name of the key you pivoted by (for example, region), and each row shows one of its values (for example, us-east-1). |
| SLO groups | The number of SLO groups contributing permutations to this value. |
| Permutations | The number of permutations carrying this value. |
| Grouping keys | The grouping keys the row's permutations are split by. |
| SLO status | The status tally across the row's permutations. |
| Lowest remaining budget | A progress bar showing the lowest remaining error budget across the row's permutations, the riskiest one. |
| Target, Time frame, Alerts | The values in use across the row's SLOs. |
| Service, Environment, Team, Entity labels, Creator, Last updated | The same fields as the flat list, aggregated across the row. |
Sort the pivoted grid by any of its numeric columns, SLO groups, Permutations, or Lowest remaining budget, by selecting the column header.
Pivoting never drops data. Permutations that do not carry the key you pivoted by are collected in an Unknown row.
SLO actions
You can take action on any SLO directly from the SLO Center.
- Hover over the SLO row.
- Select the ellipsis icon on the left.
- Proceed to an action:
| Action | Description |
|---|---|
| Edit | Update thresholds, queries, labels, and other configuration parameters. If any changes invalidate existing alerts, you’ll be prompted to modify or remove those alerts before saving. Historical data for the previous SLO configuration will no longer be retained. |
| Create an alert | Define alerting conditions based on the SLO’s logic to detect potential or actual violations. Alerts help teams respond proactively to reliability risks. |
| Delete | Remove obsolete SLOs to keep your view focused and accurate. When an SLO configuration is deleted, its historical data will no longer be available and associated alerts are deleted. |
Exclusion windows
An exclusion window is a time range left out of an SLO's evaluation, so expected downtime such as planned maintenance is not held against the SLO. Windows are defined per SLO, and all times are in UTC.
Where a window overlaps the timeline, it is marked across the SLO Center: as a count in the Exclusion windows grid column, a yellow bar on the 30-day health calendar, and yellow bands on the 7-day status trend.
You add exclusion windows while you create or edit an SLO.
Manage exclusion windows
Saved windows can't be edited. To change one, deactivate it and add a new window.
Each saved window is tagged Upcoming or Active (Active means it is running now) and shows its reason and schedule. To stop a window, select Deactivate and confirm. Deactivation takes effect when you save the SLO: the window's past occurrences stay in the SLO history, and a deactivated window can't be reactivated.
Windows that have ended move into the collapsible Archived windows list, where their reason and schedule remain visible.
Next steps
Set up notifications when your error budget is at risk by configuring SLO alerts.