Achieve better AWS security with just 10 Cloudtrail logs alerts
CloudTrail logs track actions taken by a user, role, or an AWS service, whether taken through the AWS console or API operations. In contrast to on-premise-infrastructure…

AWS VPC Flow Logs monitor and record details about the traffic passing through your application, including requests that were allowed or denied according to your ACL (access control list) rules. It also has information about the IP addresses, and ports for each request, the number of packets, bytes sent, and timestamps for each request.
This information brings deep visibility and the ability to improve your security posture over time. Using these logs you can optimize ACL rules and make exceptions to allow or reject certain types of requests. Finally, you can set alarms to be notified of suspicious requests.
Tip: Coralogix provides a predefined Lambda function to forward your VPC Flow Logs straight to Coralogix.
The following examples describe how different log fields can be used to monitor and alert the operational status of your AWS infrastructure.
Tip: These examples assume that the logs were already parsed into JSON. If you need to parse your VPC flow logs using regular expressions, see here and here.
Tip: If you’re new to creating Coralogix alerts, checkout this tutorial and get a quick overview.
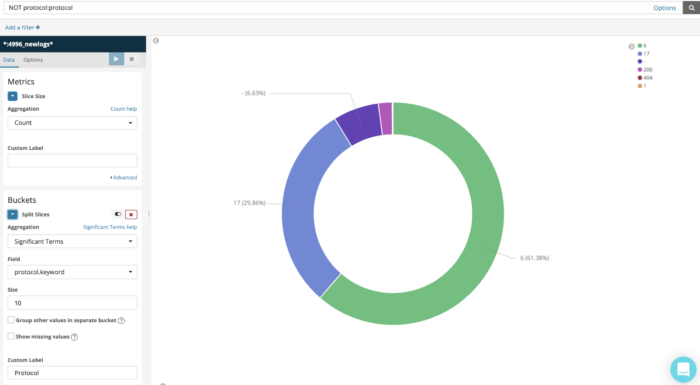
The first log that we will use in the examples represents TCP traffic (IANA protocol 6).
{
	“version”: “2”,
	“account-id”: “eni-1235b8ca123456789”,
	“interface-id”: “172.31.16.139”,
	“srcaddr”: “172.31.16.21”,
	“srcport”: “20641”,
	“dstport”: “22”,
	“srcport”: “20641”,
	“protocol”: “6”,
	“packets”: “20”,
	“srcport”: “20641”,
	“bytes”: “4249”,
	“start”: “1418530010”,
“end”: “1418530070”,
“action”: “ACCEPT”,
“log-status”: “OK”
}

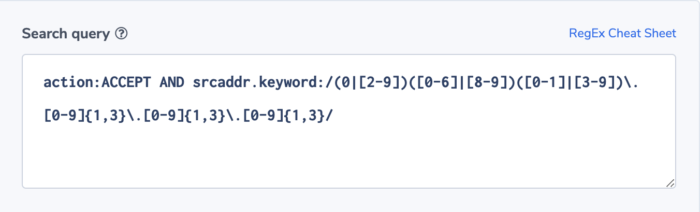
One of the advantages of a VPC is the ability to create fully controlled and isolated networks, including IP address ranges. This can be used to identify unauthorized traffic and get alerted on it.
Alert condition:
action:ACCEPT AND srcaddr.keyword:/(0|[2-9])([0-6]|[8-9])([0-1]|[3-9])\.[0-9]{1,3}\.[0-9]{1,3}\.[0-9]{1,3}/
In this alert, we assume that traffic that comes from the network and that doesn’t fall within the primary 172.0.0.xxx domain is illegal and should be alerted on. We use a regex to identify such source addresses.
Tip: You can read here why we utilize Coralogix’s ‘.keyword’ field
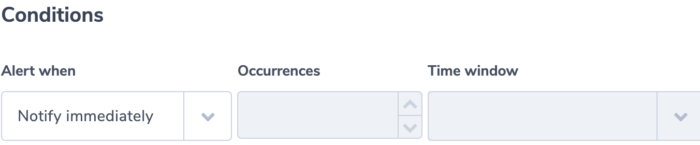
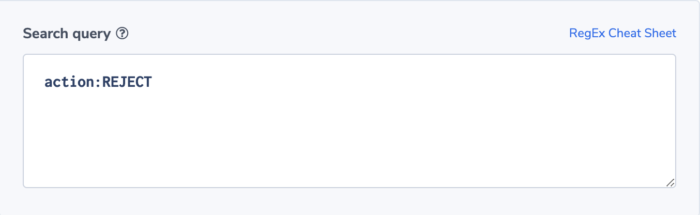
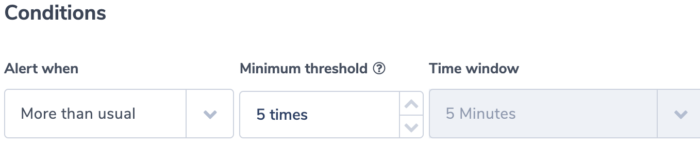
In this example we use action:REJECT as an indication for a failure and create an alert based on an unacceptable number of rejections. You can then log aggregate results in 1 minute intervals (the difference between ‘start’ and ‘end’). In this example, we want to be alerted if we get more than 4 rejections in a 5 minute window.
The alert filter will be simple: action:REJECT.
We choose the alert settings of ‘more than usual’. Based on its ML algorithms, Coralogix will identify when there is a surge in rejections. We also use the ‘group by’ option and group the logs that will be sent in the notification by ‘interface-id’. This provides insight into the nature of the problem. Is it a systemic problem or is it associated with a specific interface?
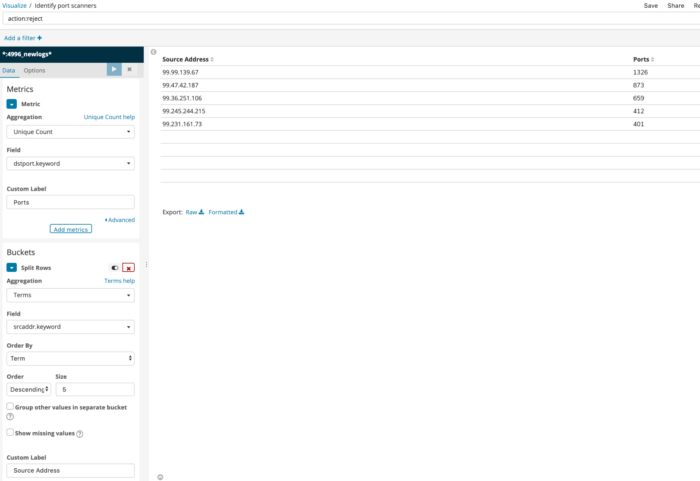
One of the main use cases of VPC logs is intrusion detection. As an intruder gains access to one of your servers, the first thing they will try to do is recon the environment. If the security groups and access controls were well defined for the environment, the detection of too many rejects for a machine will be an indication of an intrusion.
In this example, we use the following custom log. Custom VPC flow logs include a subset of the available fields, in the order of your choice.
Tip: Custom logs can be published to S3 and can not be published to Cloudwatch, but Coralogix integrates with both.
{
	“version”: “3”,
	“account-id”: “vpc-abcdefab012345678”,
	“interface-id”: “172.31.16.139”,
	“srcaddr”: “172.31.16.21”,
	“srcport”: “20641”,
	“dstport”: “22”,
	“srcport”: “20641”,
	“protocol”: “6”,
	“packets”: “20”,
	“srcport”: “20641”,
	“bytes”: “4249”,
	“start”: “1418530010”,
“end”: “1418530070”,
“action”: “ACCEPT”,
“tcp-flags”: 3,
“log-status”: “OK”
}
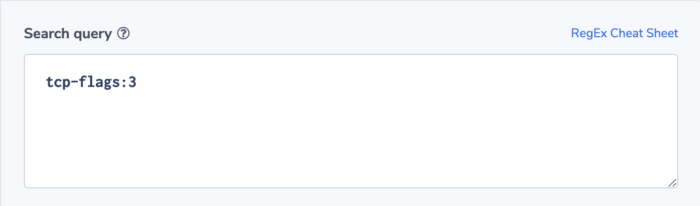
In the above log the tcp-flags key value is 3. Tcp-flag can include a combination of a few flags, 3=2+1, which indicates SYN and FIN. Sometimes, connections quickly open and close within a single capture window which results in the value 3. Having a lot of these short connections might indicate inefficient application architecture or a problem within the system. This condition can be alerted on.
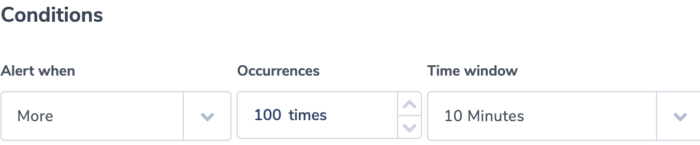
The alert filter is tcp-flags:3 and we can define a threshold using ‘more than’ condition. In this example, the threshold is more than 100 within a 10 minute window. The notification logs can be grouped by address or by other custom fields like type, instance-id or subnet-id (we didn’t include these in our log example).
In this example, a custom log is generated following an instance on a private subnet accessing the internet through NAT that sits on a public subnet.
{
	“version”: “3”,
	“account-id”: “vpc-abcdefab012345678”,
	“interface-id”: “172.31.16.139”,
	“srcaddr”: “172.31.16.21”,
	“srcport”: “20641”,
	“dstport”: “22”,
	“srcport”: “20641”,
	“pkt-srcaddr”: ,
	“pkt-dstaddr”:
	“protocol”: “6”,
	“packets”: “20”,
	“srcport”: “20641”,
	“bytes”: “4249”,
	“start”: “1418530010”,
“end”: “1418530070”,
“action”: “ACCEPT”,
“log-status”: “OK”
}
For some enterprises or organizations, it is important to be alerted if unauthorized IP addresses are contacted from within a VPC private subnet. In this case, the pkt-srcaddr and/or pkt-dstaddr fields are handy. They show the packet-level (original) source or destination IP address of the traffic and can be used to distinguish between the IP address of an intermediate layer (like NAT) through which traffic flows, and the true origin or final IP destination.
In this case, we will alert if pkt-dstaddr is outside an approved list of addresses.
The alert filter will be:
NOT pkt-dstaddr.keyword:/(addr1|addr2|addr3| …|addrN)/
if regex is used or if regex is not being used:
NOT pkt-dstaddr:”addr1” NOT pkt-dstaddr:”addr2” … NOT pkt-dstaddr:”addrN”
The alert will be immediate, as we want to know if there was a single breach of security.
The alert definition is very similar to the previous alerts, so I didn’t include a screenshot.

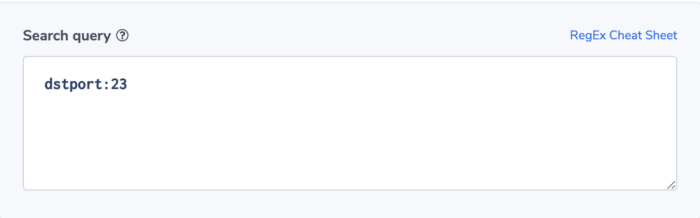
Let’s assume that our infrastructure does not use Telnet (port 23). We want to be alerted when traffic is directed at this port as this is most likely malicious traffic.
Alert filter will be dstport:23
Notify immediately.
The alert definition is very similar to the previous alerts, so I didn’t include a screenshot.
The log-status field has three possible values: OK, NODATA and SKIPDATA.
NODATA means that no traffic was recorded for the network interface during the capture period.
SKIPDATA means that some flow logs were skipped during the capture period. Depending on your application spec’s you can use these codes to identify issues. SKIPDATA is an indication of internal error or capacity problem and NODATA might be contradicting an expected application behavior.
An alert based on these values will look like this:
Alert filter will be
log-status:NODATA OR log-status:SKIPDATA
, and settings will be ‘notify immediately’.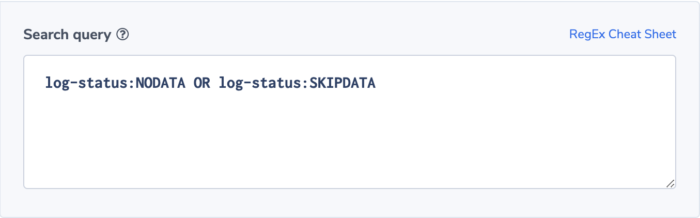
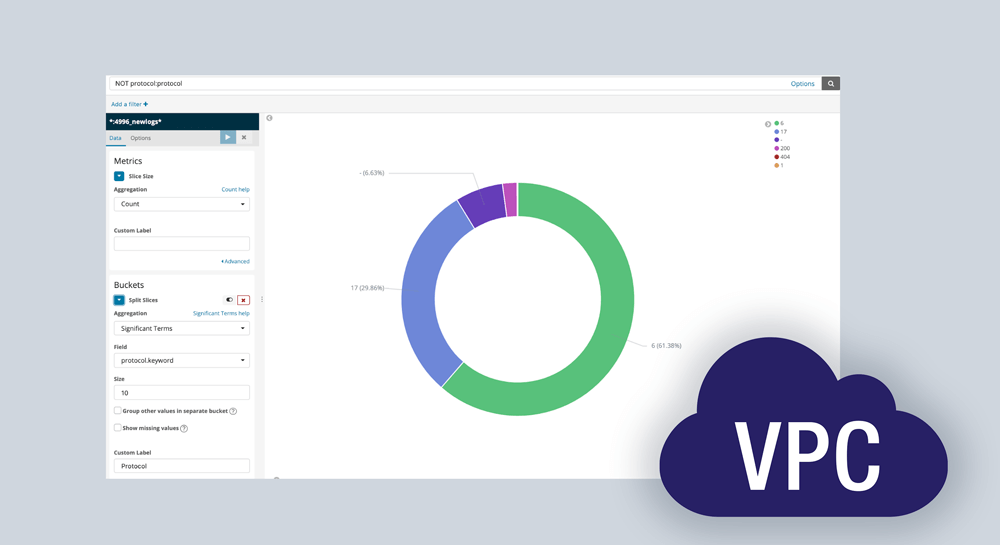
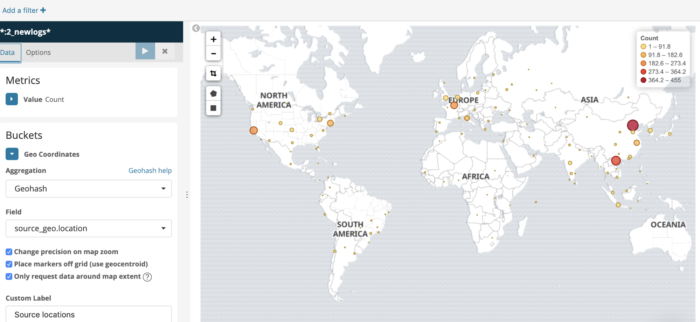
Using Kibana you can gain insight and monitor VPC operational parameters. Here are a few examples.
Devops can establish a normal baseline and watch for deviation 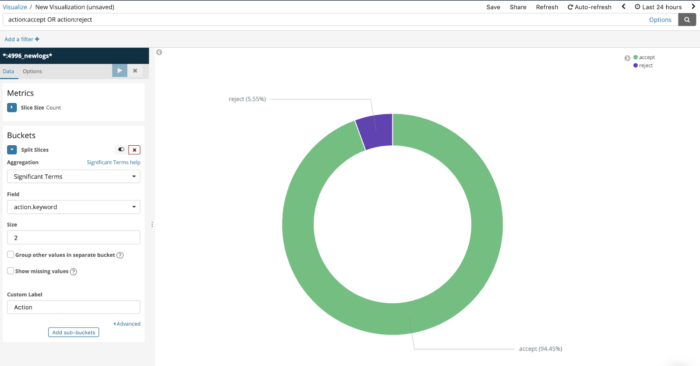
Here is an example showing the Accept/Reject ratio on a Timelion time series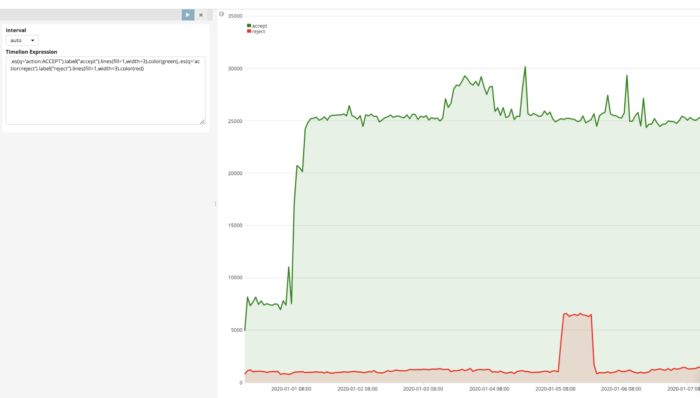

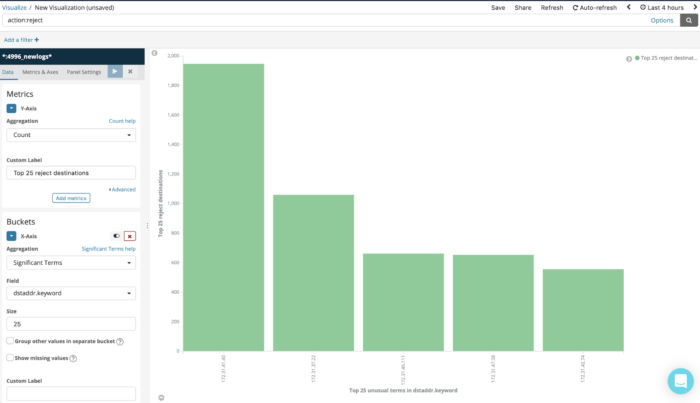
Port scans could be a precursor to an attack. Finding a port scan that results in access to many closed ports can be a red flag.
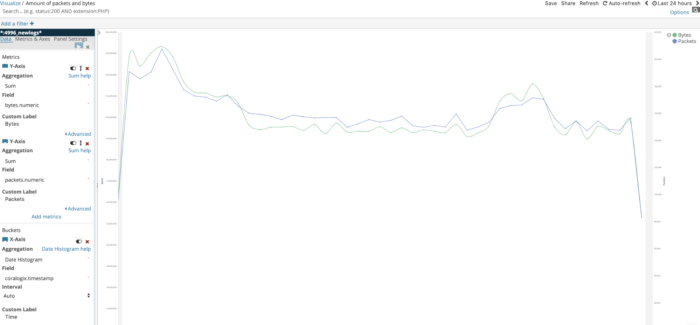
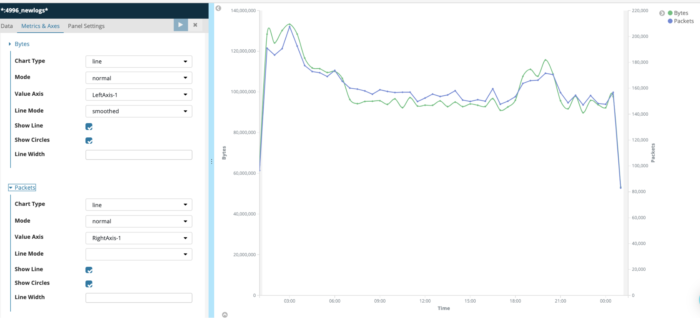
Because of an order of magnitude difference between the number of packets and bytes, we used both the right and left sides for the y axis.
Here are the settings:
This blog post started with describing AWS VPC flow logs and their structure. It then focused on showing different examples of alerts and visualizations that can help you unlock the value embedded in these logs. Your logs might be customized and configured differently and you most likely have your own requirements and use case. So, take the methods and concepts shown here and adapt them to your own needs. If you need help or have any questions, don’t hesitate to reach out to [email protected]. You can learn more about unlocking the value embedded in AWS and other logs in some of our other blog posts.

CloudTrail logs track actions taken by a user, role, or an AWS service, whether taken through the AWS console or API operations. In contrast to on-premise-infrastructure…
AWS S3 access logs provide detailed records for requests made to S3 buckets. They’re useful for many applications. For example, access log information can be useful…

Whether it’s Apache, Nginx, ILS, or anything else, web servers are at the core of online services, and web log monitoring and analysis can reveal a…
