Ship OpenTelemetry Data to Coralogix via Reverse Proxy (Caddy 2)
It is commonplace for organizations to restrict their IT systems from having direct or unsolicited access to external networks or the Internet, with network proxies serving…

In a previous post, we explored the basic concepts behind using Grok patterns with Logstash to parse files. We saw how versatile this combo is and how it can be adapted to process almost anything we want to throw at it. But the first few times you use something, it can be hard to figure out how to configure for your specific use case. Looking at real-world examples can help here, so let’s learn how to use Grok patterns in Logstash to parse common logs we’d often encounter, such as those generated by Nginx, MySQL, Elasticsearch, and others.
We’ll take a look at a lot of example logs and Logstash config files in this post so, if you want to follow along, instead of downloading each one at each step, let’s just copy all of them at once and place them in the “/etc/logstash/conf.d/logstash” directory.
First, install Git if it’s not already installed:
sudo apt update && sudo apt install git
Now let’s download the files and place them in the directory:
sudo git clone https://github.com/coralogix-resources/logstash.git /etc/logstash/conf.d/logstash
NGINX and Apache are the most popular web servers in the world. So, chances are, we will often have contact with the logs they generate. These logs reveal information about visits to your site like file access requests, NGINX responses to those requests, and information about the actual visitors, including their IP, browser, operating system, etc. This data is helpful for general business intelligence, but also for monitoring for security threats by malicious actors.
Let’s see how a typical Nginx log is structured.
We’ll open the following link in a web browser https://raw.githubusercontent.com/coralogix-resources/logstash/master/nginx/access.log and then copy the first line. Depending on your monitor’s resolution, the first line might actually be broken into two lines, to fit on the screen (otherwise called “line wrapping”). To avoid any mistakes, here is the exact content of the line we will copy:
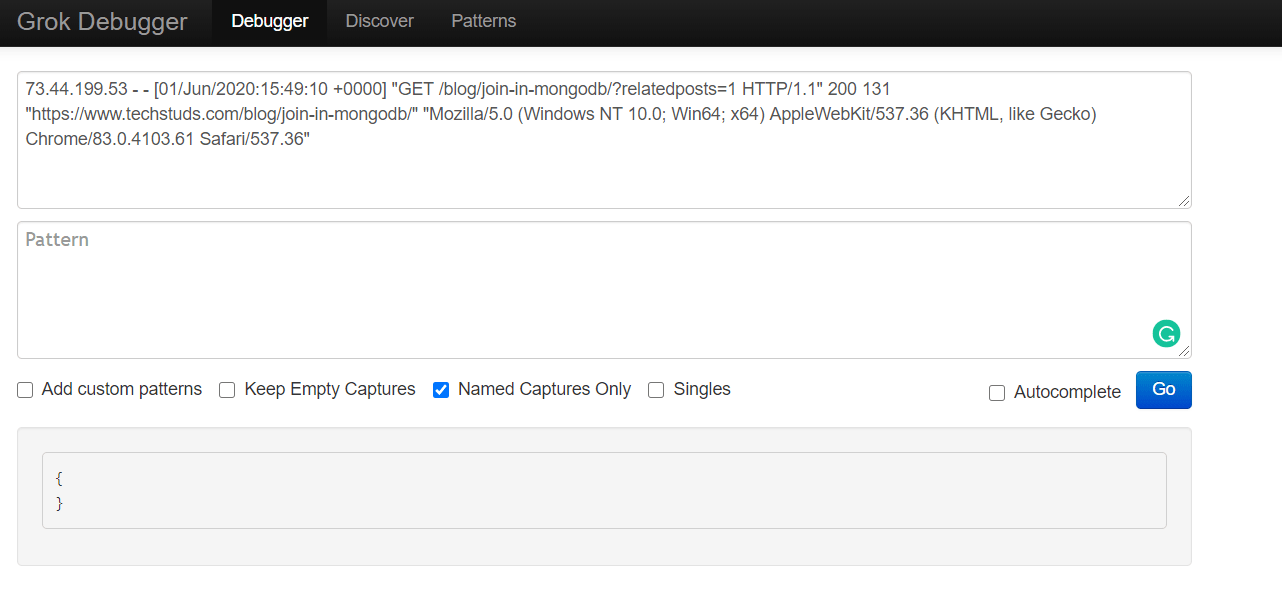
73.44.199.53 - - [01/Jun/2020:15:49:10 +0000] "GET /blog/join-in-mongodb/?relatedposts=1 HTTP/1.1" 200 131 "https://www.techstuds.com/blog/join-in-mongodb/" "Mozilla/5.0 (Windows NT 10.0; Win64; x64) AppleWebKit/537.36 (KHTML, like Gecko) Chrome/83.0.4103.61 Safari/537.36"

Next, let’s open the Grok Debugger Tool at https://grokdebug.herokuapp.com/ to help us out. In the first field, the input section, we’ll paste the previously copied line.
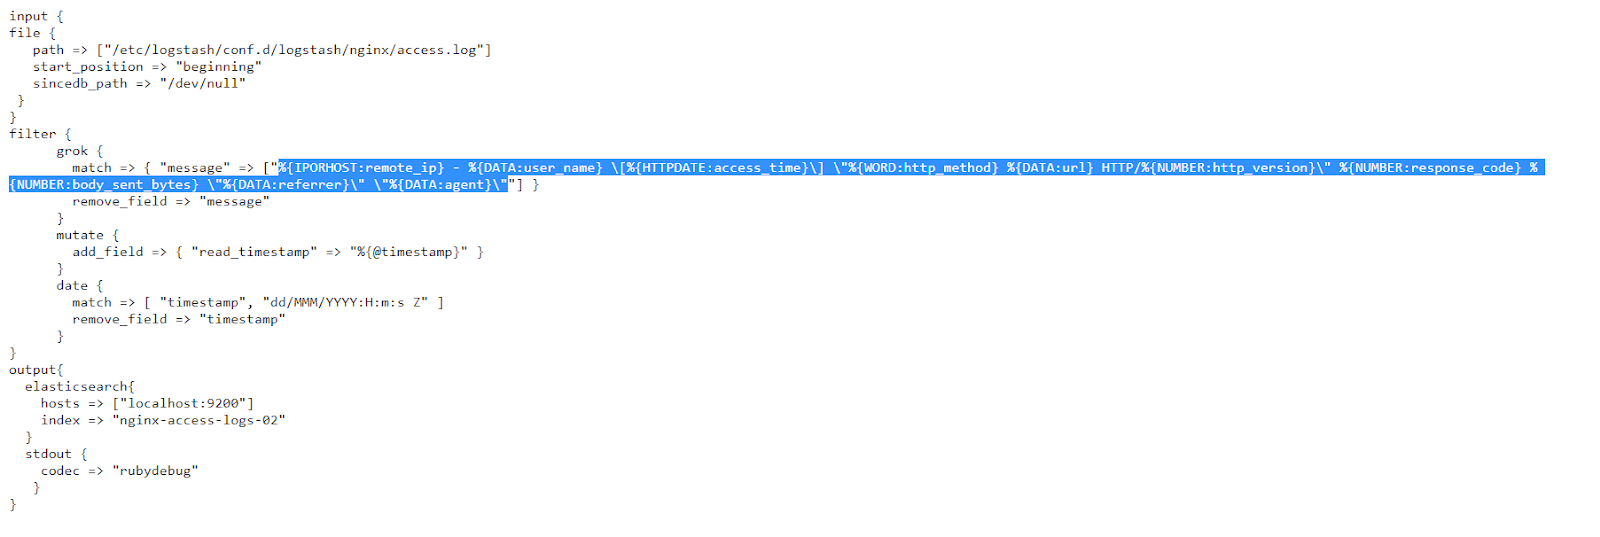
Now let’s have a look at the Logstash config we’ll use to parse our Nginx log: https://raw.githubusercontent.com/coralogix-resources/logstash/master/nginx/nginx-access-final.conf.
From here, we’ll copy the Grok pattern from the “match” section. This is the exact string we should copy:
%{IPORHOST:remote_ip} - %{DATA:user_name} \[%{HTTPDATE:access_time}\] \"%{WORD:http_method} %{DATA:url} HTTP/%{NUMBER:http_version}\" %{NUMBER:response_code} %{NUMBER:body_sent_bytes} \"%{DATA:referrer}\" \"%{DATA:agent}\"
We go back to the https://grokdebug.herokuapp.com/ website and paste the Grok pattern in the second field, the pattern section. We’ll also tick the “Named captures only” checkbox and then click the “Go” button.
Note: For every line you copy and paste, make sure there are no empty lines before (or after) the actual text in the pattern field. Depending on how you copy and paste text, sometimes an empty line might get inserted before or after the copied string, which will make the Grok Debugger fail to parse your text. If this happens, just delete the empty line(s).
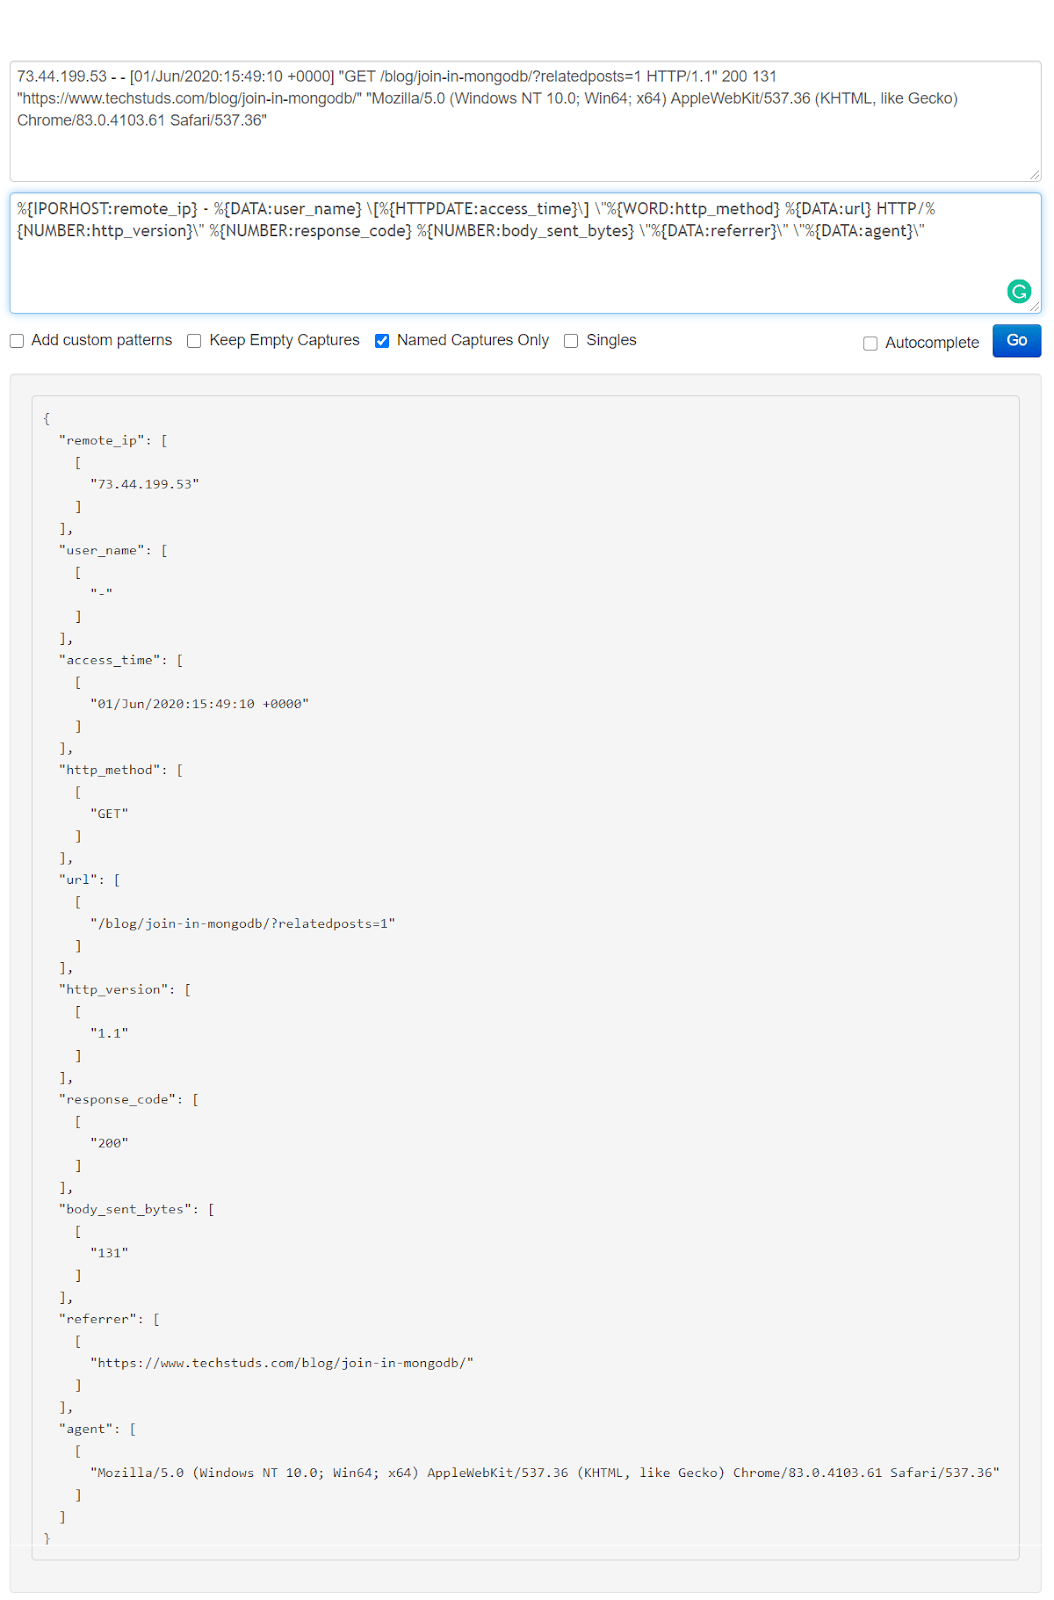
This tool is useful to test if our Grok patterns work as intended. It makes it convenient to try out new patterns, or modify existing ones and see in advance if they produce the desired results.
Now that we’ve seen that this correctly separates and extracts the data we need, let’s run Logstash with the configuration created specifically to work with the Nginx log file:
sudo /usr/share/logstash/bin/logstash -f /etc/logstash/conf.d/logstash/nginx/nginx-access-final.conf
The job should finish in a few seconds. When we notice no more output is generated, we can close Logstash by pressing CTRL+C.
Now let’s see how the log file has been parsed and indexed:
curl -XGET "http://localhost:9200/nginx-access-logs-02/_search?pretty" -H 'Content-Type: application/json' -d'{
  "size": 1,
  "track_total_hits": true,
  "query": {
    "bool": {
      "must_not": [
        {
          "term": {
            "tags.keyword": "_grokparsefailure"
          }
        }
      ]
    }
  }
}'
We’ll see a response similar to the following:
      {
        "_index" : "nginx-access-logs-02",
        "_type" : "_doc",
        "_id" : "vvhO2XIBB7MjzkVPHJhV",
        "_score" : 0.0,
        "_source" : {
          "access_time" : "01/Jun/2020:15:49:10 +0000",
          "user_name" : "-",
          "url" : "/blog/join-in-mongodb/?relatedposts=1",
          "path" : "/etc/logstash/conf.d/logstash/nginx/access.log",
          "body_sent_bytes" : "131",
          "response_code" : "200",
          "@version" : "1",
          "referrer" : "https://www.techstuds.com/blog/join-in-mongodb/",
          "http_version" : "1.1",
          "read_timestamp" : "2020-06-21T23:54:33.738Z",
          "@timestamp" : "2020-06-21T23:54:33.738Z",
          "agent" : "Mozilla/5.0 (Windows NT 10.0; Win64; x64) AppleWebKit/537.36 (KHTML, like Gecko) Chrome/83.0.4103.61 Safari/537.36",
          "http_method" : "GET",
          "host" : "coralogix",
          "remote_ip" : "73.44.199.53"
        }
We can see the fields and their associated values neatly extracted by the Grok patterns.
While we’ll often see Apache and Nginx web servers on the Linux operating system, Microsoft Windows has its own web server included in IIS (Internet Information Services). These generate their own logs that can be helpful to monitor the state and activity of applications. Let’s learn how to parse logs generated by IIS.
Just as before, we will take a look at the sample log file and extract the first useful line: https://raw.githubusercontent.com/coralogix-resources/logstash/master/iis/u_ex171118-sample.log.
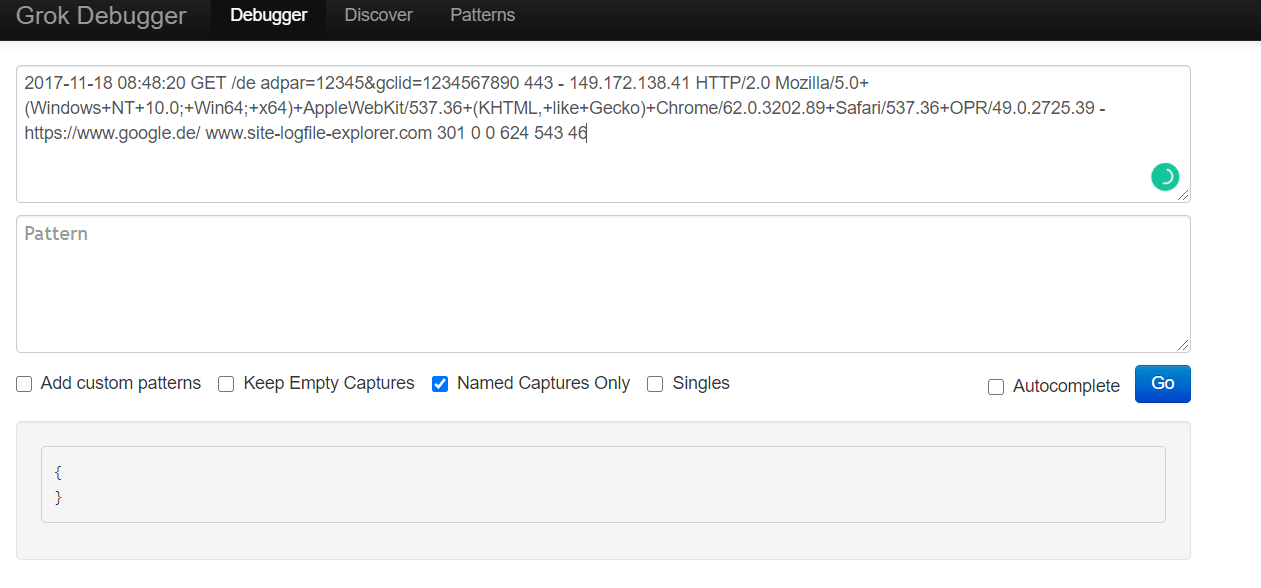
We’ll ignore the first few lines starting with “#” as that is a header, and not actual logged data. The line we’ll extract is the following:
2017-11-18 08:48:20 GET /de adpar=12345&gclid=1234567890 443 - 149.172.138.41 HTTP/2.0 Mozilla/5.0+(Windows+NT+10.0;+Win64;+x64)+AppleWebKit/537.36+(KHTML,+like+Gecko)+Chrome/62.0.3202.89+Safari/537.36+OPR/49.0.2725.39 - https://www.google.de/ www.site-logfile-explorer.com 301 0 0 624 543 46

Once again, to take a closer look at how our specific Grok patterns will work, we’ll paste our log line into the Grok Debugger Tool tool, in the first field, the input section.
The config file we’ll use to parse the log can be found at https://raw.githubusercontent.com/coralogix-resources/logstash/master/iis/iis-final-working.conf.
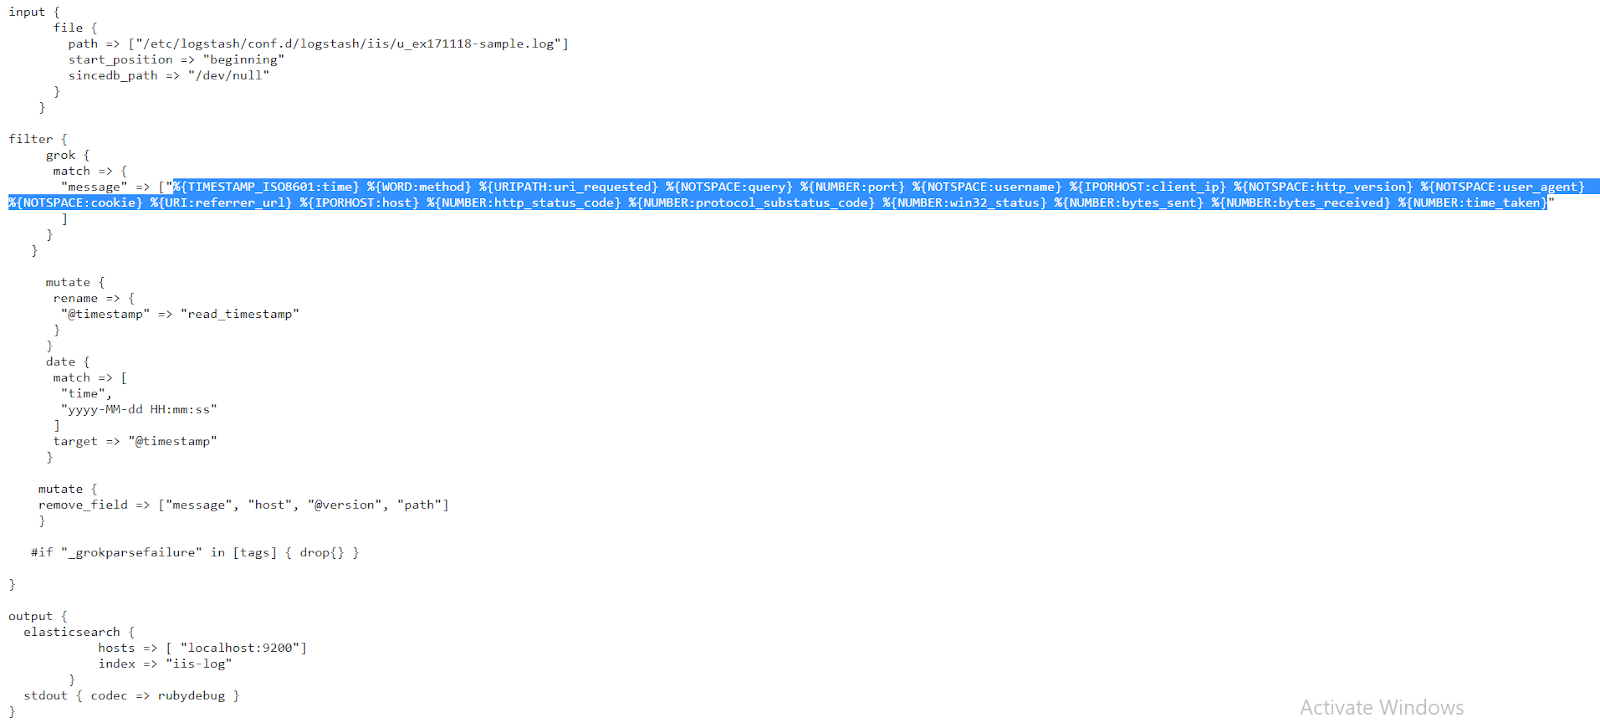
Once again, let’s copy the Grok pattern within:
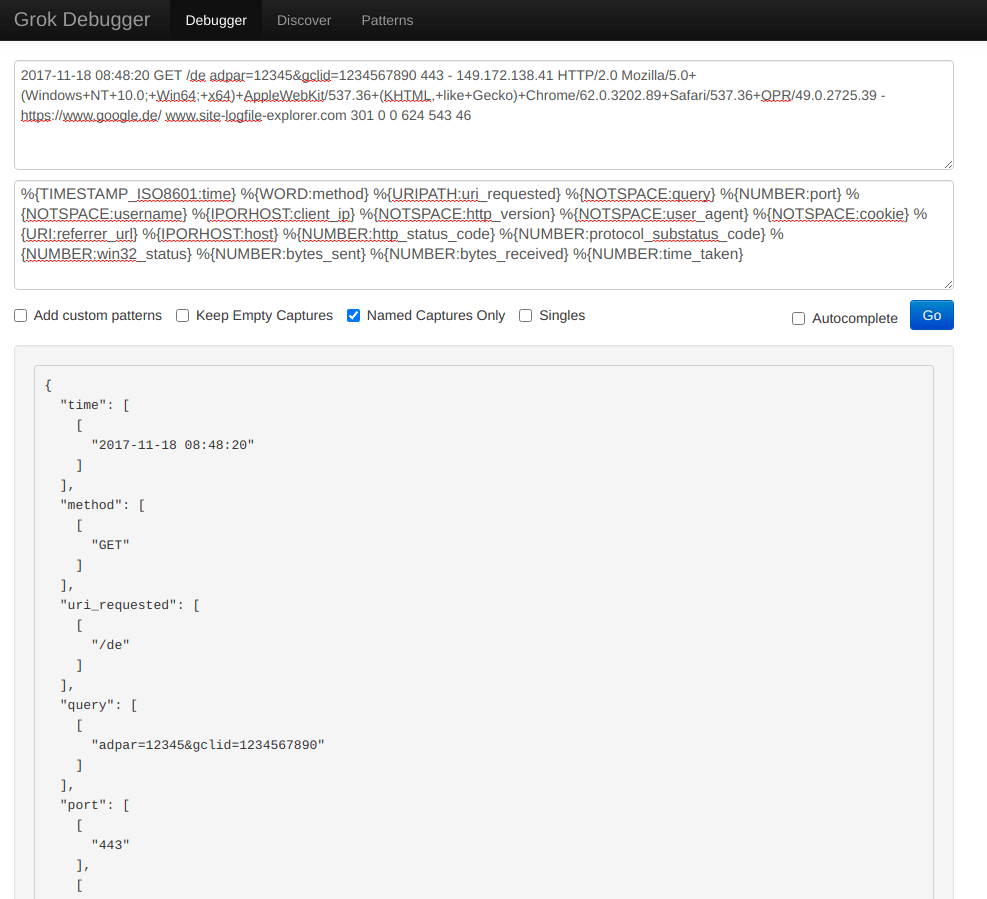
%{TIMESTAMP_ISO8601:time} %{WORD:method} %{URIPATH:uri_requested} %{NOTSPACE:query} %{NUMBER:port} %{NOTSPACE:username} %{IPORHOST:client_ip} %{NOTSPACE:http_version} %{NOTSPACE:user_agent} %{NOTSPACE:cookie} %{URI:referrer_url} %{IPORHOST:host} %{NUMBER:http_status_code} %{NUMBER:protocol_substatus_code} %{NUMBER:win32_status} %{NUMBER:bytes_sent} %{NUMBER:bytes_received} %{NUMBER:time_taken}
…and paste it to the second field in the https://grokdebug.herokuapp.com/ website, the pattern section:
Let’s run Logstash and parse this IIS log:
sudo /usr/share/logstash/bin/logstash -f /etc/logstash/conf.d/logstash/iis/iis-final-working.conf
As usual, we’ll wait for a few seconds until the job is done and then press CTRL+C to exit the utility.
Let’s look at the parsed data:
curl -XGET "http://localhost:9200/iis-log/_search?pretty" -H 'Content-Type: application/json' -d'{
  "size": 1,
  "track_total_hits": true,
  "query": {
    "bool": {
      "must_not": [
        {
          "term": {
            "tags.keyword": "_grokparsefailure"
          }
        }
      ]
    }
  }
}'
A response similar to the following shows us that everything is neatly structured in the index.
      {
        "_index" : "iis-log",
        "_type" : "_doc",
        "_id" : "6_i62XIBB7MjzkVPS5xL",
        "_score" : 0.0,
        "_source" : {
          "http_version" : "HTTP/2.0",
          "query" : "adpar=12345&gclid=1234567890",
          "bytes_received" : "543",
          "read_timestamp" : "2020-06-22T01:52:43.628Z",
          "user_agent" : "Mozilla/5.0+(Windows+NT+10.0;+Win64;+x64)+AppleWebKit/537.36+(KHTML,+like+Gecko)+Chrome/62.0.3202.89+Safari/537.36+OPR/49.0.2725.39",
          "uri_requested" : "/de",
          "username" : "-",
          "time_taken" : "46",
          "referrer_url" : "https://www.google.de/",
          "client_ip" : "149.172.138.41",
          "http_status_code" : "301",
          "bytes_sent" : "624",
          "time" : "2017-11-18 08:48:20",
          "cookie" : "-",
          "method" : "GET",
          "@timestamp" : "2017-11-18T06:48:20.000Z",
          "protocol_substatus_code" : "0",
          "win32_status" : "0",
          "port" : "443"
        }
While not as popular as MySQL, the MongoDB database engine still has a fairly significant market share and is used by many leading companies. The MongoDB logs can help us track the database performance and resource utilization to help with troubleshooting and performance tuning.
Let’s see how a MongoDB log looks like: https://raw.githubusercontent.com/coralogix-resources/logstash/master/mongodb/mongodb.log.

We can see fields are structured in a less repetitive and predictable way than in a typical Nginx log.
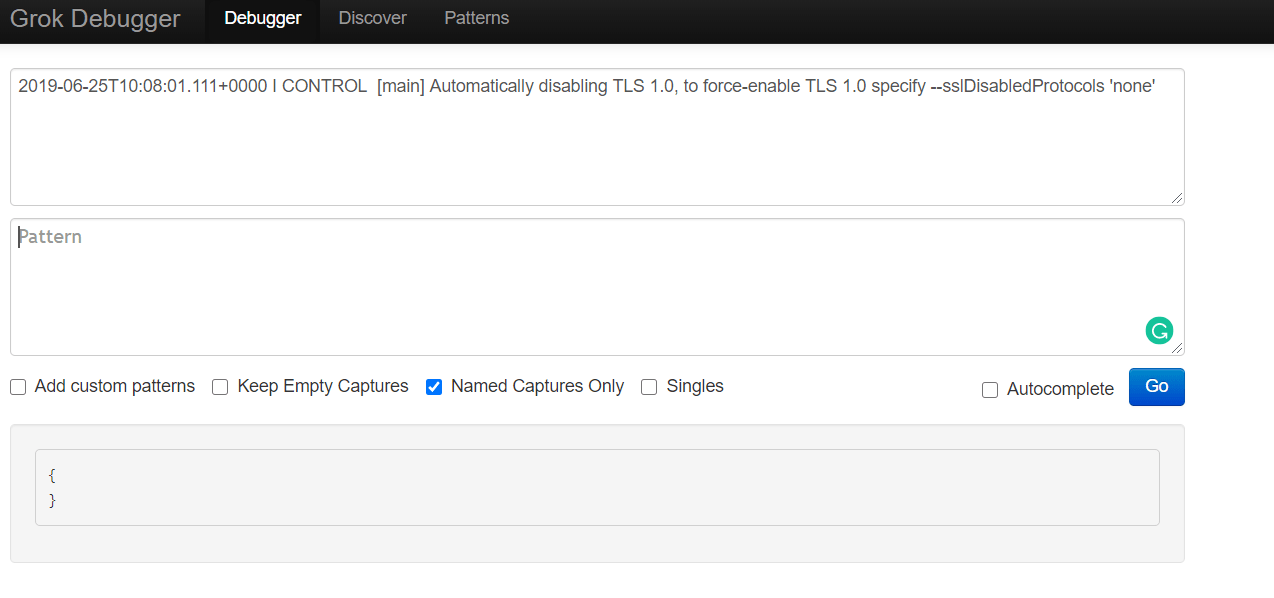
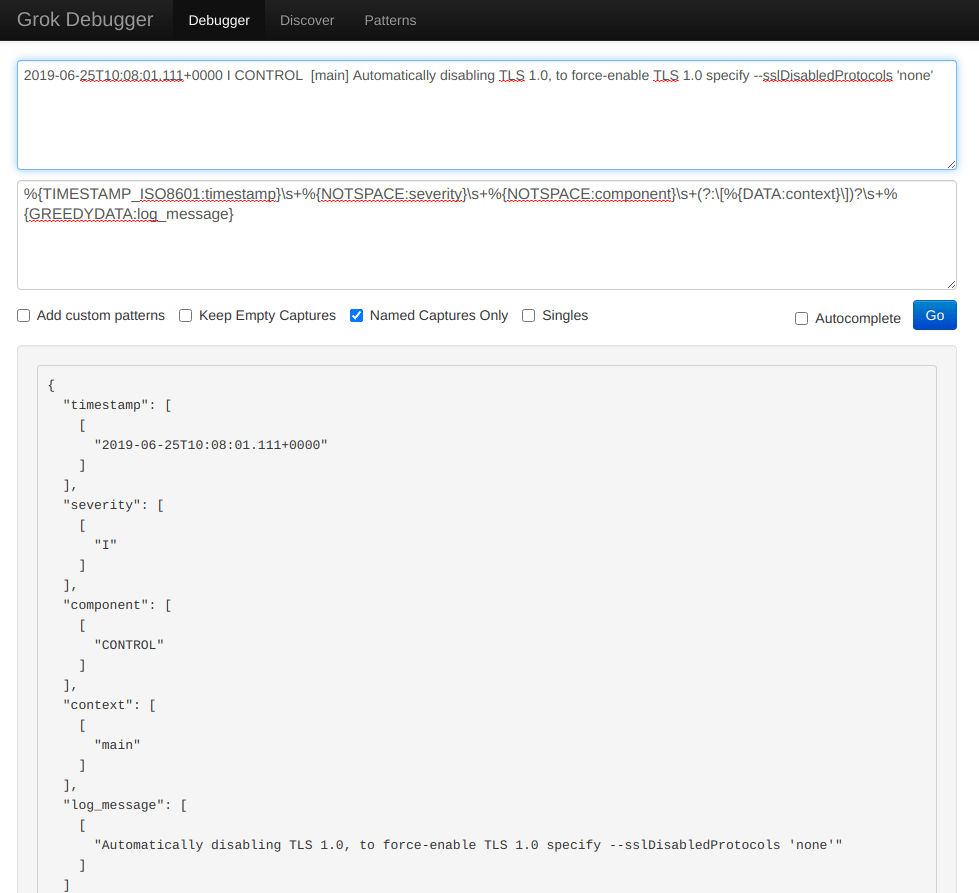
Let’s copy the first line from the log and paste it into the first field of the Grok Debugger Tool website.
2019-06-25T10:08:01.111+0000 I CONTROL [main] Automatically disabling TLS 1.0, to force-enable TLS 1.0 specify --sslDisabledProtocols 'none'
The config file we will use for Logstash, to parse our log, can be found at https://raw.githubusercontent.com/coralogix-resources/logstash/master/mongodb/mongodb-final.conf.
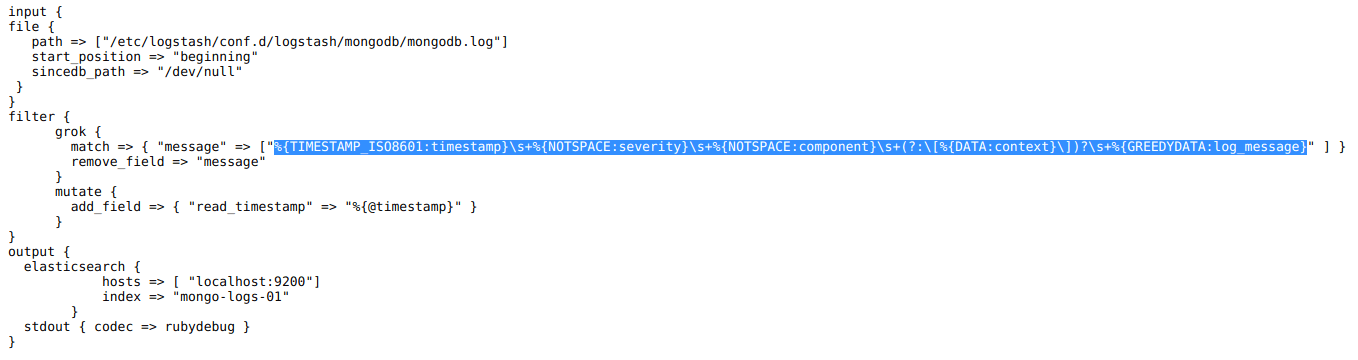
And here is the Grok pattern we need to copy:
%{TIMESTAMP_ISO8601:timestamp}\s+%{NOTSPACE:severity}\s+%{NOTSPACE:component}\s+(?:\[%{DATA:context}\])?\s+%{GREEDYDATA:log_message}
As usual, let’s paste it to the second field in the https://grokdebug.herokuapp.com/ website.
Let’s run Logstash:
sudo /usr/share/logstash/bin/logstash -f /etc/logstash/conf.d/logstash/mongodb/mongodb-final.conf
When the job is done, we press CTRL+C to exit the program and then we can take a look at how the data was parsed:
curl -XGET "http://localhost:9200/mongo-logs-01/_search?pretty" -H 'Content-Type: application/json' -d'{
  "size": 1,
  "track_total_hits": true,
  "query": {
    "bool": {
      "must_not": [
        {
          "term": {
            "tags.keyword": "_grokparsefailure"
          }
        }
      ]
    }
  }
}'
The output should be similar to the following:
      {
        "_index" : "mongo-logs-01",
        "_type" : "_doc",
        "_id" : "0vjo2XIBB7MjzkVPS6y9",
        "_score" : 0.0,
        "_source" : {
          "log_message" : "Automatically disabling TLS 1.0, to force-enable TLS 1.0 specify --sslDisabledProtocols 'none'",
          "@timestamp" : "2020-06-22T02:42:58.604Z",
          "timestamp" : "2019-06-25T10:08:01.111+0000",
          "context" : "main",
          "component" : "CONTROL",
          "read_timestamp" : "2020-06-22T02:42:58.604Z",
          "@version" : "1",
          "path" : "/etc/logstash/conf.d/logstash/mongodb/mongodb.log",
          "host" : "coralogix",
          "severity" : "I"
        }
Very often, when a web browser requests a web page from a web server, it also sends a so-called “user agent”. This can contain information such as the operating system used by a user, the device, the web browser name and version and so on. Obviously, this can be very useful data in certain scenarios. For example, it can help you find out if users of a particular operating system are experiencing issues.
Web servers also log the IP addresses of the visitors. While that’s useful to have in raw logs, those numbers themselves are not always useful to humans. They might be nice to have when trying to debug connectivity issues, or block a class of IPs, but for statistics and charts, it might be more relevant to have the geographic location of each IP, like country/city and so on.
Logstash can “transform” user agents like
Mozilla/5.0+(Windows+NT+10.0;+Win64;+x64)+AppleWebKit/537.36+(KHTML,+like+Gecko)+Chrome/62.0.3202.89+Safari/537.36+OPR/49.0.2725.39
to the actual names of the specific operating system, device and/or browser that was used, and other info which is much more easy to read and understand by humans. Likewise, IP addresses can be transformed to estimated geographical locations. The technical term for these transformations is mapping.
Let’s take a look at an Apache access log: https://raw.githubusercontent.com/coralogix-resources/logstash/master/apache/access_log.
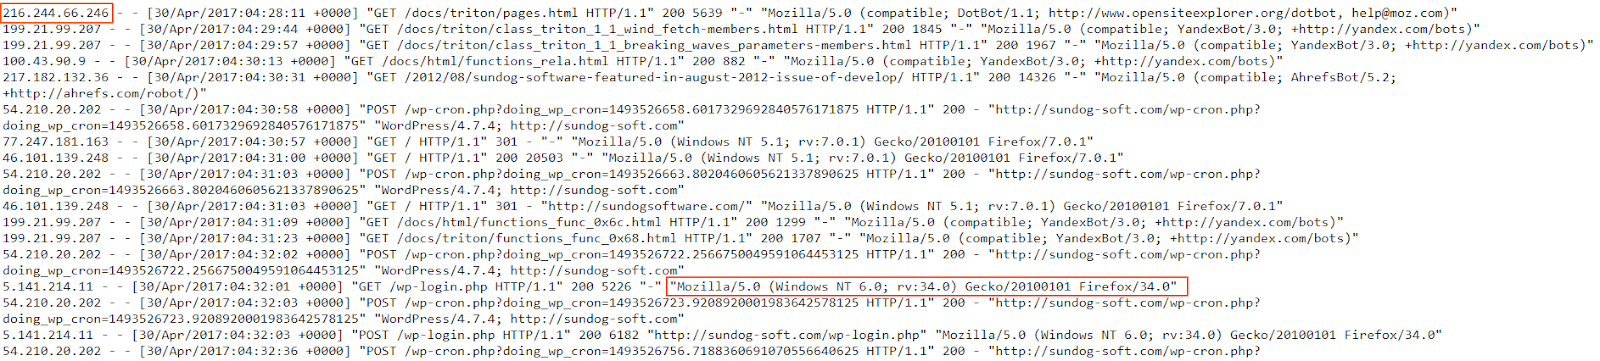
We notice IP addresses and user agents all throughout the log. Now let’s see the Logstash config we’ll use to do our mapping magic with this information: https://raw.githubusercontent.com/coralogix-resources/logstash/master/apache/apache-access-enriched.conf.
The interesting entries here can be seen under “useragent” and “geoip“.
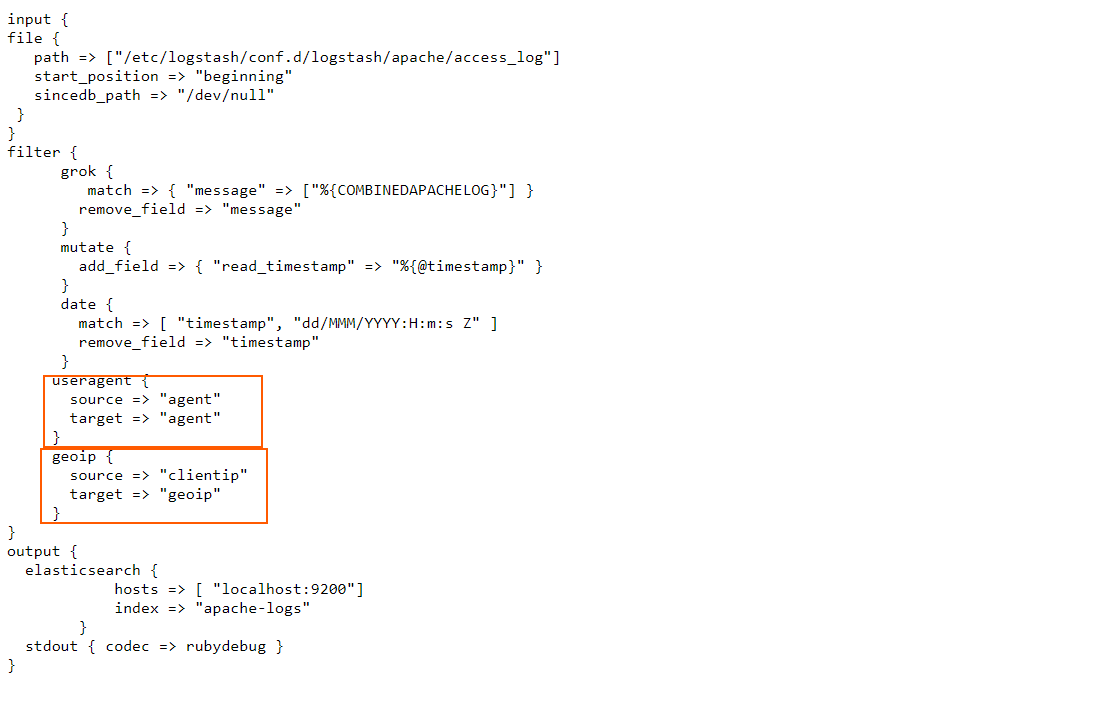
In the useragent filter section, we simply instruct Logstash to take the contents of the agent field, process them accordingly, and map them back to the agent field.
In the geoip filter, we instruct Logstash to take the information from the clientip field, process it, and then insert the output in a new field, called geoip.
Let’s run Logstash with this config and see what happens:
sudo /usr/share/logstash/bin/logstash -f /etc/logstash/conf.d/logstash/apache/apache-access-enriched.conf
We’ll need to wait for a longer period of time for this to be done as there are many more lines the utility has to process (tens of thousands). As usual, when it’s done, we’ll press CTRL+C to exit.
Now let’s explore how this log was parsed and what was inserted to the index:
curl -XGET "http://localhost:9200/apache-logs/_search?pretty" -H 'Content-Type: application/json' -d'{
  "size": 1,
  "track_total_hits": true,
  "query": {
  "bool": {
    "must_not": [
      {
        "term": {
          "tags.keyword": "_grokparsefailure"
        }
      }
    ]
  }
  }
}'
The output will be similar to the following:
      {
        "_index" : "apache-logs",
        "_type" : "_doc",
        "_id" : "4vgC2nIBB7MjzkVPhtPl",
        "_score" : 0.0,
        "_source" : {
          "verb" : "GET",
          "host" : "coralogix",
          "response" : "200",
          "agent" : {
            "name" : "Firefox",
            "build" : "",
            "device" : "Other",
            "os" : "Windows",
            "major" : "34",
            "minor" : "0",
            "os_name" : "Windows"
          },
          "clientip" : "178.150.5.107",
          "ident" : "-",
          "bytes" : "5226",
          "geoip" : {
            "continent_code" : "EU",
            "timezone" : "Europe/Kiev",
            "country_code3" : "UA",
            "country_name" : "Ukraine",
            "location" : {
              "lat" : 50.4547,
              "lon" : 30.5238
            },
            "region_name" : "Kyiv City",
            "city_name" : "Kyiv",
            "country_code2" : "UA",
            "ip" : "178.150.5.107",
            "postal_code" : "04128",
            "longitude" : 30.5238,
            "region_code" : "30",
            "latitude" : 50.4547
          },
          "referrer" : "\"-\"",
          "auth" : "-",
          "httpversion" : "1.1",
          "read_timestamp" : "2020-06-22T03:11:37.715Z",
          "path" : "/etc/logstash/conf.d/logstash/apache/access_log",
          "@timestamp" : "2017-04-30T19:16:43.000Z",
          "request" : "/wp-login.php",
          "@version" : "1"
        }
      }
Looking good. We can see the newly added geoip and agent fields are very detailed and very easy to read.
We explored many log types, but let’s not forget, Elasticsearch generates logs too which helps us troubleshooting issues, like for example, figuring out why a node hasn’t started. Let’s look at a sample: https://raw.githubusercontent.com/coralogix-resources/logstash/master/elasticsearch_logs/elasticsearch.log.
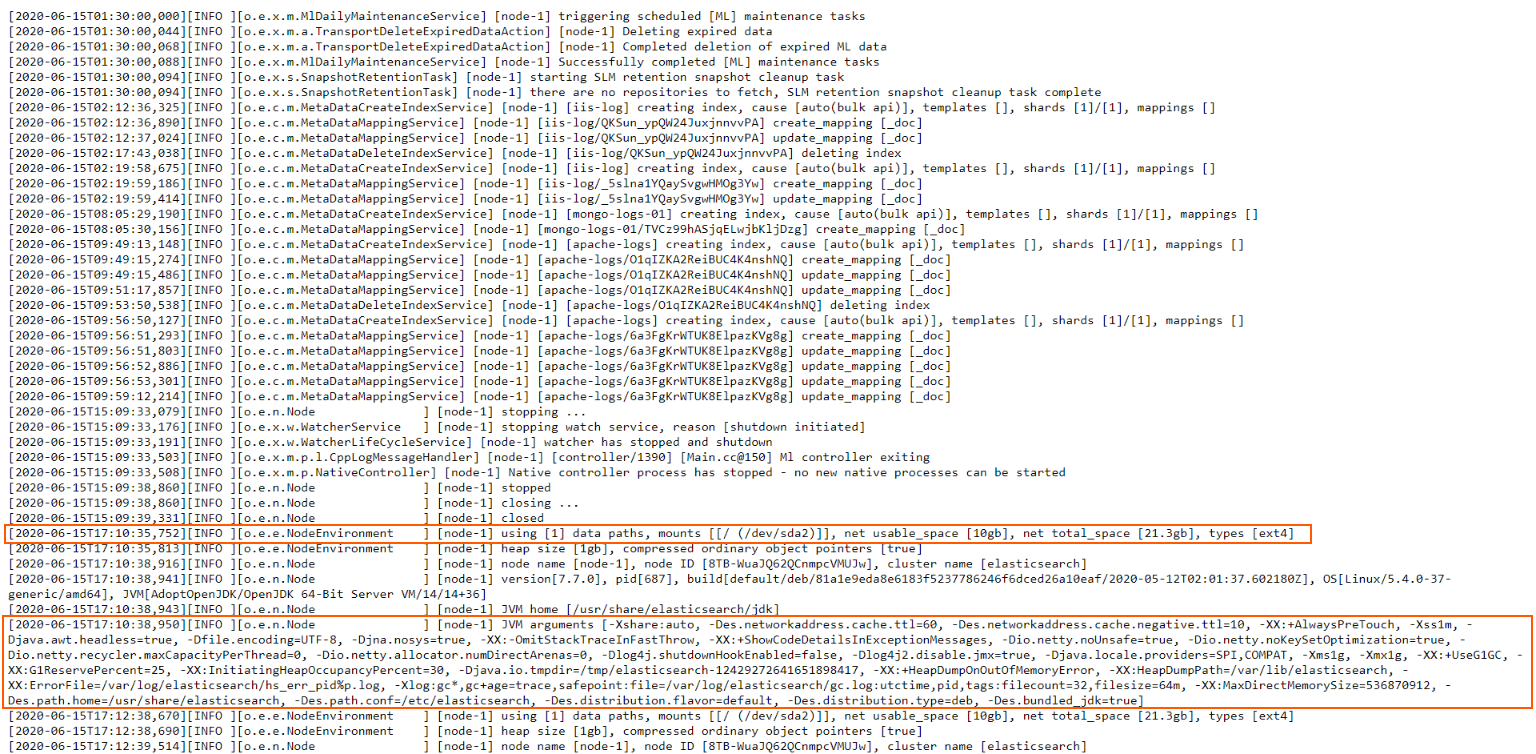
Now, this is slightly different from what we’ve worked with up until now. In all the other logs, each line represented one specific log entry (or message). That meant we could process them line by line and reasonably expect that each logged event is contained within a single line, in its entirety.
Here, however, we sometimes encounter multi-line log entries. This means that a logged event can span across multiple lines, not just one. Fortunately, though, Elasticsearch clearly signals where a logged event begins and where it ends. It does so by using opening [ and closing ] square brackets. If you see that a line opens a square bracket [ but doesn’t close it on the same line, you know that’s a multi-line log entry and it ends on the line that finally uses the closing square bracket ].
Logstash can easily process these logs by using the multiline input codec.
Let’s take a look at the Logstash config we’ll use here: https://raw.githubusercontent.com/coralogix-resources/logstash/master/elasticsearch_logs/es-logs-final.conf.
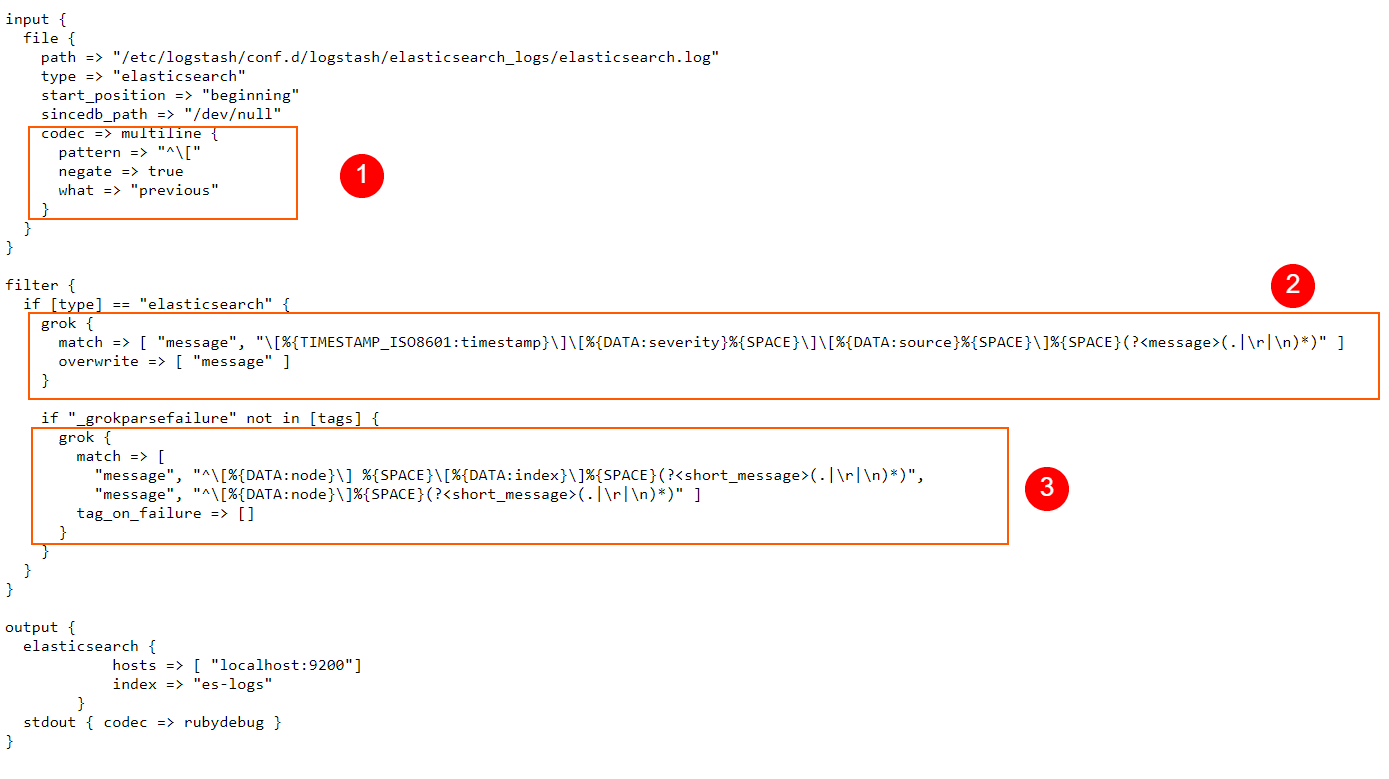
In the codec => multiline section of our config, we define the pattern that instructs Logstash on how to identify multiline log entries. Here, we use a RegEx pattern, but of course, we can also use Grok patterns when we need to.
With negate set to true, a message that matches the pattern is not considered a match for the multiline filter. By default, this is set to false and when it is false, a message that matches the pattern is considered a match for multiline.
“what” can be assigned a value of “previous” or “next“. For example, if we have a match, negate is set to false, and what has a value set to previous, this means that the current matched line belongs to the same event as the previous line.
In a nutshell, what we are doing for our scenario here is telling Logstash that if a line does not start with an opening square bracket [ then the line in the log file is a continuation of the previous line, so these will be grouped in a single event. Logstash will apply a “multiline” tag to such entries, which can be useful for debugging, or other similar purposes if we ever need to know which entry was contained in a single line, and which on multiple lines.
In the filter section we use a typical Grok pattern, just like we did many times before, and replace the message field with the parsed content.
Finally, a second Grok pattern will process the content in the message field even further, extracting things like the logged node name, index name, and so on.
Let’s run Logstash and see all of this in action:
sudo /usr/share/logstash/bin/logstash -f /etc/logstash/conf.d/logstash/elasticsearch_logs/es-logs-final.conf
After the program does its job, we press CTRL+C to exit.
Logstash has now parsed both single-line events and multiline events. We will now see how useful it can be that multiline events have been tagged appropriately. Because of this tag, we can now search entries that contain only single-line events. We do this by specifying in our cURL request that the matches must_not contain the tags called multiline.
curl -XGET "http://localhost:9200/es-test-logs/_search?pretty" -H 'Content-Type: application/json' -d'{
  "size": 1,
  "query": {
    "bool": {
      "must_not": [
        {
          "match": {
            "tags": "multiline"
          }
        }
      ]
    }
  }
}'
The output will look something like this:
      {
        "_index" : "es-test-logs",
        "_type" : "_doc",
        "_id" : "9voa2nIBB7MjzkVP7ULy",
        "_score" : 0.0,
        "_source" : {
          "node" : "node-1",
          "source" : "o.e.x.m.MlDailyMaintenanceService",
          "host" : "coralogix",
          "@timestamp" : "2020-06-22T03:38:16.842Z",
          "@version" : "1",
          "message" : "[node-1] triggering scheduled [ML] maintenance tasks",
          "timestamp" : "2020-06-15T01:30:00,000",
          "short_message" : "triggering scheduled [ML] maintenance tasks",
          "type" : "elasticsearch",
          "severity" : "INFO",
          "path" : "/etc/logstash/conf.d/logstash/elasticsearch_logs/elasticsearch.log"
        }
Now let’s filter only the multiline entries:
curl -XGET "http://localhost:9200/es-test-logs/_search?pretty" -H 'Content-Type: application/json' -d'{
  "size": 1,
  "query": {
    "bool": {
      "must": [
        {
          "match": {
            "tags": "multiline"
          }
        }
      ]
    }
  }
}'
Output should look similar to this:
      {
        "_index" : "es-test-logs",
        "_type" : "_doc",
        "_id" : "Kfoa2nIBB7MjzkVP7UPy",
        "_score" : 0.046520013,
        "_source" : {
          "node" : "node-1",
          "source" : "r.suppressed",
          "host" : "coralogix",
          "@timestamp" : "2020-06-22T03:38:16.968Z",
          "@version" : "1",
          "message" : "[node-1] path: /.kibana/_count, params: {index=.kibana}\norg.elasticsearch.action.search.SearchPhaseExecutionException: all shards failed\n\tat org.elasticsearch.action.search.AbstractSearchAsyncAction.onPhaseFailure(AbstractSearchAsyncAction.java:551) [elasticsearch-7.7.0.jar:7.7.0]\n\tat org.elasticsearch.action.search.AbstractSearchAsyncAction.executeNextPhase(AbstractSearchAsyncAction.java:309) [elasticsearch-7.7.0.jar:7.7.0]\n\tat org.elasticsearch.action.search.AbstractSearchAsyncAction.onPhaseDone(AbstractSearchAsyncAction.java:580) [elasticsearch-7.7.0.jar:7.7.0]\n\tat org.elasticsearch.action.search.AbstractSearchAsyncAction.onShardFailure(AbstractSearchAsyncAction.java:393) [elasticsearch-7.7.0.jar:7.7.0]\n\tat org.elasticsearch.action.search.AbstractSearchAsyncAction.lambda$performPhaseOnShard$0(AbstractSearchAsyncAction.java:223) [elasticsearch-7.7.0.jar:7.7.0]\n\tat org.elasticsearch.action.search.AbstractSearchAsyncAction$2.doRun(AbstractSearchAsyncAction.java:288) [elasticsearch-7.7.0.jar:7.7.0]\n\tat org.elasticsearch.common.util.concurrent.AbstractRunnable.run(AbstractRunnable.java:37) [elasticsearch-7.7.0.jar:7.7.0]\n\tat org.elasticsearch.common.util.concurrent.TimedRunnable.doRun(TimedRunnable.java:44) [elasticsearch-7.7.0.jar:7.7.0]\n\tat org.elasticsearch.common.util.concurrent.ThreadContext$ContextPreservingAbstractRunnable.doRun(ThreadContext.java:692) [elasticsearch-7.7.0.jar:7.7.0]\n\tat org.elasticsearch.common.util.concurrent.AbstractRunnable.run(AbstractRunnable.java:37) [elasticsearch-7.7.0.jar:7.7.0]\n\tat java.util.concurrent.ThreadPoolExecutor.runWorker(ThreadPoolExecutor.java:1130) [?:?]\n\tat java.util.concurrent.ThreadPoolExecutor$Worker.run(ThreadPoolExecutor.java:630) [?:?]\n\tat java.lang.Thread.run(Thread.java:832) [?:?]",
          "timestamp" : "2020-06-15T17:13:35,457",
          "short_message" : "path: /.kibana/_count, params: {index=.kibana}\norg.elasticsearch.action.search.SearchPhaseExecutionException: all shards failed\n\tat org.elasticsearch.action.search.AbstractSearchAsyncAction.onPhaseFailure(AbstractSearchAsyncAction.java:551) [elasticsearch-7.7.0.jar:7.7.0]\n\tat org.elasticsearch.action.search.AbstractSearchAsyncAction.executeNextPhase(AbstractSearchAsyncAction.java:309) [elasticsearch-7.7.0.jar:7.7.0]\n\tat org.elasticsearch.action.search.AbstractSearchAsyncAction.onPhaseDone(AbstractSearchAsyncAction.java:580) [elasticsearch-7.7.0.jar:7.7.0]\n\tat org.elasticsearch.action.search.AbstractSearchAsyncAction.onShardFailure(AbstractSearchAsyncAction.java:393) [elasticsearch-7.7.0.jar:7.7.0]\n\tat org.elasticsearch.action.search.AbstractSearchAsyncAction.lambda$performPhaseOnShard$0(AbstractSearchAsyncAction.java:223) [elasticsearch-7.7.0.jar:7.7.0]\n\tat org.elasticsearch.action.search.AbstractSearchAsyncAction$2.doRun(AbstractSearchAsyncAction.java:288) [elasticsearch-7.7.0.jar:7.7.0]\n\tat org.elasticsearch.common.util.concurrent.AbstractRunnable.run(AbstractRunnable.java:37) [elasticsearch-7.7.0.jar:7.7.0]\n\tat org.elasticsearch.common.util.concurrent.TimedRunnable.doRun(TimedRunnable.java:44) [elasticsearch-7.7.0.jar:7.7.0]\n\tat org.elasticsearch.common.util.concurrent.ThreadContext$ContextPreservingAbstractRunnable.doRun(ThreadContext.java:692) [elasticsearch-7.7.0.jar:7.7.0]\n\tat org.elasticsearch.common.util.concurrent.AbstractRunnable.run(AbstractRunnable.java:37) [elasticsearch-7.7.0.jar:7.7.0]\n\tat java.util.concurrent.ThreadPoolExecutor.runWorker(ThreadPoolExecutor.java:1130) [?:?]\n\tat java.util.concurrent.ThreadPoolExecutor$Worker.run(ThreadPoolExecutor.java:630) [?:?]\n\tat java.lang.Thread.run(Thread.java:832) [?:?]",
          "type" : "elasticsearch",
          "severity" : "WARN",
          "tags" : [
            "multiline"
          ],
          "path" : "/etc/logstash/conf.d/logstash/elasticsearch_logs/elasticsearch.log"
        }
Elasticsearch can also generate another type of logs, called slow logs and are used to optimize Elasticsearch search and indexing operations. These are easier to process since they don’t contain multiline messages.
Let’s take a look at a slow log: https://raw.githubusercontent.com/coralogix-resources/logstash/master/elasticsearch_slowlogs/es_slowlog.log.
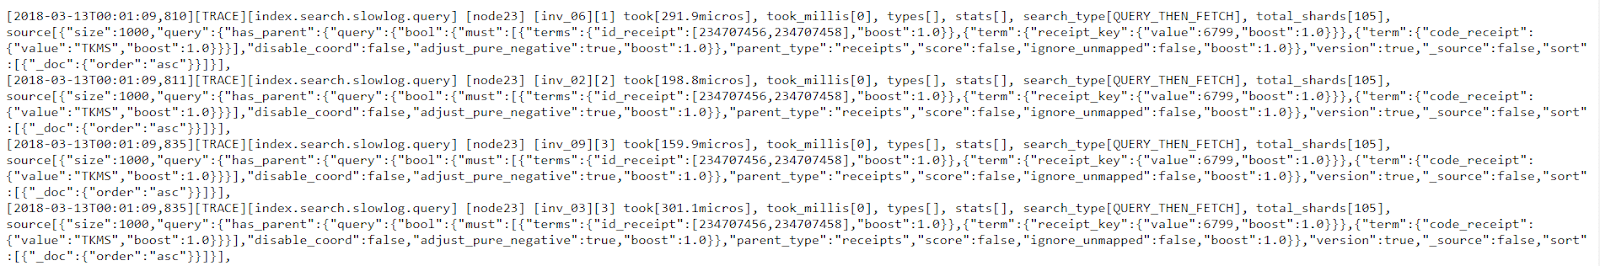
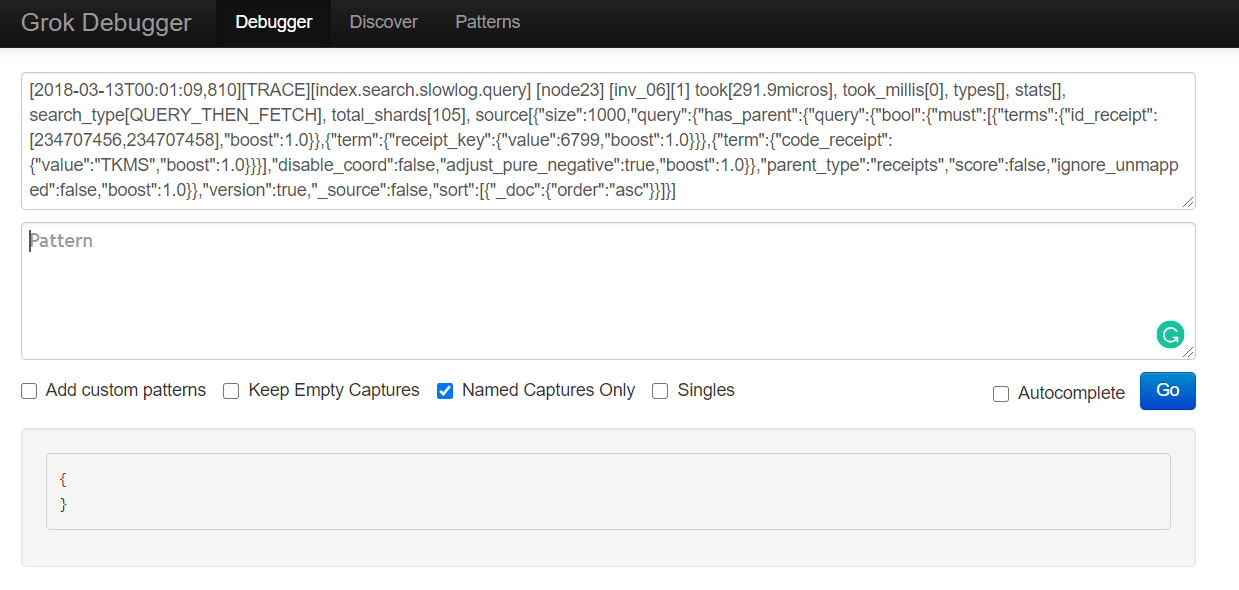
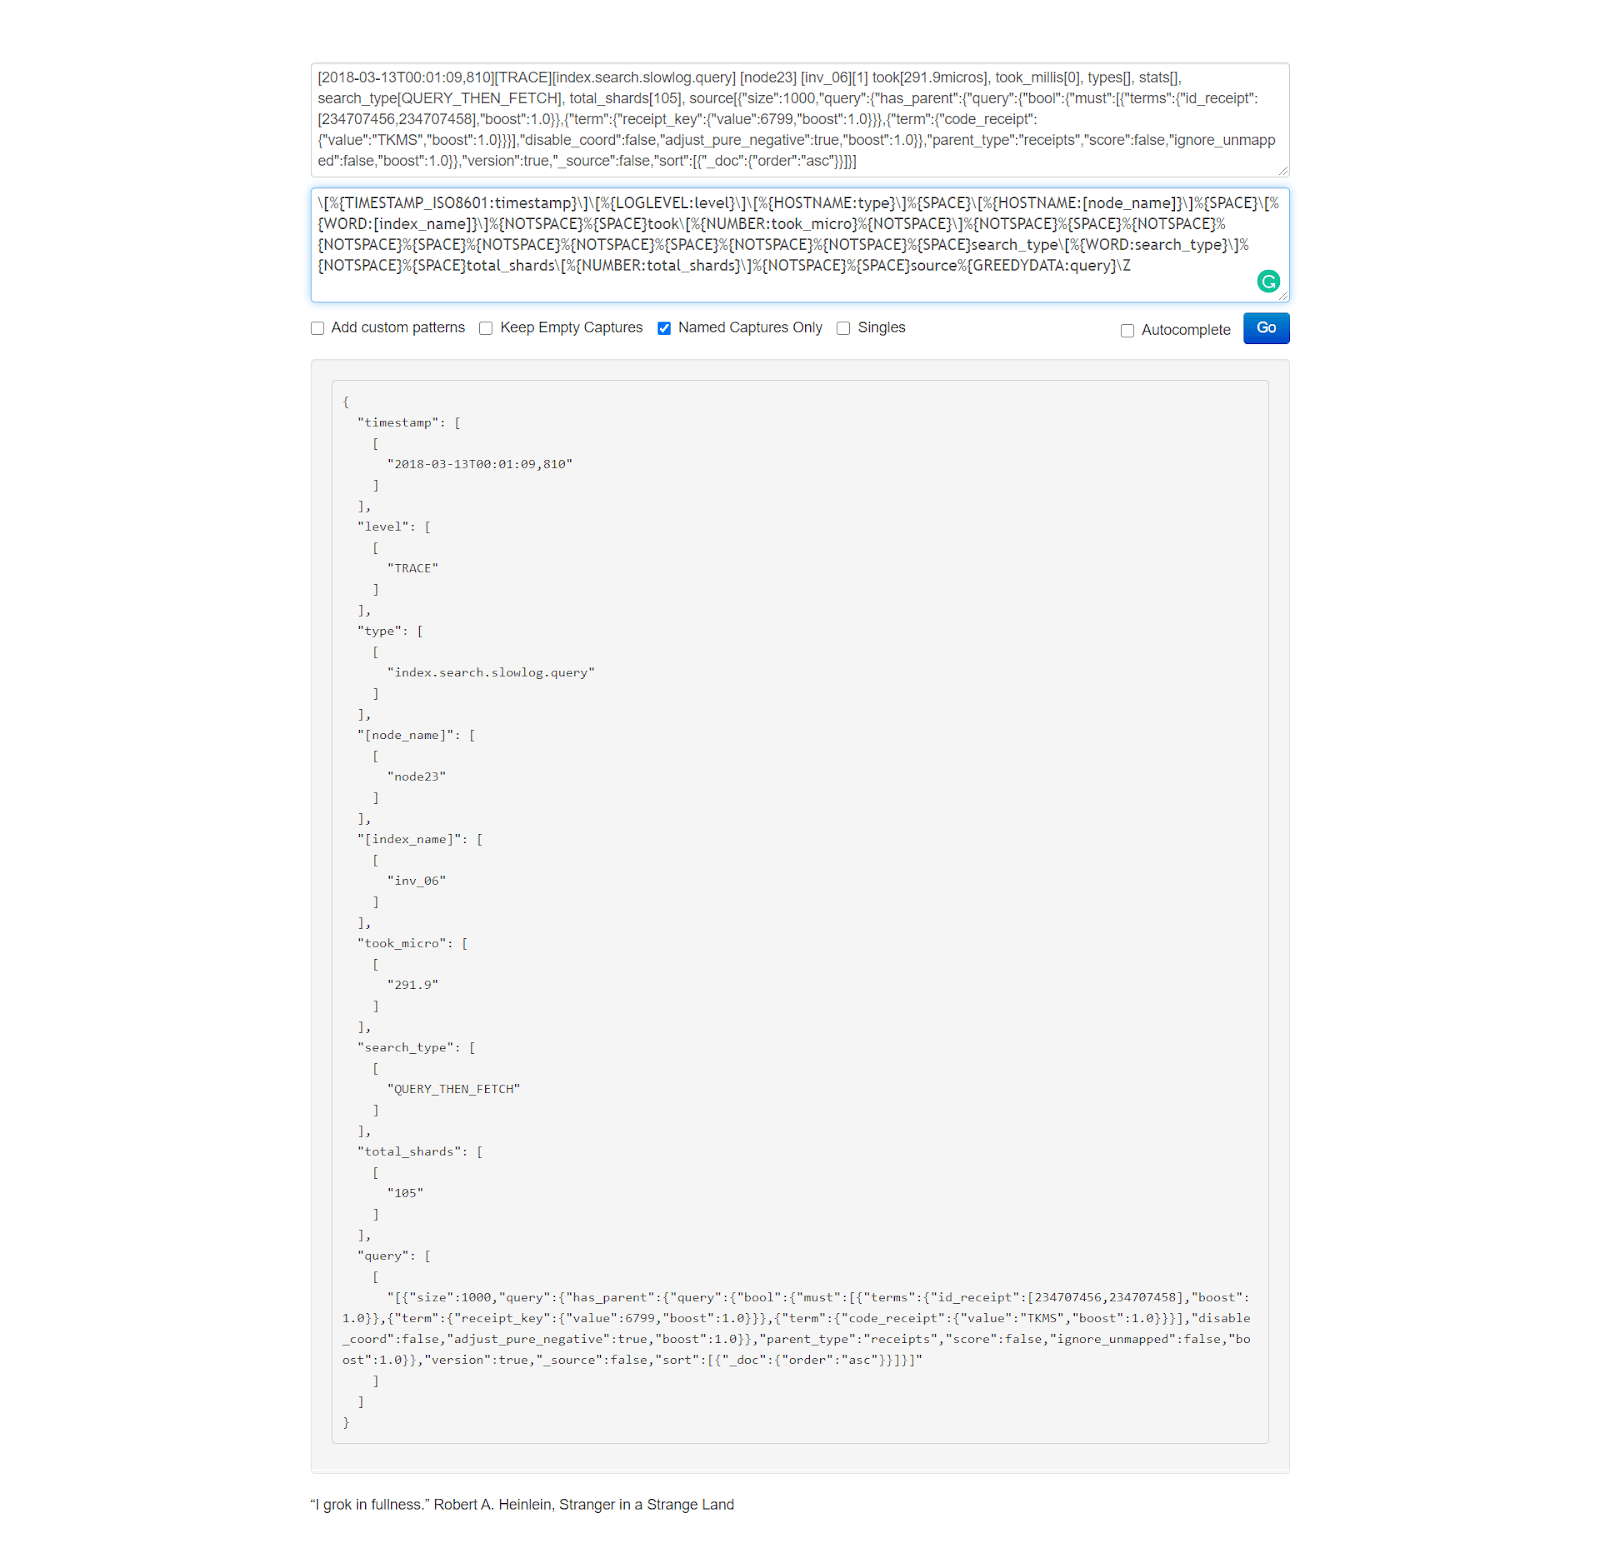
As we did in previous sections, let’s copy the first line and paste it into the first (input) field of the https://grokdebug.herokuapp.com/ website.
[2018-03-13T00:01:09,810][TRACE][index.search.slowlog.query] [node23] [inv_06][1] took[291.9micros], took_millis[0], types[], stats[], search_type[QUERY_THEN_FETCH], total_shards[105], source[{"size":1000,"query":{"has_parent":{"query":{"bool":{"must":[{"terms":{"id_receipt":[234707456,234707458],"boost":1.0}},{"term":{"receipt_key":{"value":6799,"boost":1.0}}},{"term":{"code_receipt":{"value":"TKMS","boost":1.0}}}],"disable_coord":false,"adjust_pure_negative":true,"boost":1.0}},"parent_type":"receipts","score":false,"ignore_unmapped":false,"boost":1.0}},"version":true,"_source":false,"sort":[{"_doc":{"order":"asc"}}]}],
Now let’s take a look at the Logstash config we’ll use: https://raw.githubusercontent.com/coralogix-resources/logstash/master/elasticsearch_slowlogs/es-slowlog-final.conf.
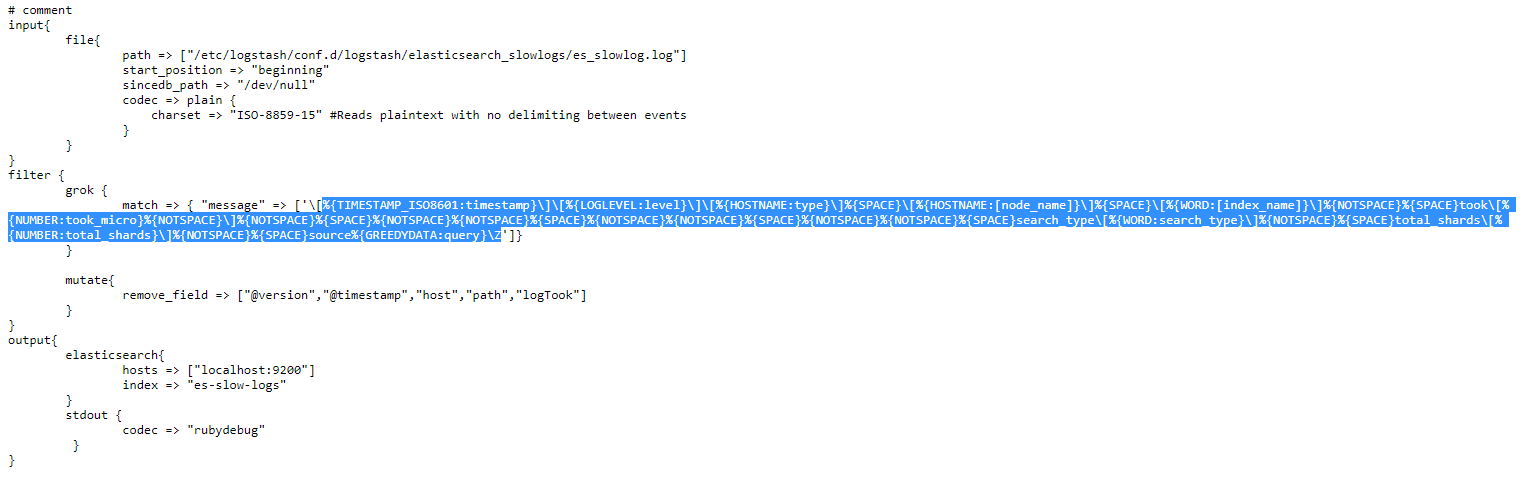
Let’s copy the Grok pattern within this config and paste it to the second (pattern) field of the https://grokdebug.herokuapp.com/ website.
%{TIMESTAMP_ISO8601:timestamp}\]\[%{LOGLEVEL:level}\]\[%{HOSTNAME:type}\]%{SPACE}\[%{HOSTNAME:[node_name]}\]%{SPACE}\[%{WORD:[index_name]}\]%{NOTSPACE}%{SPACE}took\[%{NUMBER:took_micro}%{NOTSPACE}\]%{NOTSPACE}%{SPACE}%{NOTSPACE}%{NOTSPACE}%{SPACE}%{NOTSPACE}%{NOTSPACE}%{SPACE}%{NOTSPACE}%{NOTSPACE}%{SPACE}search_type\[%{WORD:search_type}\]%{NOTSPACE}%{SPACE}total_shards\[%{NUMBER:total_shards}\]%{NOTSPACE}%{SPACE}source%{GREEDYDATA:query}\Z
Now that we saw how this Grok pattern works, let’s run Logstash with our new config file.
sudo /usr/share/logstash/bin/logstash -f /etc/logstash/conf.d/logstash/elasticsearch_slowlogs/es-slowlog-final.conf
As usual, once the parsing is done, we press CTRL+C to exit the application.
Let’s see how the log file was parsed and added to the index:
curl -XGET "http://localhost:9200/es-slow-logs/_search?pretty" -H 'Content-Type: application/json' -d'{ "size": 1}'
The output will look something like this:
      {
        "_index" : "es-slow-logs",
        "_type" : "_doc",
        "_id" : "e-JzvHIBocjiYgvgqO4l",
        "_score" : 1.0,
        "_source" : {
          "total_shards" : "105",
          "message" : """[2018-03-13T00:01:09,810][TRACE][index.search.slowlog.query] [node23] [inv_06][1] took[291.9micros], took_millis[0], types[], stats[], search_type[QUERY_THEN_FETCH], total_shards[105], source[{"size":1000,"query":{"has_parent":{"query":{"bool":{"must":[{"terms":{"id_receipt":[234707456,234707458],"boost":1.0}},{"term":{"receipt_key":{"value":6799,"boost":1.0}}},{"term":{"code_receipt":{"value":"TKMS","boost":1.0}}}],"disable_coord":false,"adjust_pure_negative":true,"boost":1.0}},"parent_type":"receipts","score":false,"ignore_unmapped":false,"boost":1.0}},"version":true,"_source":false,"sort":[{"_doc":{"order":"asc"}}]}], """,
          "node_name" : "node23",
          "index_name" : "inv_06",
          "level" : "TRACE",
          "type" : "index.search.slowlog.query",
          "took_micro" : "291.9",
          "timestamp" : "2018-03-13T00:01:09,810",
          "query" : """[{"size":1000,"query":{"has_parent":{"query":{"bool":{"must":[{"terms":{"id_receipt":[234707456,234707458],"boost":1.0}},{"term":{"receipt_key":{"value":6799,"boost":1.0}}},{"term":{"code_receipt":{"value":"TKMS","boost":1.0}}}],"disable_coord":false,"adjust_pure_negative":true,"boost":1.0}},"parent_type":"receipts","score":false,"ignore_unmapped":false,"boost":1.0}},"version":true,"_source":false,"sort":[{"_doc":{"order":"asc"}}]}], """,
          "search_type" : "QUERY_THEN_FETCH"
        }
      }
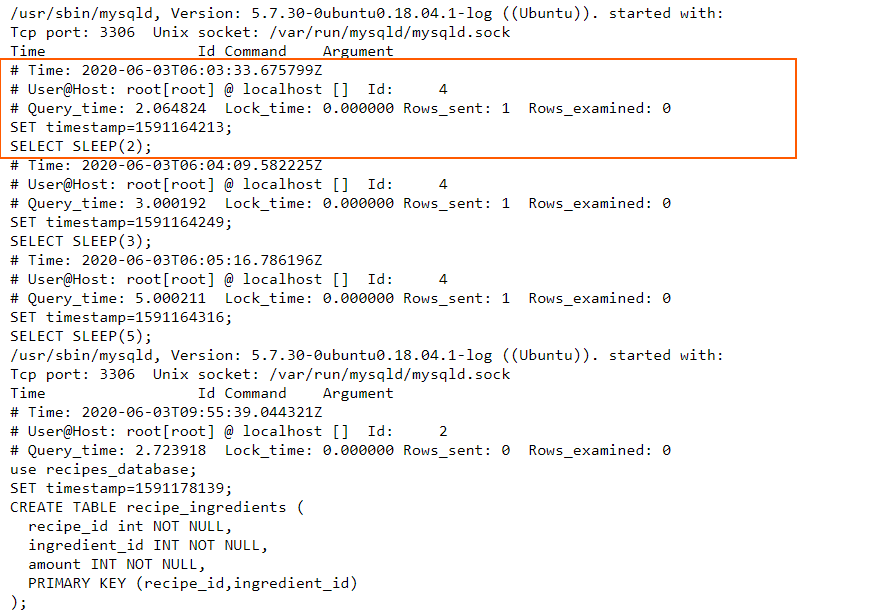
MySQL can also generate slow logs to help with optimization efforts. However, these will log events on multiple lines so we’ll need to use the multiline codec again.
Let’s look at a log file: https://raw.githubusercontent.com/coralogix-resources/logstash/master/mysql_slowlogs/mysql-slow.log.
Now let’s look at the Logstash config file: https://raw.githubusercontent.com/coralogix-resources/logstash/master/mysql_slowlogs/mysql-slowlogs.conf.
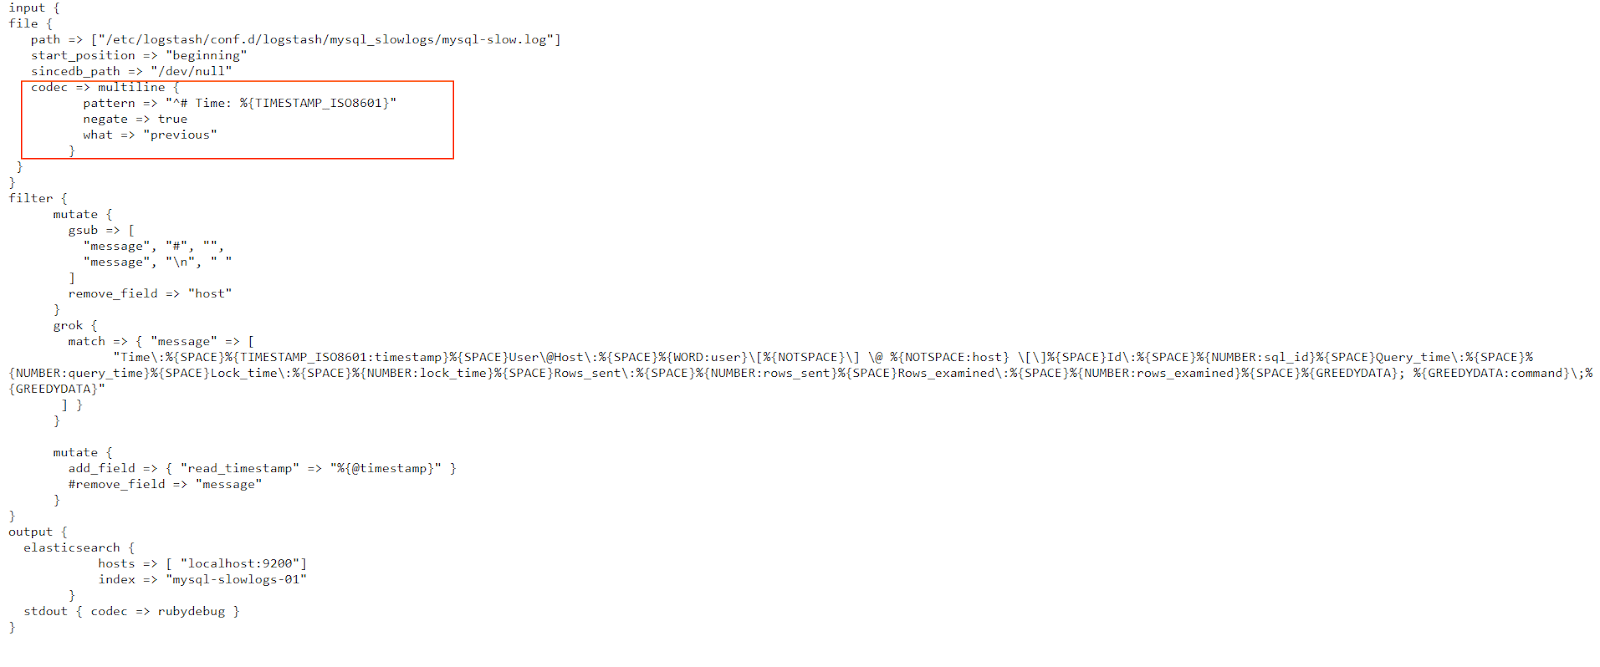
In the multiline codec configuration, we use a Grok pattern. Simply put, we instruct Logstash that if the line doesn’t begin with the “# Time:” string, followed by a timestamp in the TIMESTAMP_ISO8601 format, then this line should be grouped together with previous lines in this event. This makes sense, since all logged events in this slow log begin with that specific timestamp, and then describe what has happened at that time, in the next few lines. Consequently, whenever a new timestamp appears, it signals the end of the current logged event and the beginning of the next.
Let’s run Logstash with this config:
sudo /usr/share/logstash/bin/logstash -f /etc/logstash/conf.d/logstash/mysql_slowlogs/mysql-slowlogs.conf
As always, after the parsing is done, we press CTRL+C to exit the utility.
Let’s look at how the slow log was parsed:
curl -XGET "http://localhost:9200/mysql-slowlogs-01/_search?pretty" -H 'Content-Type: application/json' -d'{

  "size":1,
  "query": {
    "bool": {
    "must_not": [
      {
        "term": {
          "tags.keyword": "_grokparsefailure"
        }
      }
    ]
  }
  }

}'
The output should look like this:
      {
        "_index" : "mysql-slowlogs-01",
        "_type" : "_doc",
        "_id" : "Zfo42nIBB7MjzkVPGUfK",
        "_score" : 0.0,
        "_source" : {
          "tags" : [
            "multiline"
          ],
          "host" : "localhost",
          "user" : "root",
          "lock_time" : "0.000000",
          "timestamp" : "2020-06-03T06:04:09.582225Z",
          "read_timestamp" : "2020-06-22T04:10:08.892Z",
          "message" : " Time: 2020-06-03T06:04:09.582225Z  User@Host: root[root] @ localhost []  Id:     4  Query_time: 3.000192  Lock_time: 0.000000 Rows_sent: 1  Rows_examined: 0 SET timestamp=1591164249; SELECT SLEEP(3);",
          "query_time" : "3.000192",
          "rows_examined" : "0",
          "path" : "/etc/logstash/conf.d/logstash/mysql_slowlogs/mysql-slow.log",
          "sql_id" : "4",
          "@version" : "1",
          "rows_sent" : "1",
          "@timestamp" : "2020-06-22T04:10:08.892Z",
          "command" : "SELECT SLEEP(3)"
        }
      }
AWS Elastic Load Balancer is a popular service that intelligently distributes traffic across a number of instances. ELB provides access logs that capture detailed information about requests sent to your load balancer. Each ELB log contains information such as the time the request was received, the client’s IP address, latencies, request paths, and server responses.
Let’s look at an example of such a log: https://raw.githubusercontent.com/coralogix-resources/logstash/master/aws_elb/elb_logs.log

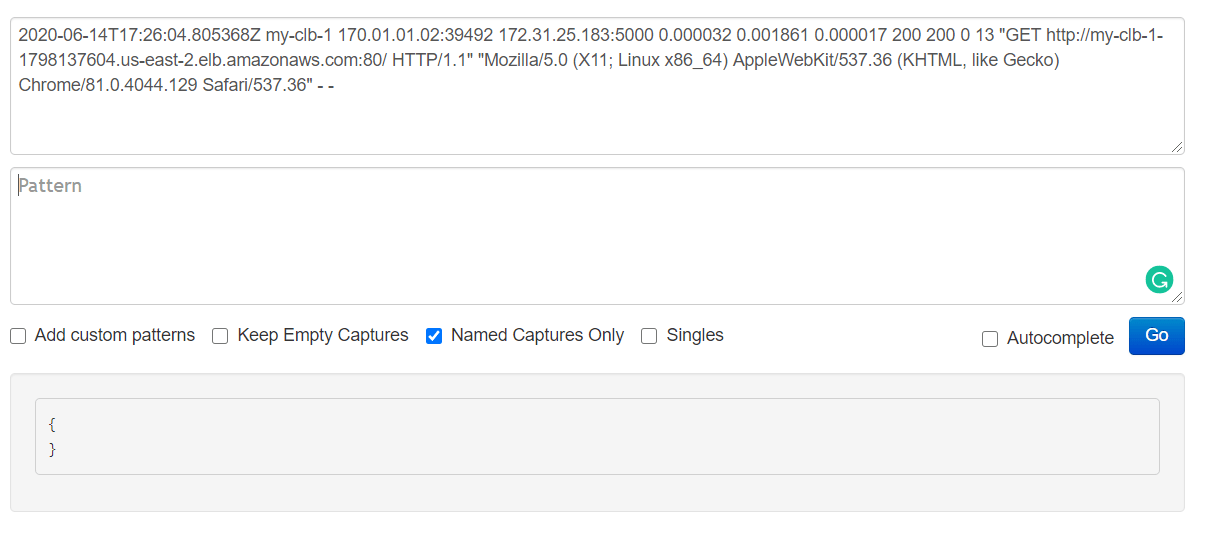
Once again, let’s copy the first line of this log and paste it into the first (input) field of the https://grokdebug.herokuapp.com/ website.
2020-06-14T17:26:04.805368Z my-clb-1 170.01.01.02:39492 172.31.25.183:5000 0.000032 0.001861 0.000017 200 200 0 13 "GET http://my-clb-1-1798137604.us-east-2.elb.amazonaws.com:80/ HTTP/1.1" "Mozilla/5.0 (X11; Linux x86_64) AppleWebKit/537.36 (KHTML, like Gecko) Chrome/81.0.4044.129 Safari/537.36" - -
The Logstash config we’ll use is this one: https://raw.githubusercontent.com/coralogix-resources/logstash/master/aws_elb/aws-elb.conf.
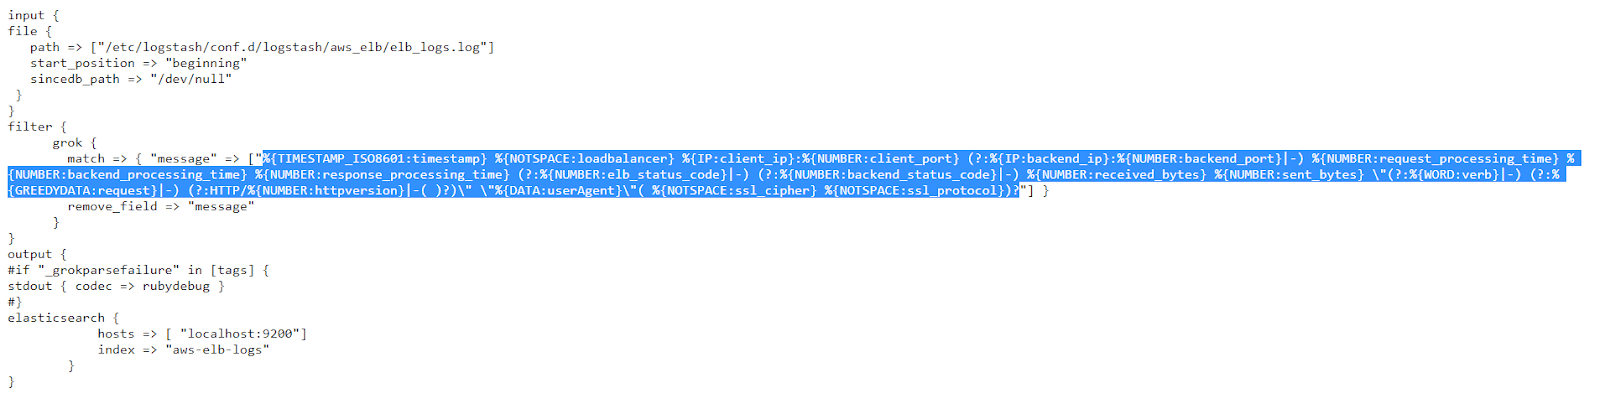
From this config, we can copy the Grok pattern and paste it into the second (pattern) field of the https://grokdebug.herokuapp.com/ website.
%{TIMESTAMP_ISO8601:timestamp} %{NOTSPACE:loadbalancer} %{IP:client_ip}:%{NUMBER:client_port} (?:%{IP:backend_ip}:%{NUMBER:backend_port}|-) %{NUMBER:request_processing_time} %{NUMBER:backend_processing_time} %{NUMBER:response_processing_time} (?:%{NUMBER:elb_status_code}|-) (?:%{NUMBER:backend_status_code}|-) %{NUMBER:received_bytes} %{NUMBER:sent_bytes} \"(?:%{WORD:verb}|-) (?:%{GREEDYDATA:request}|-) (?:HTTP/%{NUMBER:httpversion}|-( )?)\" \"%{DATA:userAgent}\"( %{NOTSPACE:ssl_cipher} %{NOTSPACE:ssl_protocol})?
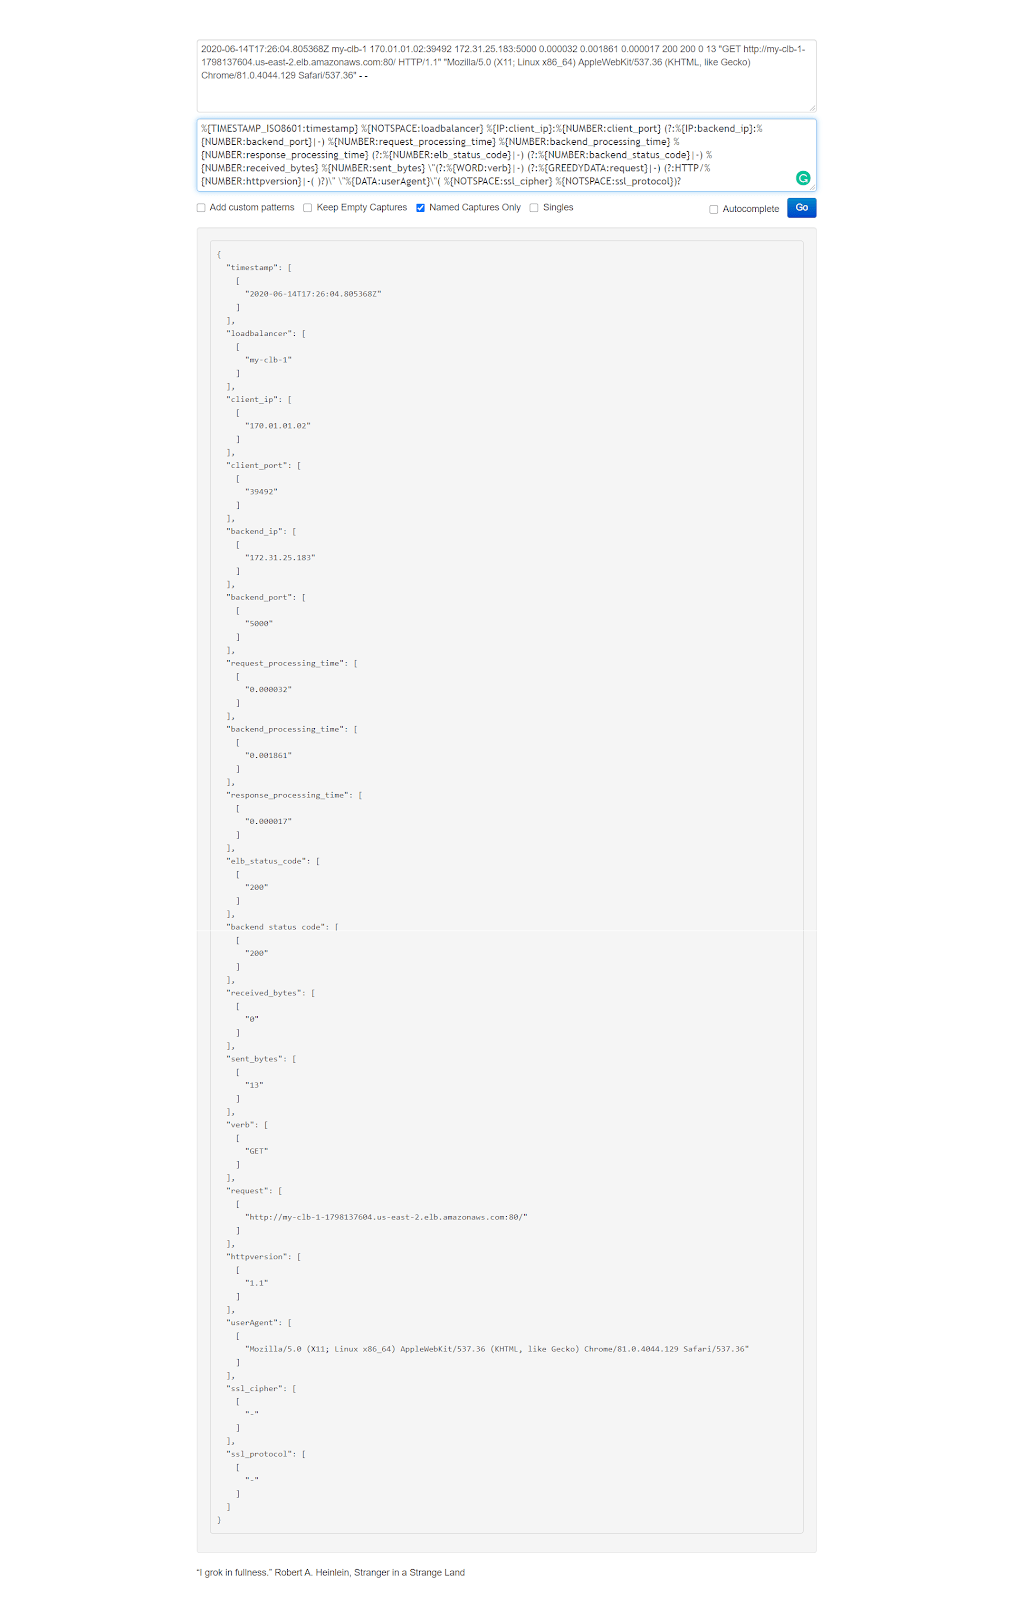
Let’s run Logstash:
sudo /usr/share/logstash/bin/logstash -f /etc/logstash/conf.d/logstash/aws_elb/aws-elb.conf
We press CTRL+C once it finishes its job and then take a look at the index to see how the log has been parsed:
curl -XGET "http://localhost:9200/aws-elb-logs/_search?pretty" -H 'Content-Type: application/json' -d'
{
  "size": 1,
  "query": {
    "bool": {
      "must_not": [
        {
        "term": {
          "tags": {
            "value": "_grokparsefailure"
          }
        }
      }
      ]
    }
  }
}'
The output should look similar to this:
      {
        "_index" : "aws-elb-logs",
        "_type" : "_doc",
        "_id" : "avpQ2nIBB7MjzkVPIEc-",
        "_score" : 0.0,
        "_source" : {
          "request_processing_time" : "0.000032",
          "timestamp" : "2020-06-14T17:26:05.145274Z",
          "sent_bytes" : "232",
          "@version" : "1",
          "userAgent" : "Mozilla/5.0 (X11; Linux x86_64) AppleWebKit/537.36 (KHTML, like Gecko) Chrome/81.0.4044.129 Safari/537.36",
          "elb_status_code" : "404",
          "ssl_protocol" : "-",
          "path" : "/etc/logstash/conf.d/logstash/aws_elb/elb_logs.log",
          "response_processing_time" : "0.000016",
          "backend_processing_time" : "0.002003",
          "client_port" : "39492",
          "verb" : "GET",
          "received_bytes" : "0",
          "backend_ip" : "172.31.25.183",
          "backend_status_code" : "404",
          "client_ip" : "170.01.01.02",
          "backend_port" : "5000",
          "host" : "coralogix",
          "loadbalancer" : "my-clb-1",
          "request" : "http://my-clb-1-1798137604.us-east-2.elb.amazonaws.com:80/favicon.ico",
          "ssl_cipher" : "-",
          "httpversion" : "1.1",
          "@timestamp" : "2020-06-22T04:36:23.160Z"
        }
      }
Amazon also offers an Application Load Balancer that generates its own logs. These are very similar to the ELB logs and we can see an example here: https://raw.githubusercontent.com/coralogix-resources/logstash/master/aws_alb/alb_logs.log.
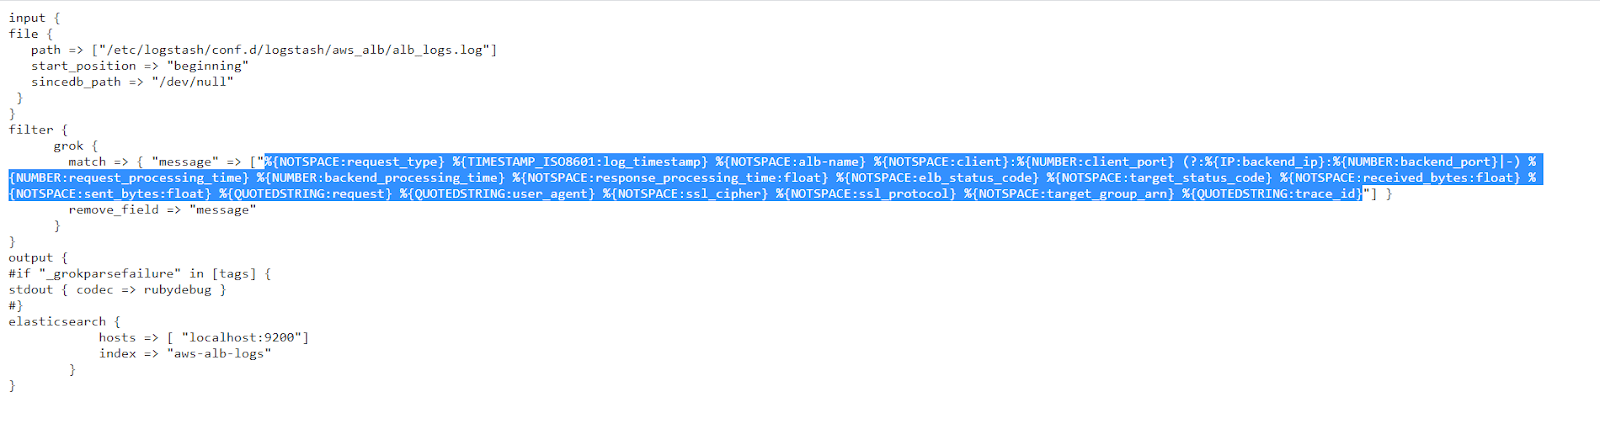
The config file we will use can be seen here: https://raw.githubusercontent.com/coralogix-resources/logstash/master/aws_alb/aws-alb.conf.
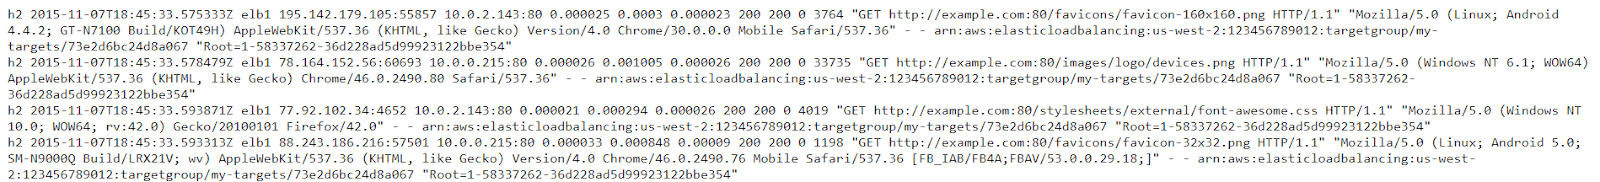
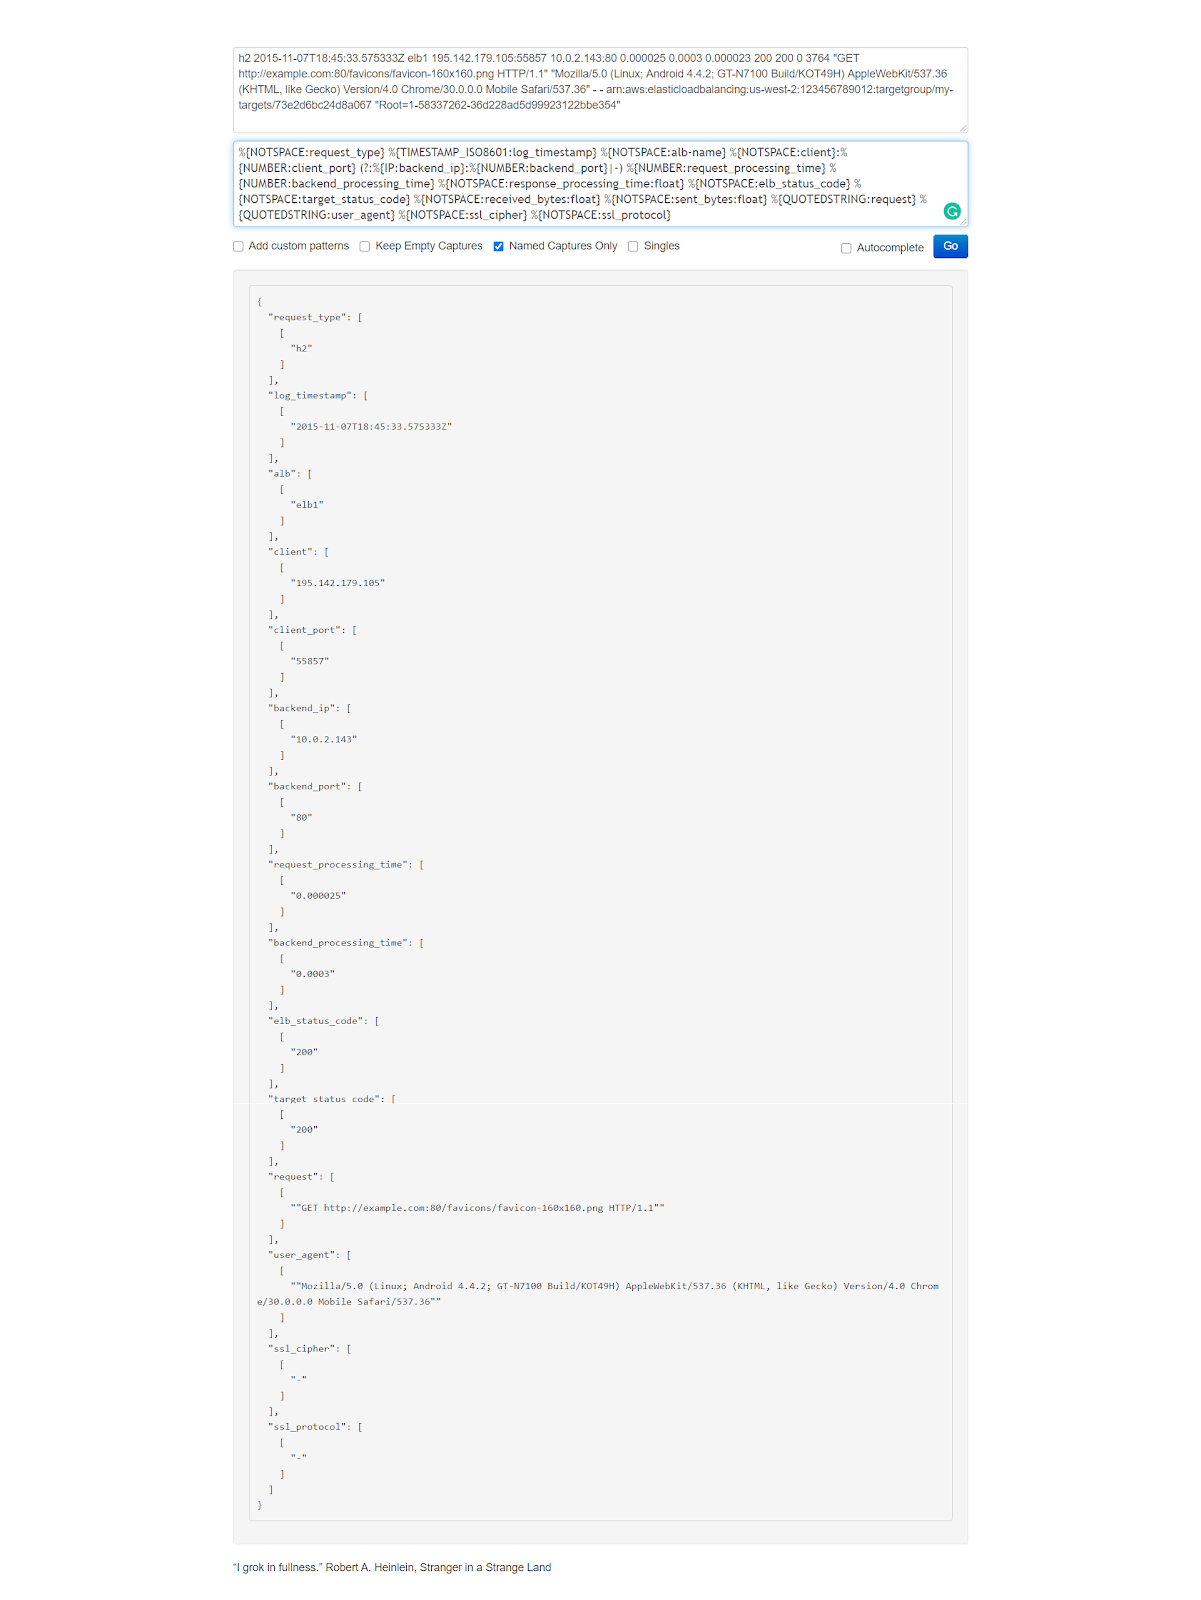
If you want to test things out in the https://grokdebug.herokuapp.com/ website, the input line you can copy and paste into the first field is the following:
h2 2015-11-07T18:45:33.575333Z elb1 195.142.179.105:55857 10.0.2.143:80 0.000025 0.0003 0.000023 200 200 0 3764 "GET http://example.com:80/favicons/favicon-160x160.png HTTP/1.1" "Mozilla/5.0 (Linux; Android 4.4.2; GT-N7100 Build/KOT49H) AppleWebKit/537.36 (KHTML, like Gecko) Version/4.0 Chrome/30.0.0.0 Mobile Safari/537.36" - - arn:aws:elasticloadbalancing:us-west-2:123456789012:targetgroup/my-targets/73e2d6bc24d8a067 "Root=1-58337262-36d228ad5d99923122bbe354"
And the Grok pattern is:
%{NOTSPACE:request_type} %{TIMESTAMP_ISO8601:log_timestamp} %{NOTSPACE:alb-name} %{NOTSPACE:client}:%{NUMBER:client_port} (?:%{IP:backend_ip}:%{NUMBER:backend_port}|-) %{NUMBER:request_processing_time} %{NUMBER:backend_processing_time} %{NOTSPACE:response_processing_time:float} %{NOTSPACE:elb_status_code} %{NOTSPACE:target_status_code} %{NOTSPACE:received_bytes:float} %{NOTSPACE:sent_bytes:float} %{QUOTEDSTRING:request} %{QUOTEDSTRING:user_agent} %{NOTSPACE:ssl_cipher} %{NOTSPACE:ssl_protocol} %{NOTSPACE:target_group_arn} %{QUOTEDSTRING:trace_id}
Once again, let’s run Logstash with the new config:
sudo /usr/share/logstash/bin/logstash -f /etc/logstash/conf.d/logstash/aws_alb/aws-alb.conf
We’ll press CTRL+C, once it’s done, and then take a look at how the log has been parsed and imported to the index:
curl -XGET "http://localhost:9200/aws-alb-logs/_search?pretty" -H 'Content-Type: application/json' -d'
{
  "size": 1,
  "query": {
    "bool": {
      "must_not": [
        {"term": {
          "tags": {
            "value": "_grokparsefailure"
          }
        }
      }
      ]
    }
  }
}'
The output should look something like this:
      {
        "_index" : "aws-alb-logs",
        "_type" : "_doc",
        "_id" : "dvpZ2nIBB7MjzkVPF0ex",
        "_score" : 0.0,
        "_source" : {
          "client" : "78.164.152.56",
          "path" : "/etc/logstash/conf.d/logstash/aws_alb/alb_logs.log",
          "client_port" : "60693",
          "ssl_protocol" : "-",
          "target_group_arn" : "arn:aws:elasticloadbalancing:us-west-2:123456789012:targetgroup/my-targets/73e2d6bc24d8a067",
          "backend_port" : "80",
          "trace_id" : "\"Root=1-58337262-36d228ad5d99923122bbe354\"",
          "backend_processing_time" : "0.001005",
          "response_processing_time" : 2.6E-5,
          "@timestamp" : "2020-06-22T04:46:09.813Z",
          "@version" : "1",
          "request_processing_time" : "0.000026",
          "received_bytes" : 0.0,
          "sent_bytes" : 33735.0,
          "alb-name" : "elb1",
          "log_timestamp" : "2015-11-07T18:45:33.578479Z",
          "request_type" : "h2",
          "user_agent" : "\"Mozilla/5.0 (Windows NT 6.1; WOW64) AppleWebKit/537.36 (KHTML, like Gecko) Chrome/46.0.2490.80 Safari/537.36\"",
          "request" : "\"GET http://example.com:80/images/logo/devices.png HTTP/1.1\"",
          "elb_status_code" : "200",
          "ssl_cipher" : "-",
          "host" : "coralogix",
          "backend_ip" : "10.0.0.215",
          "target_status_code" : "200"
        }
      }
Amazon’s CloudFront content delivery network generates useful logs to help ensure availability, performance, and in security audits.
Here is a sample log: https://raw.githubusercontent.com/coralogix-resources/logstash/master/aws_cloudfront/cloudfront_logs.log.
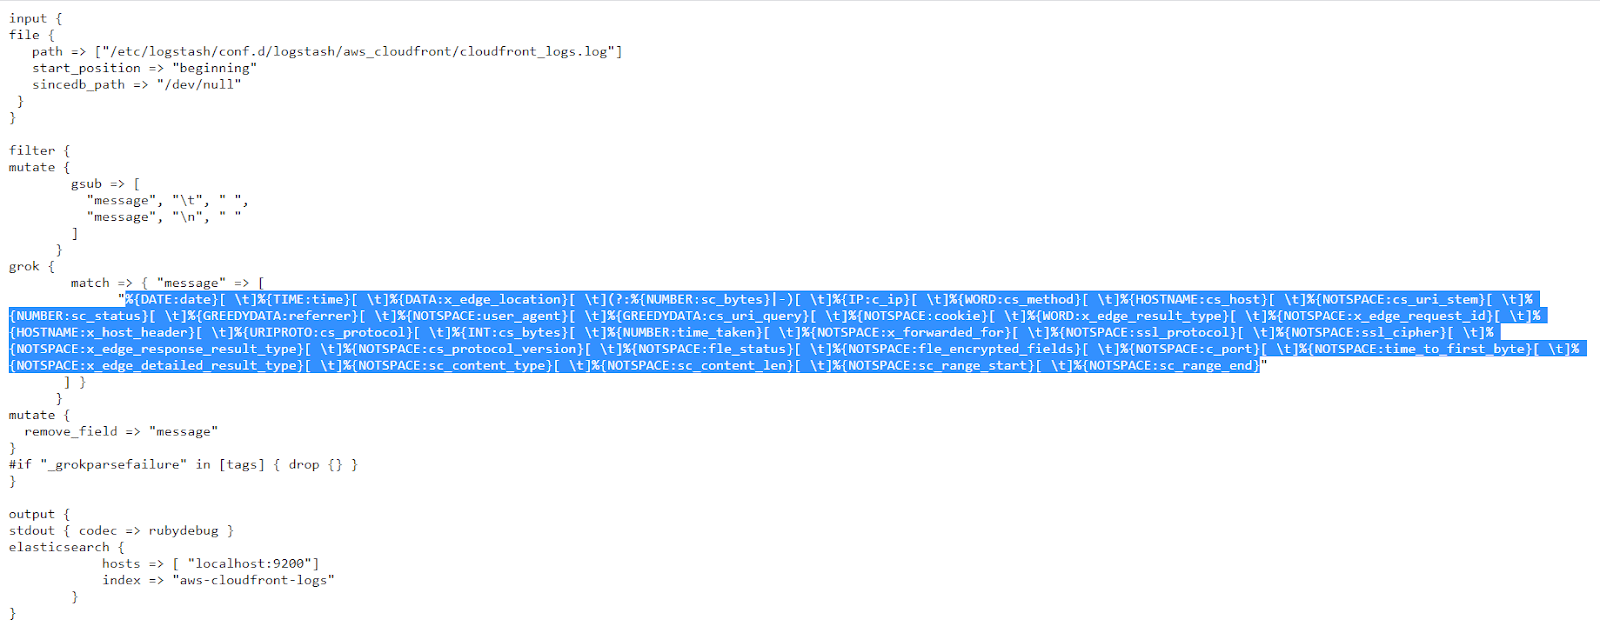
The Logstash config file can be viewed here: https://raw.githubusercontent.com/coralogix-resources/logstash/master/aws_cloudfront/aws-cloudfront.conf.
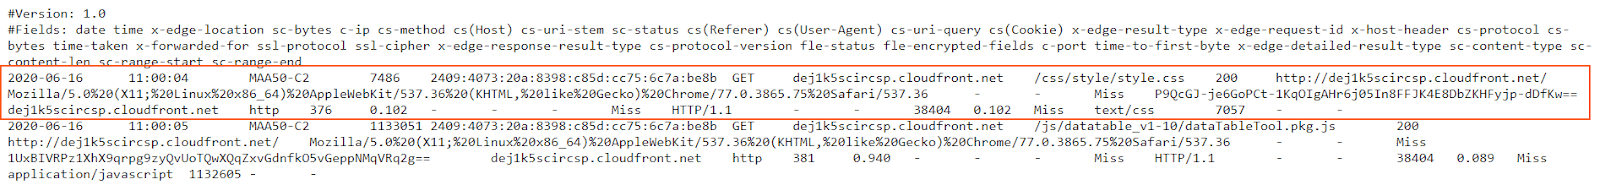
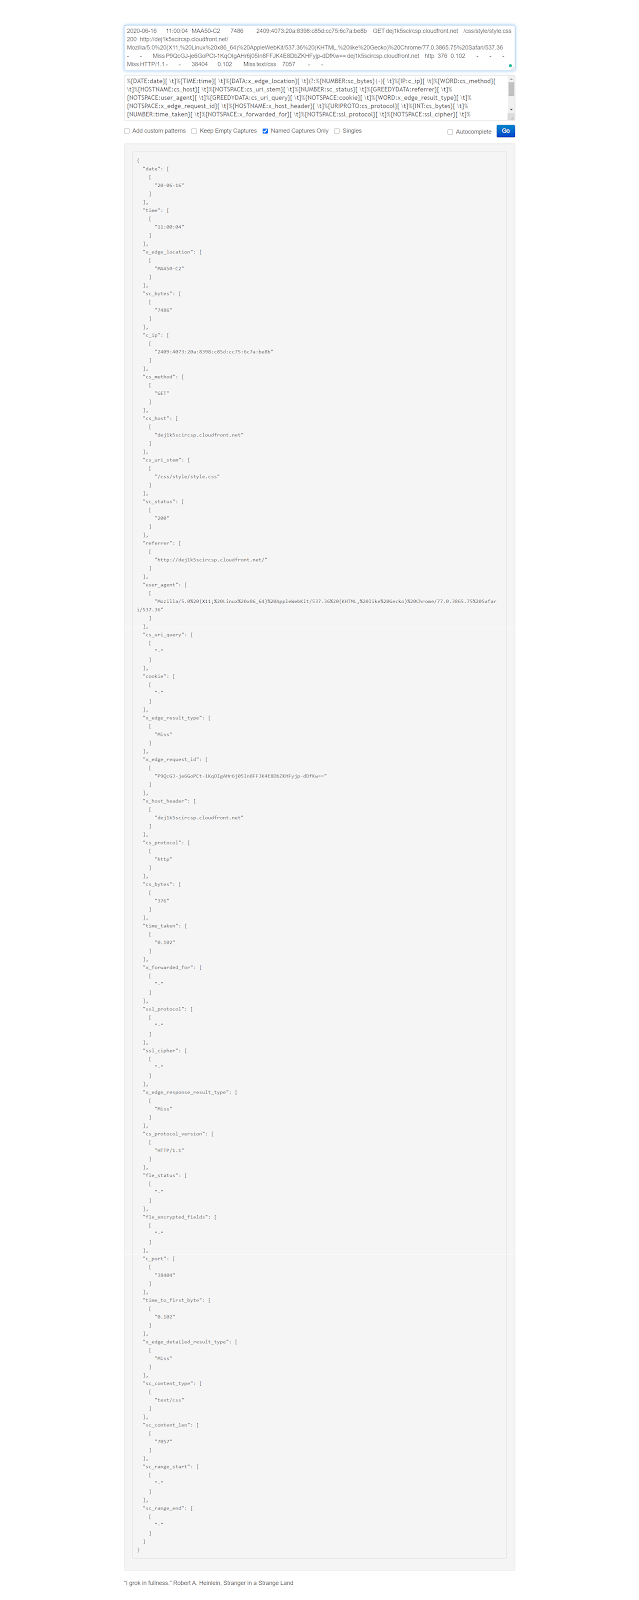
Once again, If you want to test how things work, in the https://grokdebug.herokuapp.com/ website, the input line you can copy and paste into the first field is this one:
2020-06-16 11:00:04 MAA50-C2 7486 2409:4073:20a:8398:c85d:cc75:6c7a:be8b GET dej1k5scircsp.cloudfront.net /css/style/style.css 200 http://dej1k5scircsp.cloudfront.net/ Mozilla/5.0%20(X11;%20Linux%20x86_64)%20AppleWebKit/537.36%20(KHTML,%20like%20Gecko)%20Chrome/77.0.3865.75%20Safari/537.36 - - Miss P9QcGJ-je6GoPCt-1KqOIgAHr6j05In8FFJK4E8DbZKHFyjp-dDfKw== dej1k5scircsp.cloudfront.net http 376 0.102 - - - Miss HTTP/1.1 - - 38404 0.102 Miss text/css 7057 - -
And the Grok pattern is:
%{DATE:date}[ \t]%{TIME:time}[ \t]%{DATA:x_edge_location}[ \t](?:%{NUMBER:sc_bytes}|-)[ \t]%{IP:c_ip}[ \t]%{WORD:cs_method}[ \t]%{HOSTNAME:cs_host}[ \t]%{NOTSPACE:cs_uri_stem}[ \t]%{NUMBER:sc_status}[ \t]%{GREEDYDATA:referrer}[ \t]%{NOTSPACE:user_agent}[ \t]%{GREEDYDATA:cs_uri_query}[ \t]%{NOTSPACE:cookie}[ \t]%{WORD:x_edge_result_type}[ \t]%{NOTSPACE:x_edge_request_id}[ \t]%{HOSTNAME:x_host_header}[ \t]%{URIPROTO:cs_protocol}[ \t]%{INT:cs_bytes}[ \t]%{NUMBER:time_taken}[ \t]%{NOTSPACE:x_forwarded_for}[ \t]%{NOTSPACE:ssl_protocol}[ \t]%{NOTSPACE:ssl_cipher}[ \t]%{NOTSPACE:x_edge_response_result_type}[ \t]%{NOTSPACE:cs_protocol_version}[ \t]%{NOTSPACE:fle_status}[ \t]%{NOTSPACE:fle_encrypted_fields}[ \t]%{NOTSPACE:c_port}[ \t]%{NOTSPACE:time_to_first_byte}[ \t]%{NOTSPACE:x_edge_detailed_result_type}[ \t]%{NOTSPACE:sc_content_type}[ \t]%{NOTSPACE:sc_content_len}[ \t]%{NOTSPACE:sc_range_start}[ \t]%{NOTSPACE:sc_range_end}
Now let’s run Logstash:
sudo /usr/share/logstash/bin/logstash -f /etc/logstash/conf.d/logstash/aws_cloudfront/aws-cloudfront.conf
As always, we press CTRL+C once it finishes its job.
Once again, let’s take a look at how the log has been parsed and inserted into the index:
curl -XGET "http://localhost:9200/aws-cloudfront-logs/_search?pretty" -H 'Content-Type: application/json' -d'
{
  "query": {
    "bool": {
      "must_not": [
        {"term": {
          "tags": {
            "value": "_grokparsefailure"
          }
        }
      }
      ]
    }
  }
}'
Part of the output should be similar to the following:
{
        "_index" : "aws-cloudfront-logs",
        "_type" : "_doc",
        "_id" : "Da1s4nIBnKKcJetIb-p9",
        "_score" : 0.0,
        "_source" : {
          "time_to_first_byte" : "0.000",
          "cs_uri_stem" : "/favicon.ico",
          "x_edge_request_id" : "vhpLn3lotn2w4xMOxQg77DfFpeEtvX49mKzz5h7iwNXguHQpxD6QPQ==",
          "sc_bytes" : "910",
          "@version" : "1",
          "cs_host" : "dej1k5scircsp.cloudfront.net",
          "c_ip" : "2409:4073:20a:8398:c85d:cc75:6c7a:be8b",
          "user_agent" : "Mozilla/5.0%20(X11;%20Linux%20x86_64)%20AppleWebKit/537.36%20(KHTML,%20like%20Gecko)%20Chrome/77.0.3865.75%20Safari/537.36",
          "sc_range_start" : "-",
          "c_port" : "57406",
          "x_edge_result_type" : "Error",
          "referrer" : "http://dej1k5scircsp.cloudfront.net/",
          "x_edge_location" : "MAA50-C2",
          "path" : "/etc/logstash/conf.d/logstash/aws_cloudfront/cloudfront_logs.log",
          "cs_protocol" : "http",
          "time_taken" : "0.001",
          "x_forwarded_for" : "-",
          "time" : "10:58:07",
          "cookie" : "-",
          "sc_status" : "502",
          "date" : "20-06-16",
          "sc_range_end" : "-",
          "x_edge_detailed_result_type" : "Error",
          "ssl_cipher" : "-",
          "cs_method" : "GET",
          "x_host_header" : "dej1k5scircsp.cloudfront.net",
          "sc_content_len" : "507",
          "ssl_protocol" : "-",
          "fle_status" : "-",
          "@timestamp" : "2020-06-23T18:24:15.784Z",
          "fle_encrypted_fields" : "-",
          "cs_bytes" : "389",
          "x_edge_response_result_type" : "Error",
          "host" : "coralogix",
          "cs_uri_query" : "-",
          "sc_content_type" : "text/html",
          "cs_protocol_version" : "HTTP/1.1"
        }
      }
Before continuing with the next lesson, let’s clean up the resources we created here.
First, we’ll delete the directory where we stored our sample log files and Logstash configurations:
sudo rm -r /etc/logstash/conf.d/logstash/
Next, let’s delete all the new indices we created:
curl -XDELETE localhost:9200/nginx-access-logs-02

curl -XDELETE localhost:9200/iis-log

curl -XDELETE localhost:9200/mongo-logs-01

curl -XDELETE localhost:9200/apache-logs

curl -XDELETE localhost:9200/es-test-logs

curl -XDELETE localhost:9200/es-slow-logs

curl -XDELETE localhost:9200/mysql-slowlogs-01

curl -XDELETE localhost:9200/aws-elb-logs

curl -XDELETE localhost:9200/aws-alb-logs

curl -XDELETE localhost:9200/aws-cloudfront-logs
I hope this arsenal of Grok patterns for common log types are useful for most of your future Logstash needs. Keep in mind that if the log you encounter is just slightly different, only slight changes need to be made to these patterns, which you can use as your starting templates.
It is commonplace for organizations to restrict their IT systems from having direct or unsolicited access to external networks or the Internet, with network proxies serving…

What is AWS Systems Manager Before we jump into this, it’s important to note that older names, and still in use in some areas of AWS,…

Infrastructure as Code is an increasingly popular DevOps paradigm. IaC has the ability to abstract away the details of server provisioning. This tutorial will look at…
