Ship OpenTelemetry Data to Coralogix via Reverse Proxy (Caddy 2)
It is commonplace for organizations to restrict their IT systems from having direct or unsolicited access to external networks or the Internet, with network proxies serving…

Syslog is a popular standard for centralizing and formatting log data generated by network devices. It provides a standardized way of generating and collecting log information, such as program errors, notices, warnings, status messages, and so on. Almost all Unix-like operating systems, such as those based on Linux or BSD kernels, use a Syslog daemon that is responsible for collecting log information and storing it.
They’re usually stored locally, but they can also be streamed to a central server if the administrator wants to be able to access all logs from a single location. By default, port 514 and UDP are used for the transmission of Syslogs.
Note: It’s recommended to avoid UDP whenever possible, as it doesn’t guarantee that all logs will be sent and received; when the network is unreliable or congested, some messages could get lost in transit.
For more security and reliability, port 6514 is often used with TCP connections and TLS encryption.
In this post, we’ll learn how to collect Syslog messages from our servers and devices with Logstash and send it to Elasticsearch. This will allow us to take advantage of its super-awesome powers of ingesting large volumes of data and then allowing us to quickly and efficiently search for what we need.
We’ll explore two methods. One involves using the Syslog daemon to send logs through a TCP connection to a central server running Logstash. The other method uses Logstash to monitor log files on each server/device and automatically index messages to Elasticsearch.
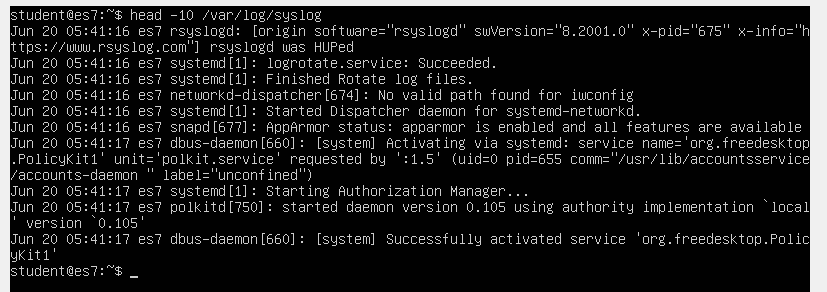
Let’s take a look at how typical syslog events look like. These are usually collected locally in a file named /var/log/syslog.
To display the first 10 lines, we’ll type:
sudo head -10 /var/log/syslog
Let’s analyze how a syslog line is structured.
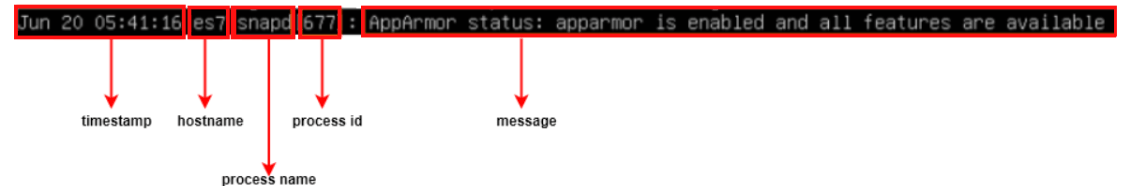
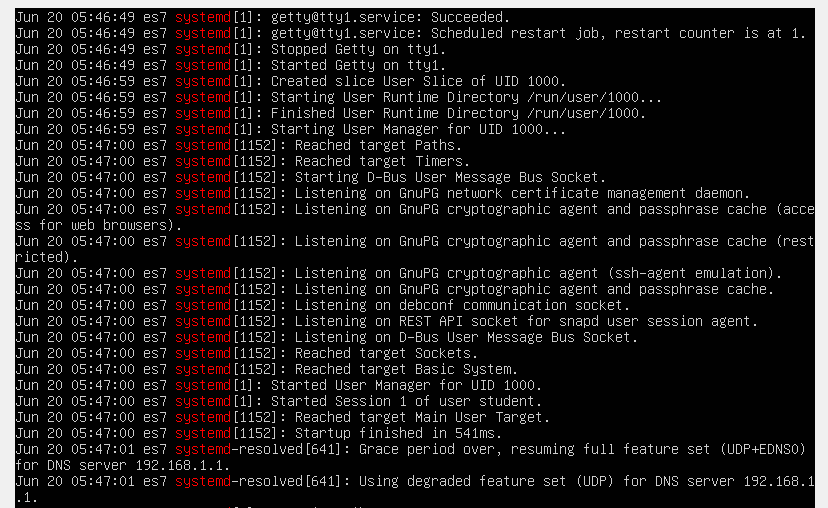
We can see the line starts with a timestamp, including the month name, day of month, hour, minute and second at which the event was recorded. The next entry is the hostname of the device generating the log. Next is the name of the process that created the log entry, its process ID number, and, finally, the log message itself.
Logs are very useful when we want to monitor the health of our systems or debug errors. But when we have to deal with tens, hundreds, or even thousands of such systems, it’s obviously too complicated to log into each machine and manually look at syslogs. By centralizing all of them into Elasticsearch, it makes it easier to get a birds-eye view over all of the logged events, filter only what we need and quickly spot when a system is misbehaving.
In this post, we’ll explore two methods with which we can get our data into Logstash logs, and ultimately into an Elasticsearch index:
The syslog daemon has the ability to send all the log events it captures to another device, through a TCP connection. Logstash, on the other hand, has the ability to open up a TCP port and listen for incoming connections, looking for syslog data. Sounds like a perfect match! Let’s see how to make them work together.
For simplicity, we will obviously use the same virtual machine to send the logs and also collect them. But in a real-world scenario, we would configure a separate server with Logstash to listen for incoming connections on a TCP port. Then, we would configure the syslog daemons on all of the other servers to send their logs to the Logstash instance.
Important: In this exercise, we’re configuring the syslog daemon first, and Logstash last, since we want the first captured logged events to be the ones we intentionally generate. But in a real scenario, configure Logstash listening on the TCP port first. This is to ensure that when you later configure the syslog daemons to send their messages, Logstash is ready to ingest them. If Logstash isn’t ready, the log entries sent while you configure it, won’t make it into Elasticsearch.
We will forward our syslogs to TCP port 10514 of the virtual machine. Logstash will listen to port 10514 and collect all messages.
Let’s edit the configuration file of the syslog daemon.
sudo nano /etc/rsyslog.d/50-default.conf
Above the line “#First some standard log files. Log by facility” we’ll add the following:
*.* @@127.0.0.1:10514
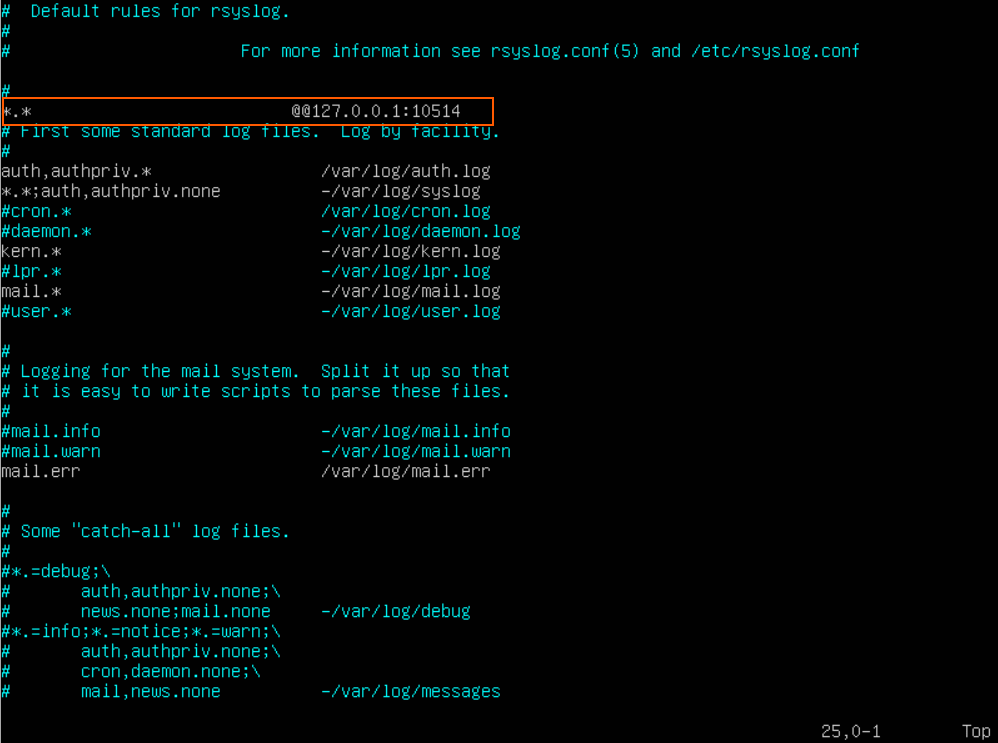
*.* indicates to forward all messages. @@ instructs the rsyslog utility to transmit data through TCP connections.
To save the config file, we press CTRL+X, after which we type Y and finally press ENTER.
We’ll need to restart the syslog daemon (called “rsyslogd”) so that it picks up on our desired changes.
sudo systemctl restart rsyslog.service
If you don’t have a git tool available on your test system, you can install it with:
sudo apt update && sudo apt install git
Now let’s clone the repo which contains the configuration files we’ll use with Logstash.
sudo git clone https://github.com/coralogix-resources/logstash-syslog.git /etc/logstash/conf.d/logstash-syslog
Let’s take a look at the log entries generated by the “systemd” processes.
sudo grep "systemd" /var/log/syslog
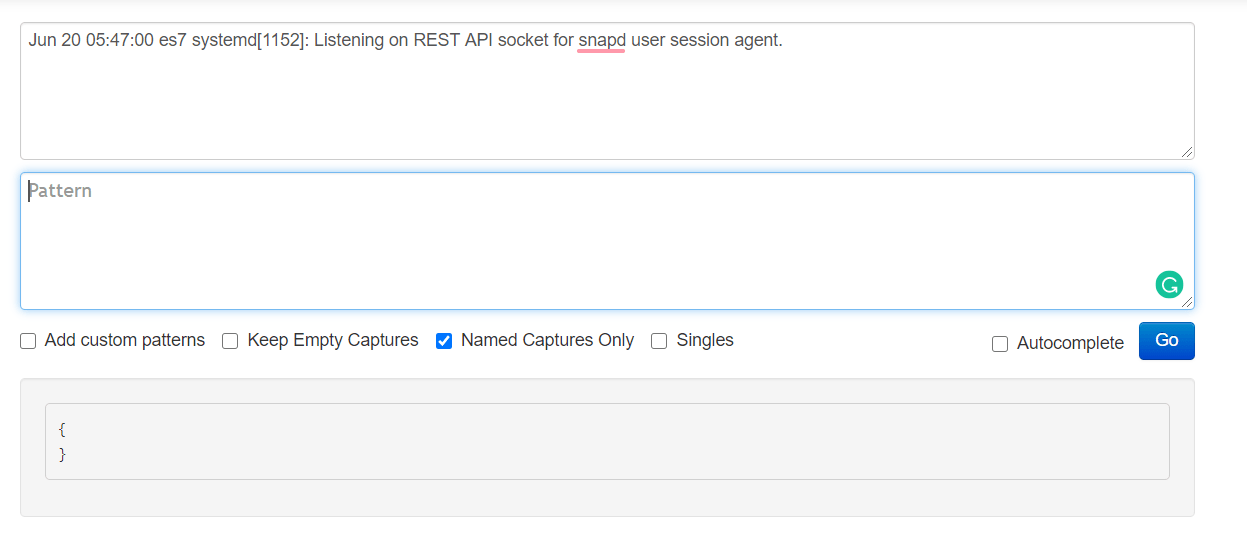
We’ll copy one of these lines and paste it to the https://grokdebug.herokuapp.com/ website, in the first field, the input section.
Now, in a new web browser tab, let’s take a look at the following Logstash configuration: https://raw.githubusercontent.com/coralogix-resources/logstash-syslog/master/syslog-tcp-forward.conf.
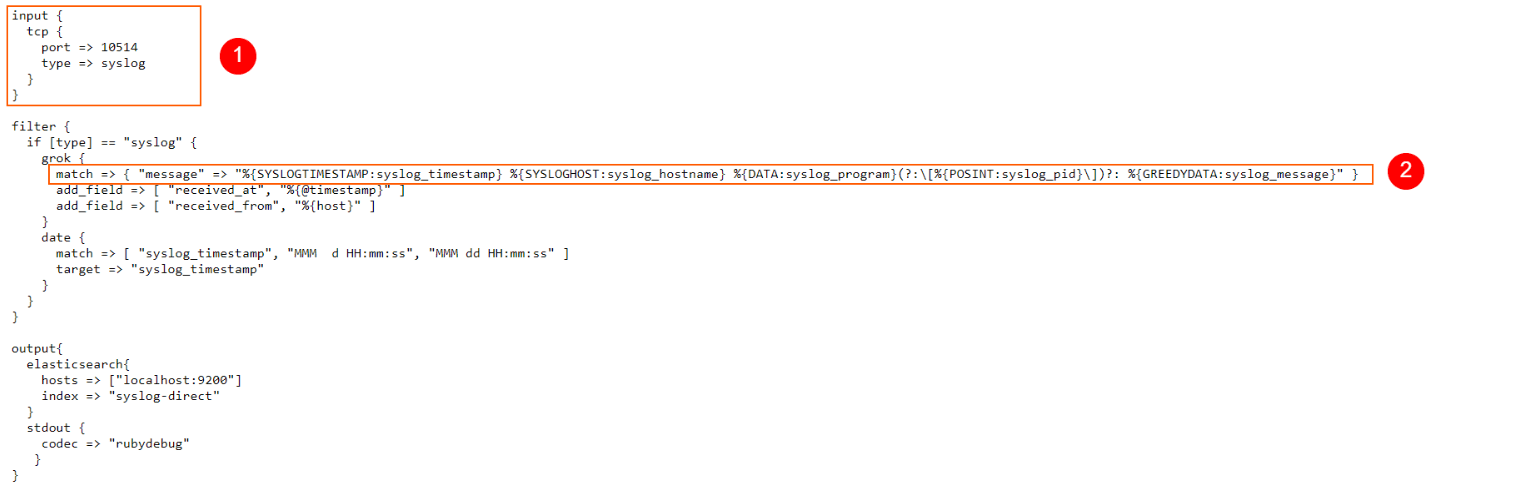
We can see in the highlighted “input” section how we instruct Logstash to listen for incoming connections on TCP port 10514 and look for syslog data.
To test how the Grok pattern we use in this config file matches our syslog lines, let’s copy it
%{SYSLOGTIMESTAMP:syslog_timestamp} %{SYSLOGHOST:syslog_hostname} %{DATA:syslog_program}(?:\[%{POSINT:syslog_pid}\])?: %{GREEDYDATA:syslog_message}
and then paste it to the https://grokdebug.herokuapp.com/ website, in the second field, the pattern section.
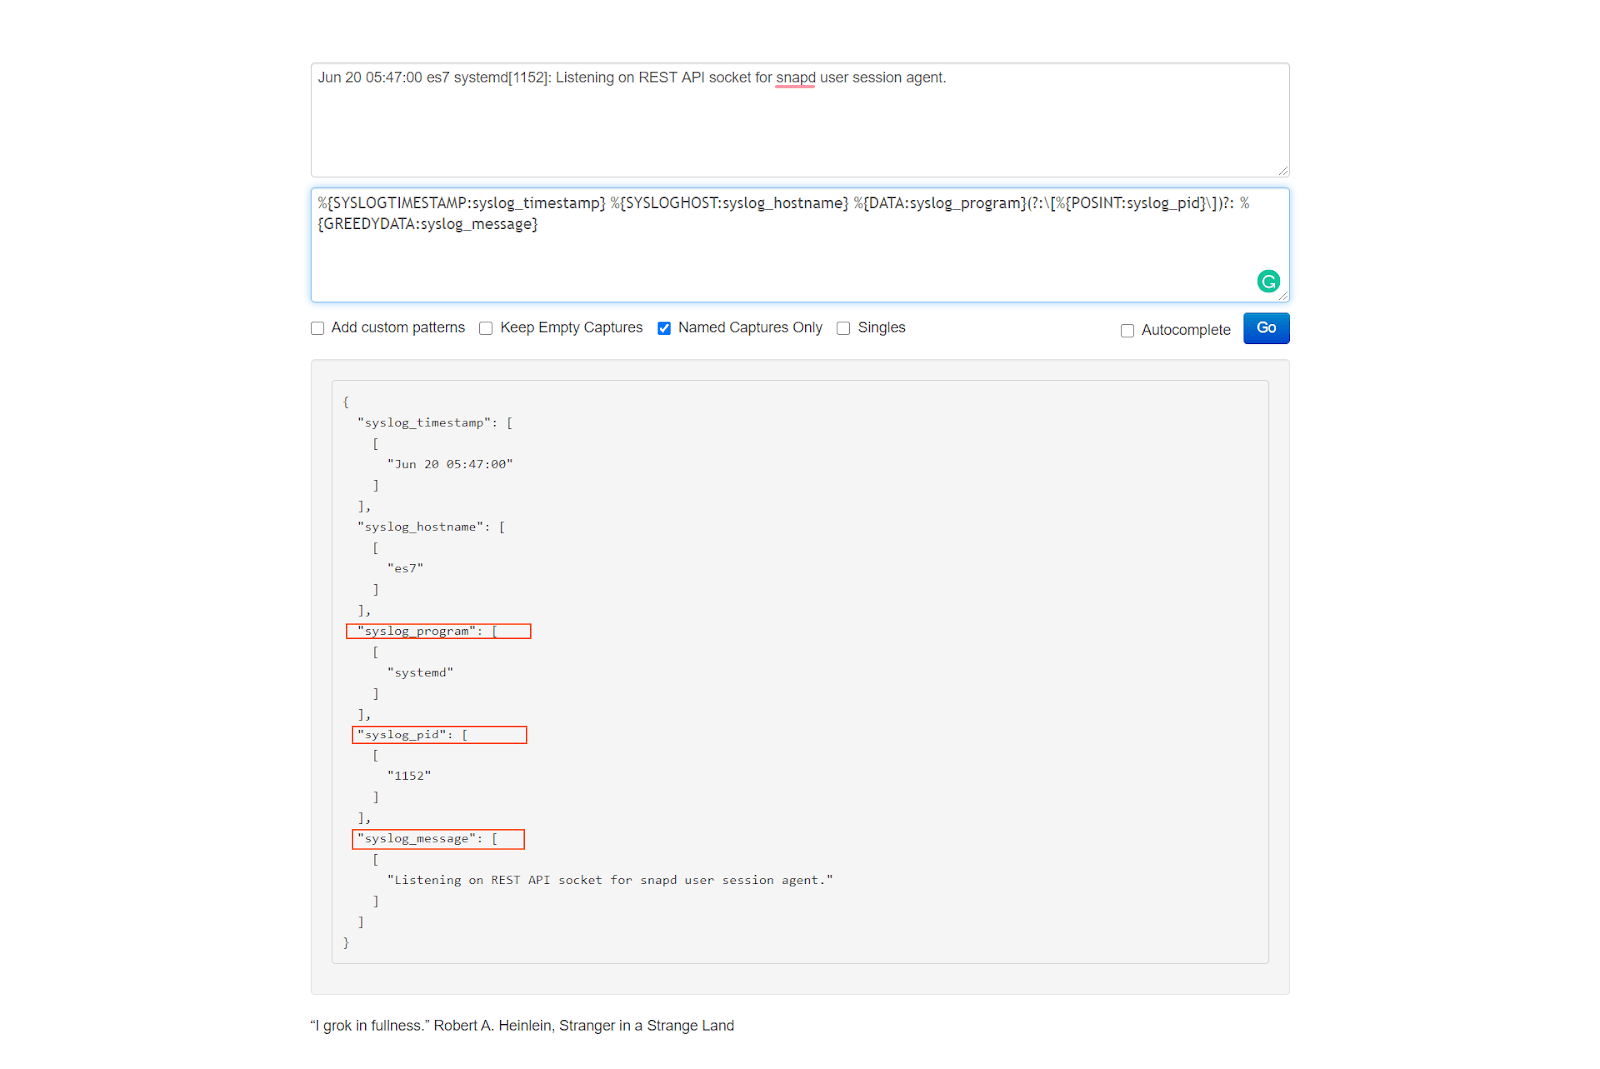
We can see every field is perfectly extracted.
Now, let’s run Logstash with this configuration file.
sudo /usr/share/logstash/bin/logstash -f /etc/logstash/conf.d/logstash-syslog/syslog-tcp-forward.conf
Since logs are continuously generated and collected, we won’t stop Logstash this time with CTRL+C. We’ll just leave it running until we see this:
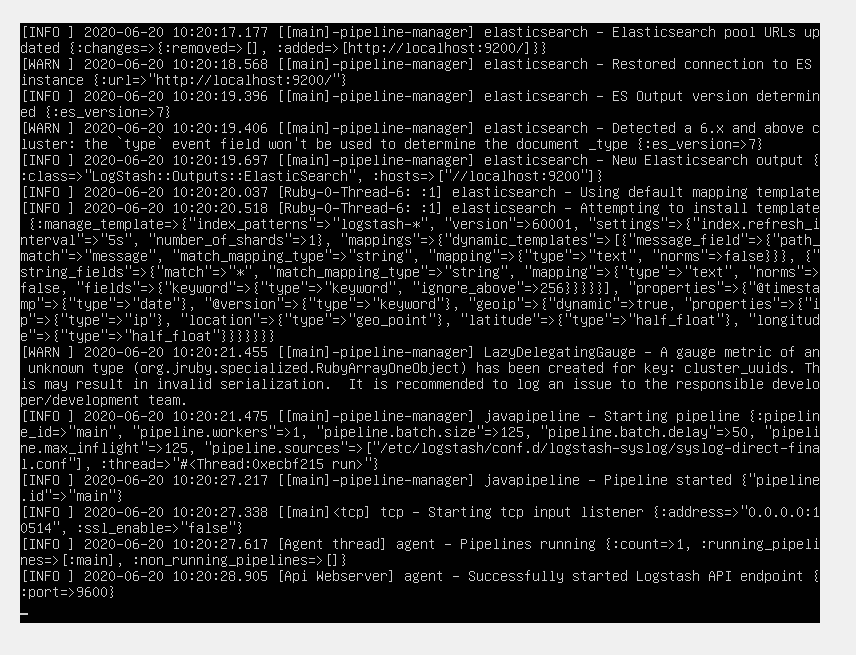
Specifically, we’re looking for the “Successfully started Logstash” message.
Let’s leave Logstash running in the background, collecting data. Leave its terminal window open (so you can see it catching syslog events) and open up a second terminal window to enter the next commands.
It’s very likely that at this point no syslog events have been collected yet, since we just started Logstash. Let’s make sure to generate some log entries first. A simple command such as
sudo ls
will ensure we’ll generate a few log messages. We’ll be able to see in the window where Logstash is running that sudo generated some log entries and these have been added to the Elasticsearch index.
Let’s take a look at an indexed log entry.
curl -XGET "http://localhost:9200/syslog-received-on-tcp/_search?pretty" -H 'Content-Type: application/json' -d'{"size": 1}'
The output we’ll get will contain something similar to this:
        {
        "_index" : "syslog-received-on-tcp",
        "_type" : "_doc",
        "_id" : "fWJ7QXMB9gZX17ukIc6D",
        "_score" : 1.0,
        "_source" : {
          "received_at" : "2020-07-12T05:24:14.990Z",
          "syslog_message" : " student : TTY=pts/1 ; PWD=/home/student ; USER=root ; COMMAND=/bin/ls",
          "syslog_timestamp" : "2020-07-12T05:24:14.000Z",
          "message" : "<85>Jul 12 08:24:14 coralogix sudo:  student : TTY=pts/1 ; PWD=/home/student ; USER=root ; COMMAND=/bin/ls",
          "syslog_hostname" : "coralogix",
          "port" : 51432,
          "type" : "syslog",
          "@timestamp" : "2020-07-12T05:24:14.990Z",
          "host" : "localhost",
          "@version" : "1",
          "received_from" : "localhost",
          "syslog_program" : "sudo"
        }
Awesome! Everything worked perfectly. Now let’s test out the other scenario.
We’ll first need to stop the Logstash process we launched in the previous section. Switch to the terminal where it is running and press CTRL+C to stop it.
Let’s open up this link in a browser and take a look at the Logstash config we’ll use this time: https://raw.githubusercontent.com/coralogix-resources/logstash-syslog/master/logstash-monitoring-syslog.conf.
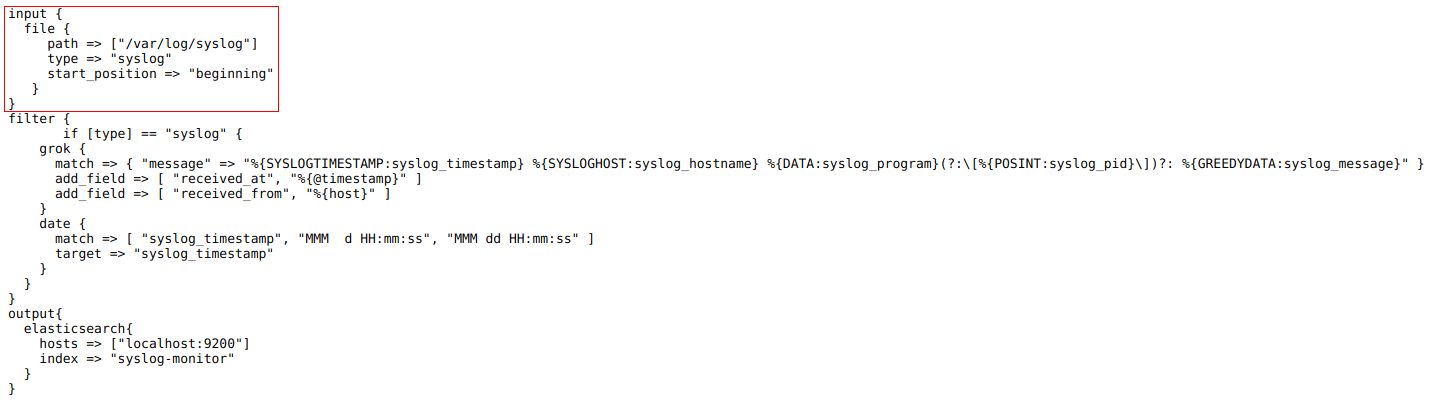
We can see that the important part here is that we tell it to monitor the “/var/log/syslog” file.
Let’s run Logstash with this config.
sudo /usr/share/logstash/bin/logstash -f /etc/logstash/conf.d/logstash-syslog/logstash-monitoring-syslog.conf
As usual, we’ll wait until it finishes its job and then press CTRL+C to exit the process.
Let’s see the data that has been parsed.
curl -XGET "http://localhost:9200/syslog-monitor/_search?pretty" -H 'Content-Type: application/json' -d'{"size": 1}'
We will get an output similar to this:
        {
        "_index" : "syslog-monitor",
        "_type" : "_doc",
        "_id" : "kmKYQXMB9gZX17ukC878",
        "_score" : 1.0,
        "_source" : {
          "type" : "syslog",
          "@version" : "1",
          "syslog_message" : " [origin software=\"rsyslogd\" swVersion=\"8.32.0\" x-pid=\"448\" x-info=\"http://www.rsyslog.com\"] rsyslogd was HUPed",
          "syslog_hostname" : "coralogix",
          "message" : "Jul 12 05:52:46 coralogix rsyslogd:  [origin software=\"rsyslogd\" swVersion=\"8.32.0\" x-pid=\"448\" x-info=\"http://www.rsyslog.com\"] rsyslogd was HUPed",
          "received_at" : "2020-07-12T05:55:49.644Z",
          "received_from" : "coralogix",
          "host" : "coralogix",
          "syslog_program" : "rsyslogd",
          "syslog_timestamp" : "2020-07-12T02:52:46.000Z",
          "path" : "/var/log/syslog",
          "@timestamp" : "2020-07-12T05:55:49.644Z"
        }
To clean up what we created in this exercise, we just need to delete the two new indexes that we added
curl -XDELETE "http://localhost:9200/syslog-received-on-tcp/"

curl -XDELETE "http://localhost:9200/syslog-monitor/"
and also delete the directory where we placed our Logstash config files.
sudo rm -r /etc/logstash/conf.d/logstash-syslog
As you can see, it’s fairly easy to gather all of your logs in a single location, and the advantages are invaluable. For example, besides making everything more accessible and easier to search, think about servers failing. It happens a little bit more often than we like. If logs are kept on the server, once it fails, you lose the logs. Or, another common scenario, is that hackers delete logs once they compromise a machine. By collecting everything into Elasticsearch, though, you’ll have the original logs, untouched and ready to review to see what happened before the machine experienced problems.
It is commonplace for organizations to restrict their IT systems from having direct or unsolicited access to external networks or the Internet, with network proxies serving…

What is AWS Systems Manager Before we jump into this, it’s important to note that older names, and still in use in some areas of AWS,…

Infrastructure as Code is an increasingly popular DevOps paradigm. IaC has the ability to abstract away the details of server provisioning. This tutorial will look at…
