Dynamic alerts utilize artificial intelligence algorithms to analyze incoming logs and metrics and predict their expected behavior for 24 hours. When a log or metric falls above or below a predefined threshold, something unusual may have occurred, indicating an opportunity for corrective action.
For example, a dynamic alert can help you discover when a transaction’s response time exceeds its usual duration, allowing you to pinpoint and address performance bottlenecks. Or it can alert you when the outgoing traffic of a host exceeds its usual levels, indicating a potential security breach.
Set up a standard or metric alert to notify you if a log or metric exceeds an AI-generated baseline threshold.
Navigate to Alerts > Alert Management. Click New Alert.
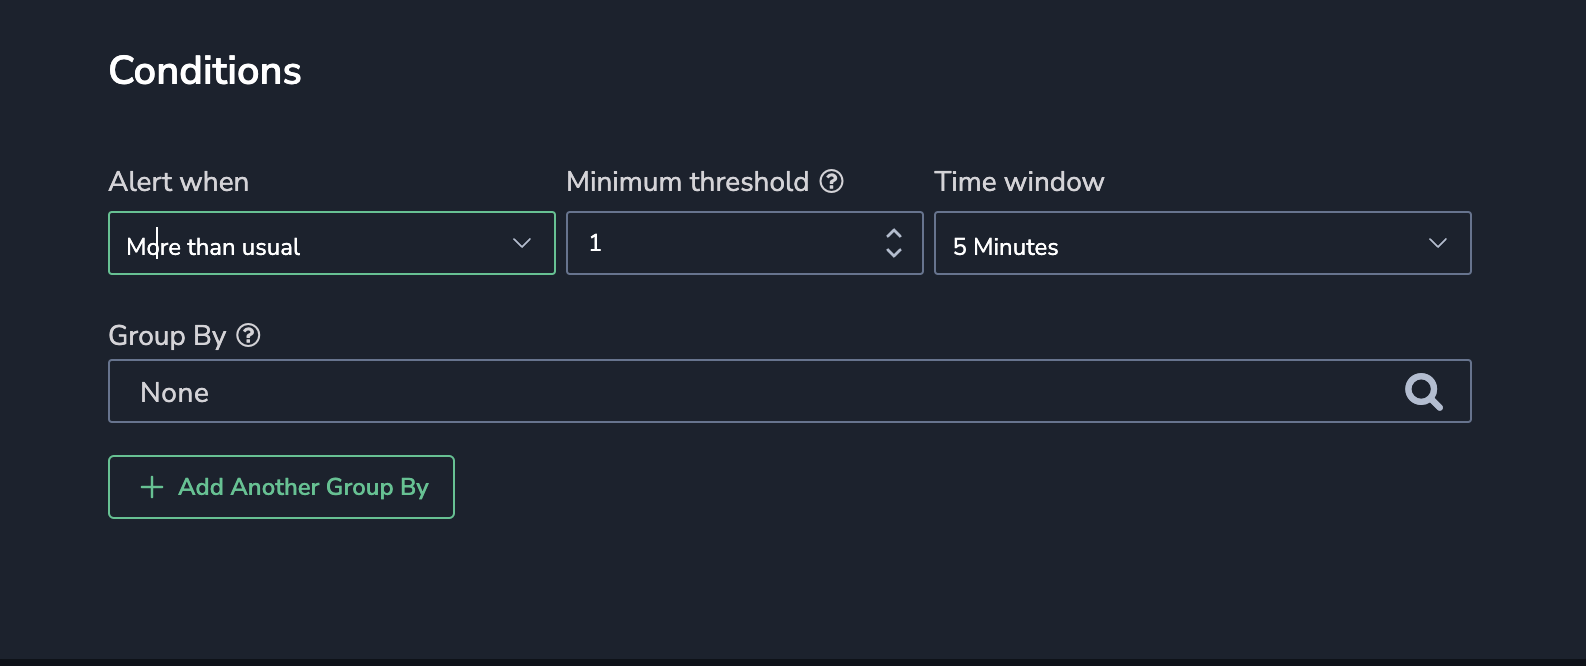
STEP 1. When defining your alert conditions, select to be alerted when an event is more-than-usual compared to the baseline condition.
STEP 2. Specify a minimum threshold to determine when an alert should be triggered. The alert will not be activated if the evaluation result is higher than usual but falls below this threshold. This ensures alerts are only triggered for significant deviations above the specified baseline.
STEP 3. Define the remaining alert conditions.
For standard alerts, define the time window for which logs matching your query will be counted. This actual count is compared to the predicted count during this period.
Add one or more group-by keys. An alert is triggered whenever the condition threshold is met for a specific aggregated key within the specified time window. Our machine-learning model establishes the baseline standard for every group-by key.
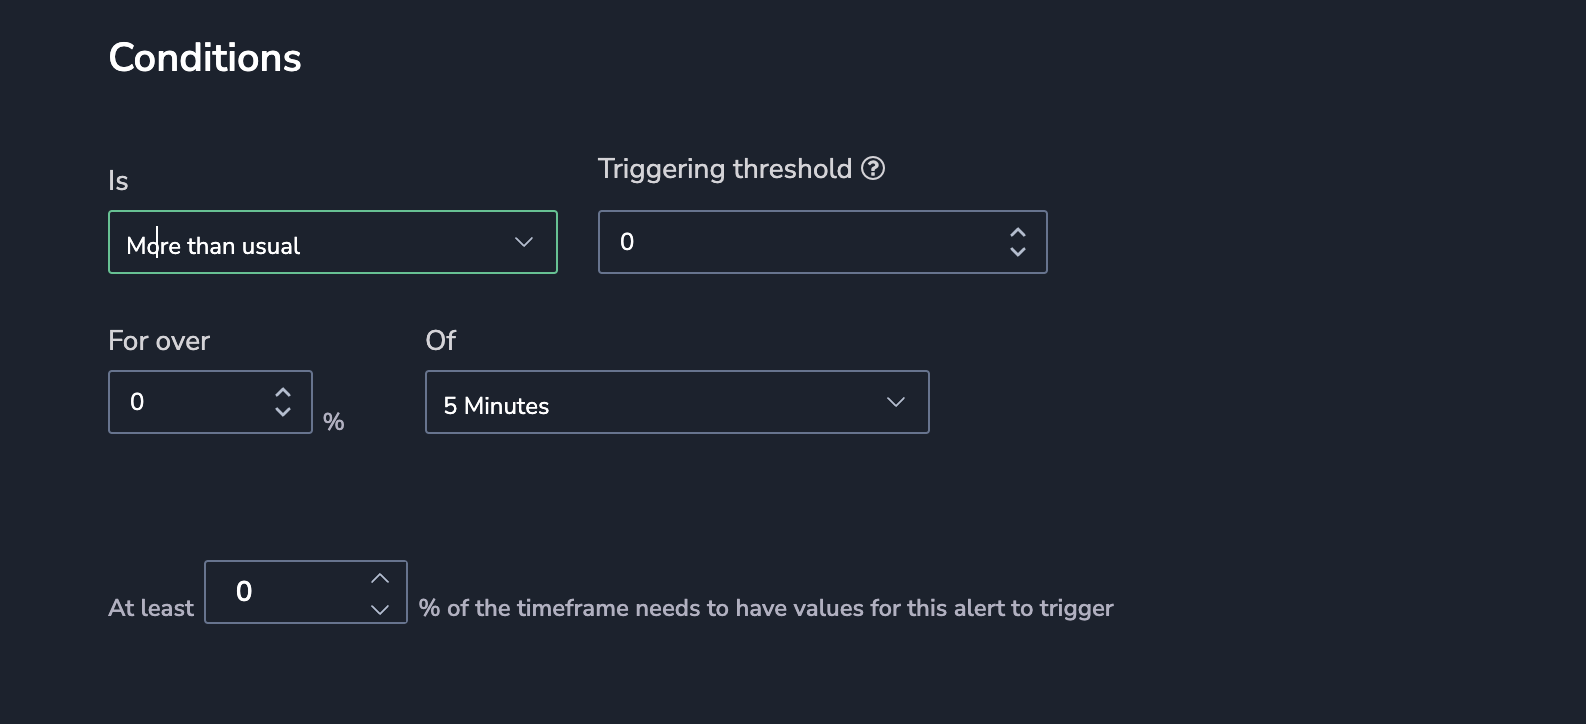
For metric alerts, enter a percentage (for over x %) and timeframe (of the last x minutes) to determine the time for which the metric must be more than usual within the time window. Select the percentage (at least x %) of the timeframe that needs such values for the alert to trigger.
STEP 4. Finalize the alert setup.
Less-than-usual anomalies
Set up a metric alert to notify you if your metric falls below an AI-generated baseline threshold.
Navigate to Alerts > Alert Management. Click New Alert.
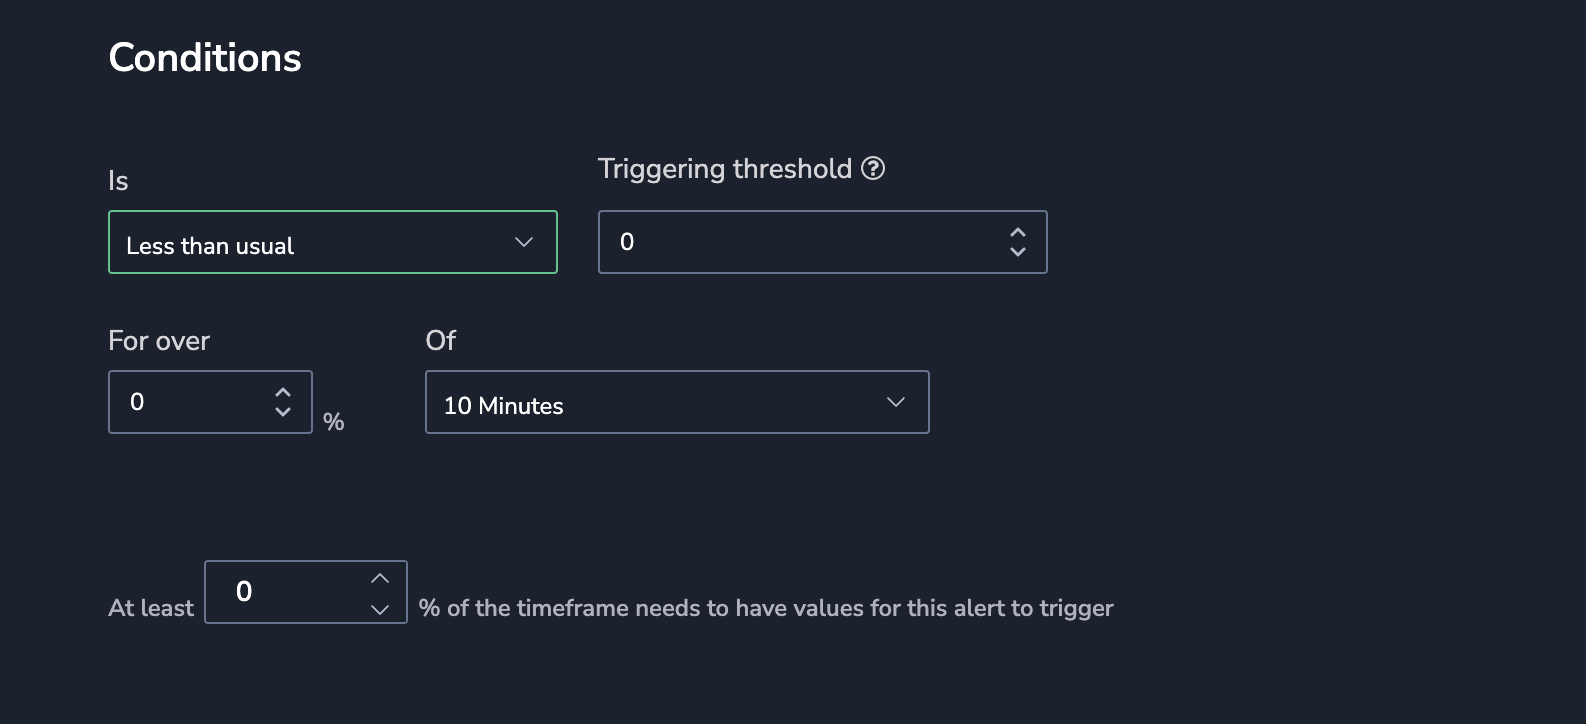
STEP 1. When defining your alert conditions, select to be alerted when an event is less-than-usual compared to the baseline condition.
STEP 2. Specify a maximum threshold to determine when an alert should be triggered. The alert will not be activated if the evaluation result is lower than usual but falls above this threshold. This ensures alerts are only triggered for significant deviations below the specified baseline.
STEP 3. Enter a percentage (for over x %) and timeframe (of the last x minutes) to determine the time the metric must be less than usual within the time window. Select the percentage (at least x %) of the timeframe that needs such values for the alert to trigger.
STEP 4. Finalize the alert setup.
Limitations
Our machine-learning model establishes the baseline standard for your logs or metrics for every group-by key in your alert definition. It is applied daily for the next 24 hours, using data from the past 7 days, and is based on a maximum of 500 permutations per metric.
Each Coralogix team is limited to a maximum of 10 machine-learning alerts in total.
 Oh no!We didn’t find anything for “”,