Thousands of Insights at a Glance With Coralogix Alert Map
An effective alerting strategy is the difference between reacting to an outage and stopping it before it starts. That’s why at Coralogix, we’re constantly releasing new…

FortiGate, a next-generation firewall from IT Cyber Security leaders Fortinet, provides the ultimate threat protection for businesses of all sizes. FortiGate helps you understand what is happening on your network, and informs you about certain network activities, such as the detection of a virus, a visit to an invalid website, an intrusion, a failed login attempt, and myriad others.
This post will show you how Coralogix can provide analytics and insights for your FortiGate logs.
FortiGate log events types are various and are divided into types (Traffic Logs, Event Logs, Security Logs, etc…) and subtypes per each type, you can view full documentation here. You may notice that the FortiGate logs are structured in a Syslog format, with multiple key/value pairs forming textual logs.
First, you will need to parse the data into a JSON log format to enjoy the full extent of the Coralogix capabilities and features and eventually, using Coralogix alerts and dashboards, instantly diagnose problems, spot potential security threats, and get a real-time notification on any event that you might want to observe. Ultimately, this offers a better monitoring experience and more capabilities from your data with minimum effort.
There are two ways to parse the FortiGate logs, either it is done on the integration side or at the 3rd party logging solution you are using if it allows a parsing engine. If you are using Coralogix as your logging solution you can use our advanced parsing engine to create series of rules within the same parsing group to eventually form a JSON object from the key/value pairs text logs. Let us review both options.
In your logstash.conf add the following KV filter:
    filter {
      kv {
        trim_value => "\""
        value_split => "="
        allow_duplicate_values => false
      }
    }
Note that the arguments “value_split” and “allow_duplicate_values” are not mandatory and by default, they are set with the values I am presenting here, I only added them for reference.
date=2019-05-10 time=11:37:47 logid="0000000013" type="traffic" subtype="forward" level="notice" vd="vdom1" eventtime=1557513467369913239 srcip=10.1.100.11 srcport=58012 srcintf="port12" srcintfrole="undefined" dstip=23.59.154.35 dstport=80 dstintf="port11" dstintfrole="undefined" srcuuid="ae28f494-5735-51e9-f247-d1d2ce663f4b" dstuuid="ae28f494-5735-51e9-f247-d1d2ce663f4b" poluuid="ccb269e0-5735-51e9-a218-a397dd08b7eb" sessionid=105048 proto=6 action="close" policyid=1 policytype="policy" service="HTTP" dstcountry="Canada" srccountry="Reserved" trandisp="snat" transip=172.16.200.2 transport=58012 appid=34050 app="HTTP.BROWSER_Firefox" appcat="Web.Client" apprisk="elevated" applist="g-default" duration=116 sentbyte=1188 rcvdbyte=1224 sentpkt=17 rcvdpkt=16 utmaction="allow" countapp=1 osname="Ubuntu" mastersrcmac="a2:e9:00:ec:40:01" srcmac="a2:e9:00:ec:40:01" srcserver=0 utmref=65500-742
{
	"date": "2019-05-10",
	"time": "11:37:47",
	"logid": "0000000013",
	"type": "traffic",
	"subtype": "forward",
	"level": "notice",
	"vd": "vdom1",
	"eventtime": "1557513467369913239",
	"srcip": "10.1.100.11",
	"srcport": "58012",
	"srcintf": "port12",
	"srcintfrole": "undefined",
	"dstip": "23.59.154.35",
	"dstport": "80",
	"dstintf": "port11",
	"dstintfrole": "undefined",
	"srcuuid": "ae28f494-5735-51e9-f247-d1d2ce663f4b",
	"dstuuid": "ae28f494-5735-51e9-f247-d1d2ce663f4b",
	"poluuid": "ccb269e0-5735-51e9-a218-a397dd08b7eb",
	"sessionid": "105048",
	"proto": "6",
	"action": "close",
	"policyid": "1",
	"policytype": "policy",
	"service": "HTTP",
	"dstcountry": "Canada",
	"srccountry": "Reserved",
	"trandisp": "snat",
	"transip": "172.16.200.2",
	"transport": "58012",
	"appid": "34050",
	"app": "HTTP.BROWSER_Firefox",
	"appcat": "Web.Client",
	"apprisk": "elevated",
	"applist": "g-default",
	"duration": "116",
	"sentbyte": "1188",
	"rcvdbyte": "1224",
	"sentpkt": "17",
	"rcvdpkt": "16",
	"utmaction": "allow",
	"countapp": "1",
	"osname": "Ubuntu",
	"mastersrcmac": "a2:e9:00:ec:40:01",
	"srcmac": "a2:e9:00:ec:40:01",
	"srcserver": "0",
	"utmref": "65500-742"
}
In settings –> Rules (available only for account admins) create a new group of rules with the following 3 REGEX-based replace rules. These rules should be applied consecutively (with an AND between them) on the FortiGate logs in order to format. Don’t forget to add a rule matcher to enable the parsing to take place only on your FortiGate data. Here are the rules:
([a-z0-9\_\-]+)=(?:\")([^"]+)(?:\")
Replace pattern
"$1":"$2",
([a-z0-9\_\-]+)=([0-9\.\-\:]+|N\/A)(?: |$)
Replace pattern
"$1":"$2",
(.*),
Replace pattern
{$1}
For the same sample log above the result will be similar and the log entry you will have in Coralogix will be parsed as JSON.
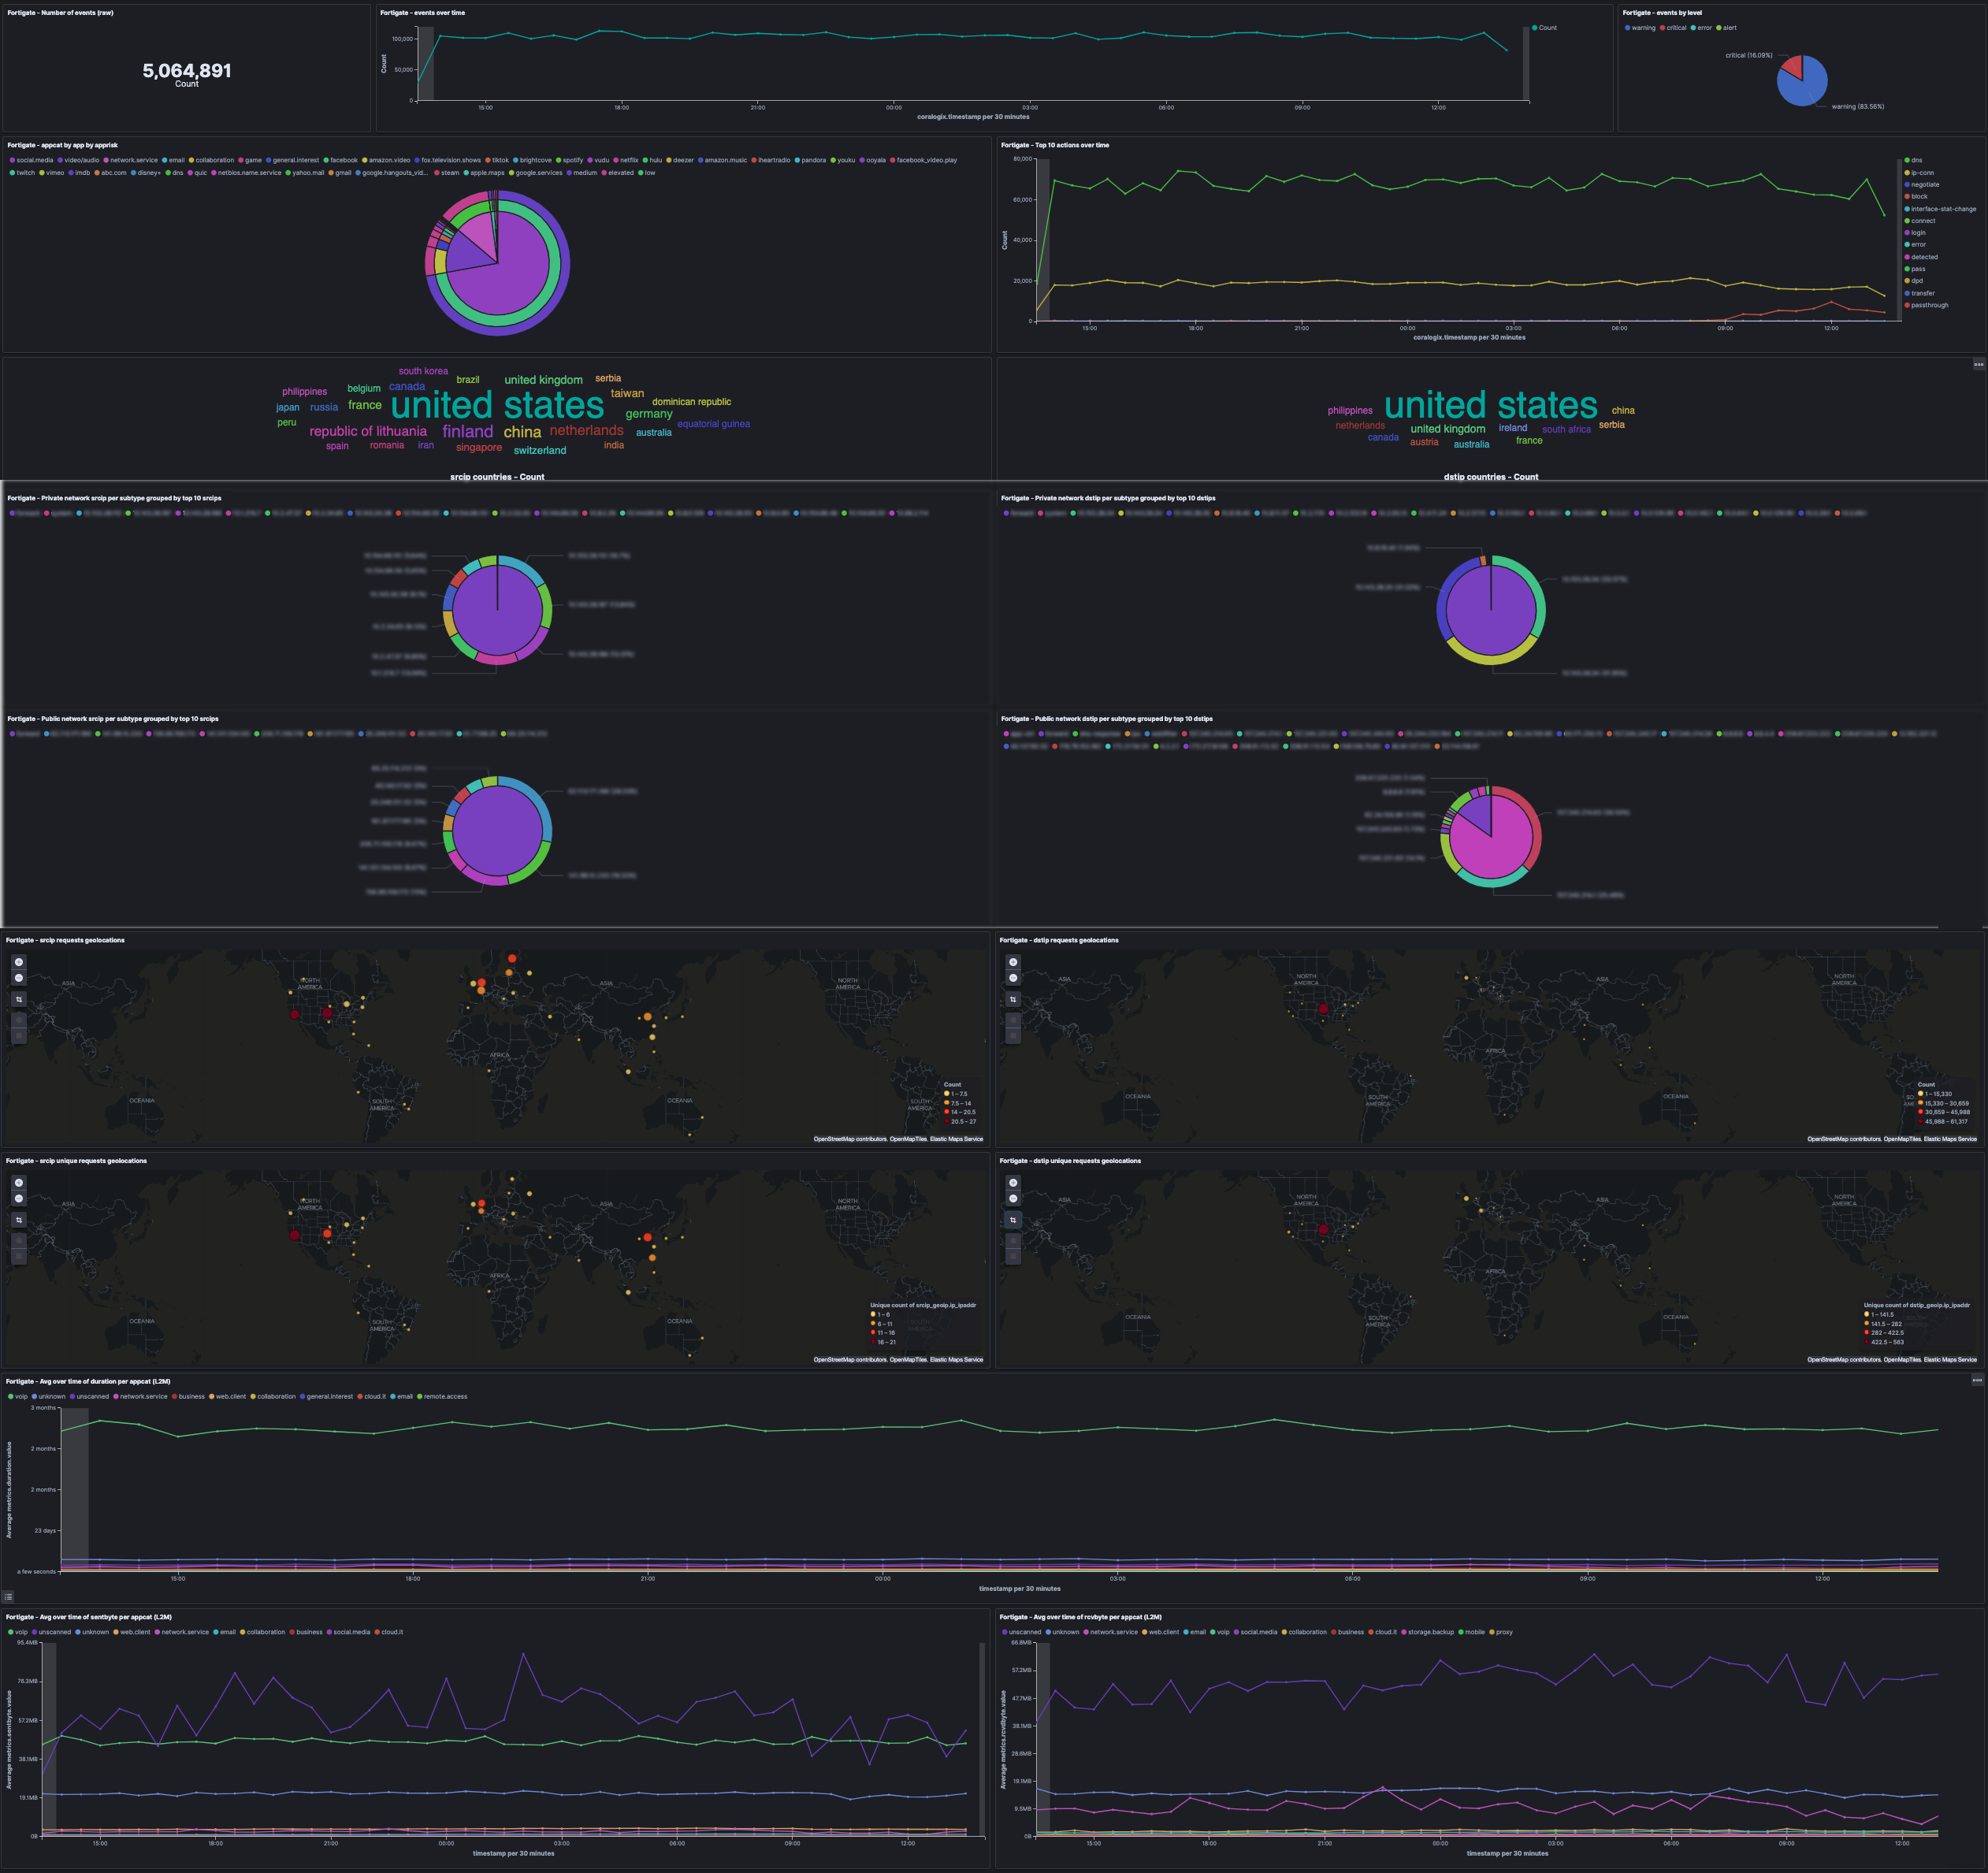
Here is an example FortiGate firewall Overview dashboard we created using FortiGate data. The options are practically limitless and you may create any visualization you can think of as long as your logs contain that data you want to visualize. For more information on using Kibana, please visit our tutorial.
Coralogix User-defined alerts enable you to easily create any alert you have in mind, using complex queries and various conditions heuristics, thus being more proactive with your FortiGate firewall data and be notified in real-time with potential system threats, issues, etc… Here are some examples of alerts we created using traditional FortiGate data.
The alert Condition can be customized to your pleasing and how it fits or satisfies your needs.
| Alert name | Description | Alert Type | Query | Alert condition |
| FortiGate – new country deny action | New denied source ip | New Value | action:deny | Notify on new value in the last 12H |
| FortiGate – more than usual deny action | More than usual access attempts with action denied | Standard | action:deny | More than usual |
| FortiGate – elevated risk ratio more than 30% | High apprisk ratio | Ratio | Q1 – apprisk:(elevated OR critical OR high) Q2 – _exists_:apprisk |
Q1/Q2>0.3 in 30 min |
| FortiGate – unscanned transactions 2x compared to the previous hour | double of unscanned transactions comparing to previous hour | Time relative | appcat:unscanned | current/an hour ago ration greater than 2x |
| FortiGate – critical risk from multiple countries | alert if more than 3 unique destination countries with high/critical risk | Unique count | apprisk:(high OR critical) | Over 3 unique dst countries in last 10 min |
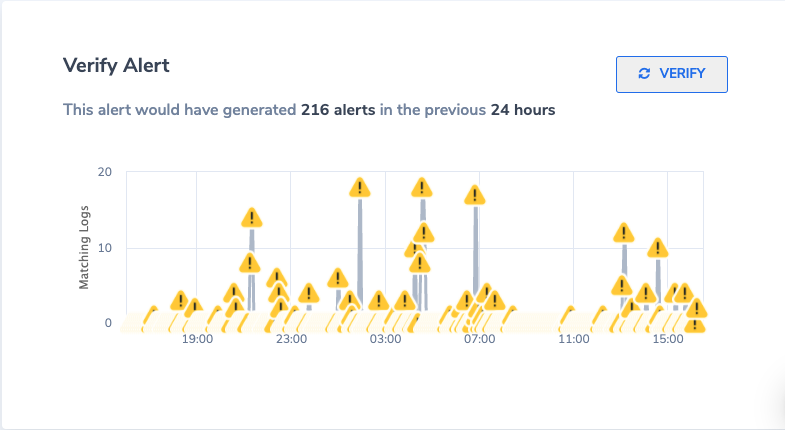
To avoid noise from these Alerts, Coralogix added a utility to allow you to simulate how the alert would behave. At the end of the alert, click verify Alert.
Need More Help with FortiGate or any other log data? Click on the chat icon on the bottom right corner for quick advice from our logging experts.
An effective alerting strategy is the difference between reacting to an outage and stopping it before it starts. That’s why at Coralogix, we’re constantly releasing new…

If you’re just getting familiar with full-stack observability and Coralogix and you want to send us your metrics and traces using the new OpenTelemetry Community Demo Application,…

In the world of data observability, there are several distinct problems to solve. Fast queries, intuitive visualizations, scalable storage, and more. The technical problems receive the…
