TL;DR: Coralogix released a new addon for Heroku: https://elements.heroku.com/addons/coralogix. In this post we cover best Logging practices, how different cloud providers enable them, what makes Heroku logging special, and how Coralogix utilizes Heroku’s approach to provide it’s 3rd generation logging experience.
Lost in the Clouds
Widespread cloud hosting opened a world of possibilities for developers, reducing the need to maintain, monitor and scale their own infrastructure, and instead focus on building their applications. When cloud services are working the way you expect, then the ability to not have to worry about what is happening behind the scenes is a liberating one, but alongside this also gives your lack of control and when you experience a problem (and you will), tracing its source can be a challenge. A typical source of information is your log files, but as infrastructure, locations and services constantly shift around the World, where do you look, how do you access them and what should you log that’s relevant to such a setup? In this post, I will mainly focus on Heroku, and compare it’s very different way of handling logging to most other cloud providers.
Enable logging: This sounds like an obvious rule in an article about logging, but double check you have enabled logging before deploying your application and don’t solely rely on your infrastructure logging.
Categorize your logs: Especially in a distributed system, the ability to filter logs to particular categories, or error levels such as authorization, access, or critical can help you drill down into a barrage of information.
Logs are not only for you: Your logs are useful sources of information for a variety of stakeholders including support and QA engineers, and new programmers on your team. Keep them readable, understandable and clear as to their purpose.
Use 3rd party systems: There are dozens and dozens of 3rd party logging tools to help you consolidate and understand your logs better. From open source to SaaS options, you will find a solution that suits your needs.
Use standard logging libraries: whether you are writing to file or using a log aggregator, always prefer a standard logging library over doing your own log printing, we ofter see mistakes like using console.log which causes break-lines to be read as separate lines, etc. There are many great logging libraries out there for most languages, prefer them over implementing your own logging.
Amazon Web Services
In true Amazon fashion, AWS has its own custom solution for logging that integrates well with all aspects of its service but requires learning new tools and processes. CloudWatch Logs aggregates real-time and streamed logs from various AWS services into one convenient location, and adds alerting to CloudTrail based on defined conditions and events. CloudWatch has integrations with about a dozen 3rd party partner services including Splunk and DataDog, but if your provider of choice isn’t on that list then you have to rely on CloudWatch or parse the logs yourself from an S3 bucket.
Google Compute Engine offers Stackdriver that’s based on the open source fluentd logging layer. If you’re a GCE user, then it’s your best option, with direct connections to Google’s storage and analysis products. Intriguingly it also works with AWS (but not Azure), making it an ideal candidate, if your application runs across multiple clouds (and it should). Stackdriver receives log entries from multiple sources across the GCE stack, including VMs and applications. You can analyze your logs via a semi-searchable GUI, an API, or CLI tool.
Heroku
Heroku takes a different approach to cloud-based application development, shifting the focus from infrastructure to applications. Combined with Heroku’s tools for Docker, Git and CLI workflows, it makes developing applications for testing and production a breeze. However, the ephemeral nature of Heroku makes knowing what’s going on behind the scenes of your application something of a mystery at times.
By default logging consists of using the subcommand heroku logs to view output, and with a variety of parameters to filter the source or dyno (Heroku parlance for an instance), but once you add multiple dynos (which you invariably will as you scale) getting to grips with what’s going on in your logs can be difficult. Filtering the log output is a start, but you need to know where to look before you start looking, and generally, you resort to logs because you’re unsure what the problem is.
To aid the process Heroku offers the ‘Log Drains’ feature to forward raw log output to 3rd party providers, or providers of your own creation. This makes initial log usage harder, but by removing an official logging solution, offer far more flexibility over your specific needs in the longer term.
Coralogix and Heroku
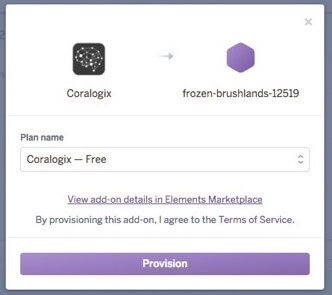
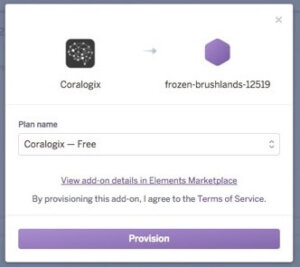
Coralogix has recently released a logging add-on that forwards all Heroku output to a Coralogix account you specify.
Or use the CLI with:
heroku addons:create coralogix:test
Then within a few seconds, any logs that your application generates will feed right into Coralogix, ready for use the high scale, high-speed search and analytics that Coralogix offers. Here’s a simple example, that shows that even with a small application generating simple log records, as soon it starts scaling, logs become hard to traverse and understand.
Sample Application
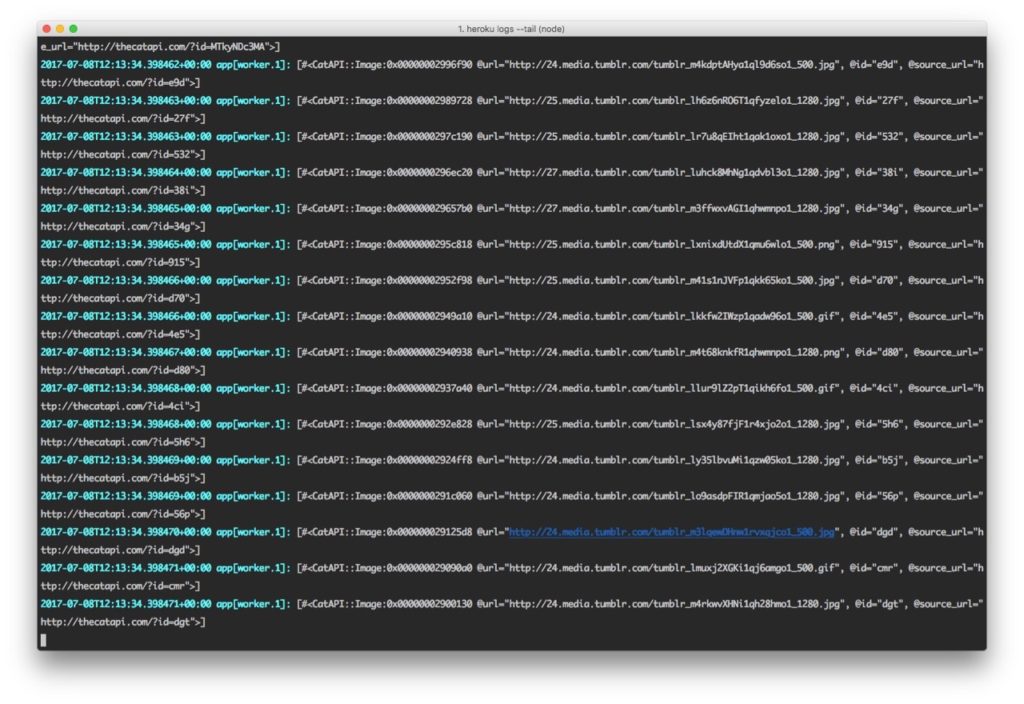
The sample application consists of a Python and Ruby application that randomly generates a cat from the Cat API every 2 seconds and logs the value.
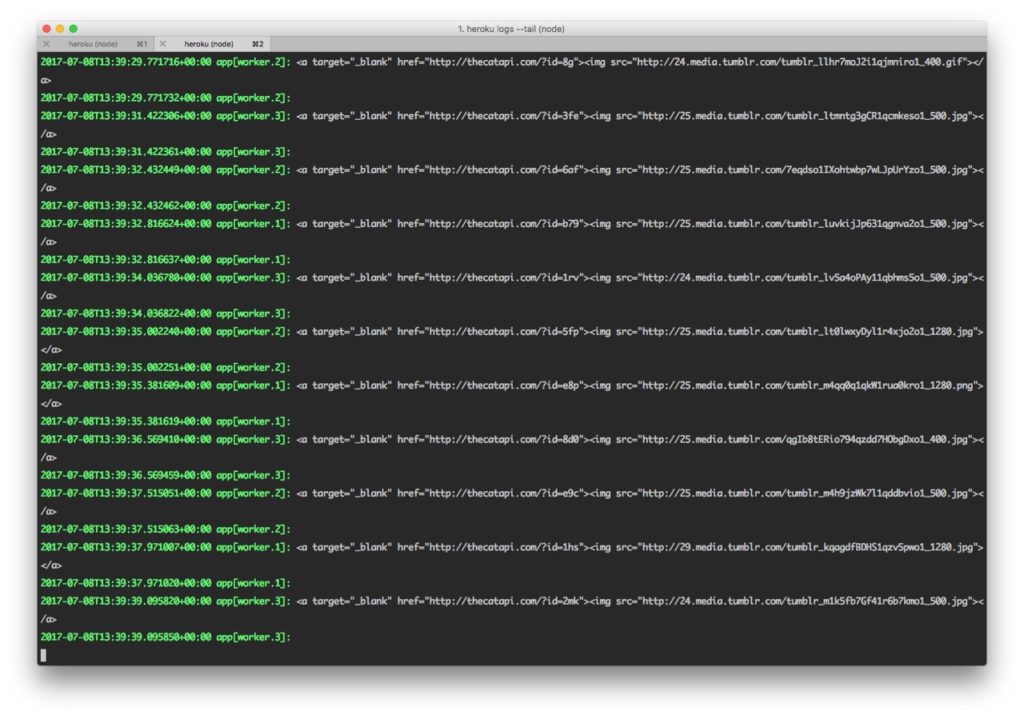
I started with one instance of each, then scaled to three instances, here are the logs using heroku logs one one instance.
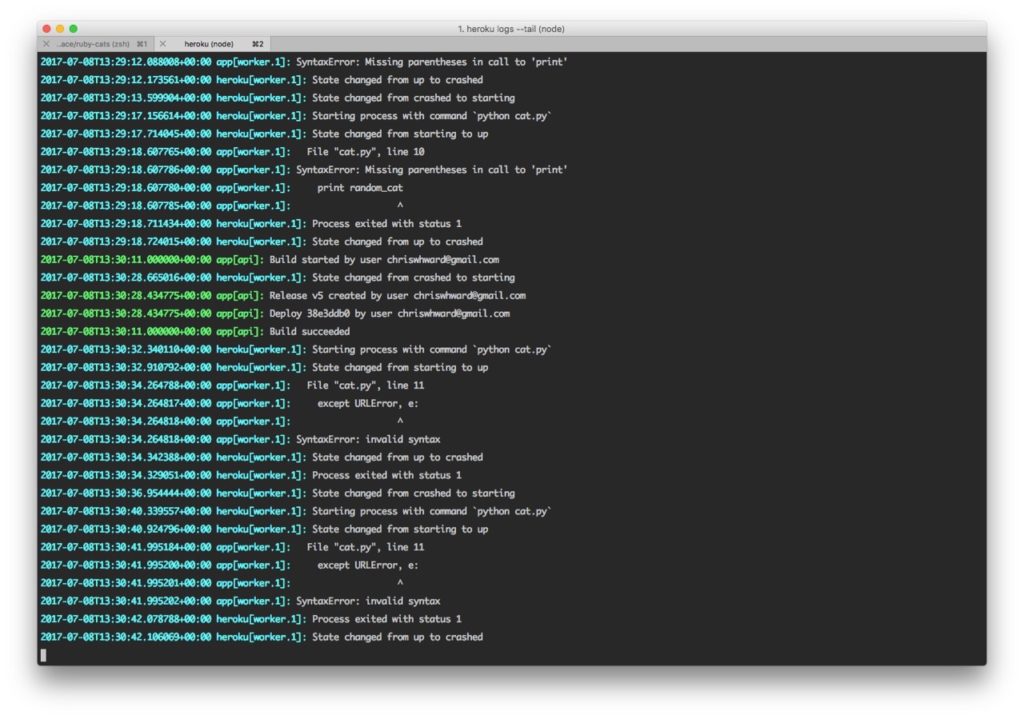
And another example of mixed logs with messages from Heroku, debug messages and errors, already getting confusing.
Throw in two more workers and tracking down the source of messages is getting even more confusing. And the sample application has two applications running three workers each.
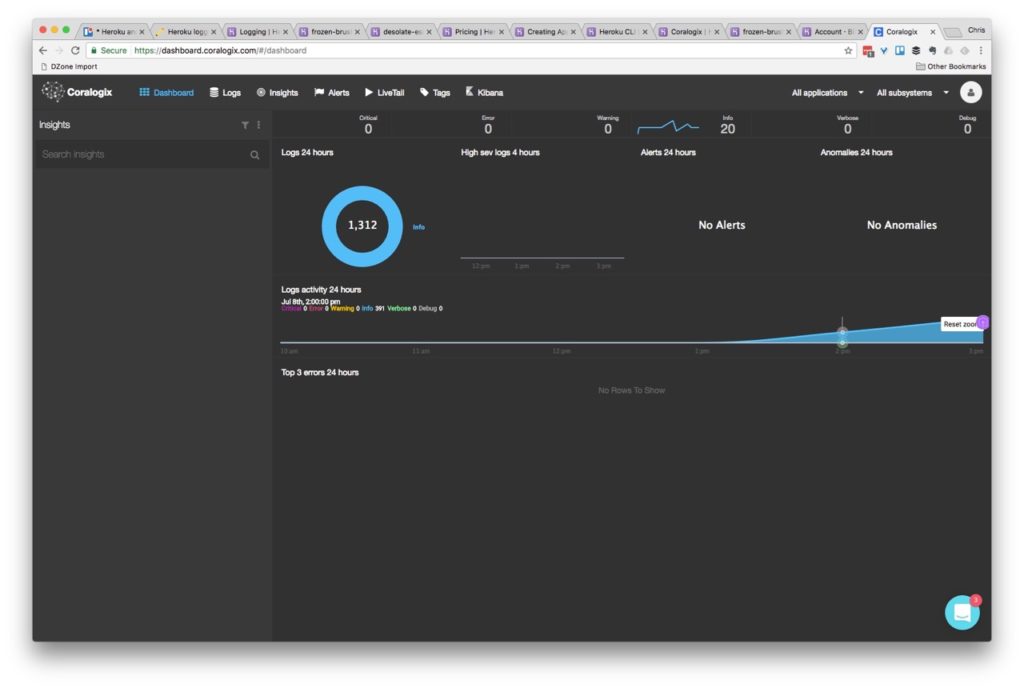
Let’s use Coralogix instead. You can open the dashboard page, or again use the CLI and see the initial display right after you start sending logs:
CLI: heroku addons:open coralogix
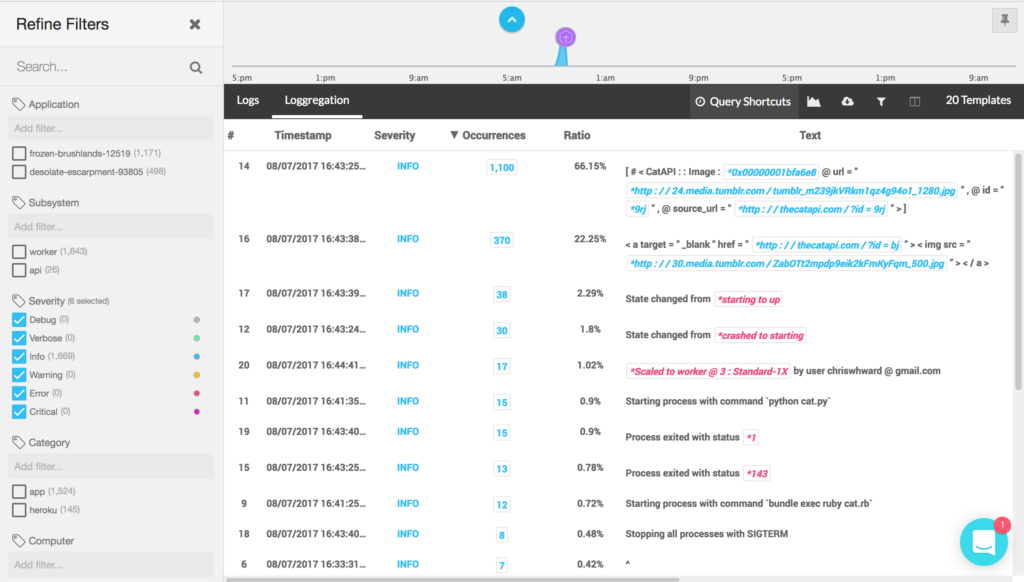
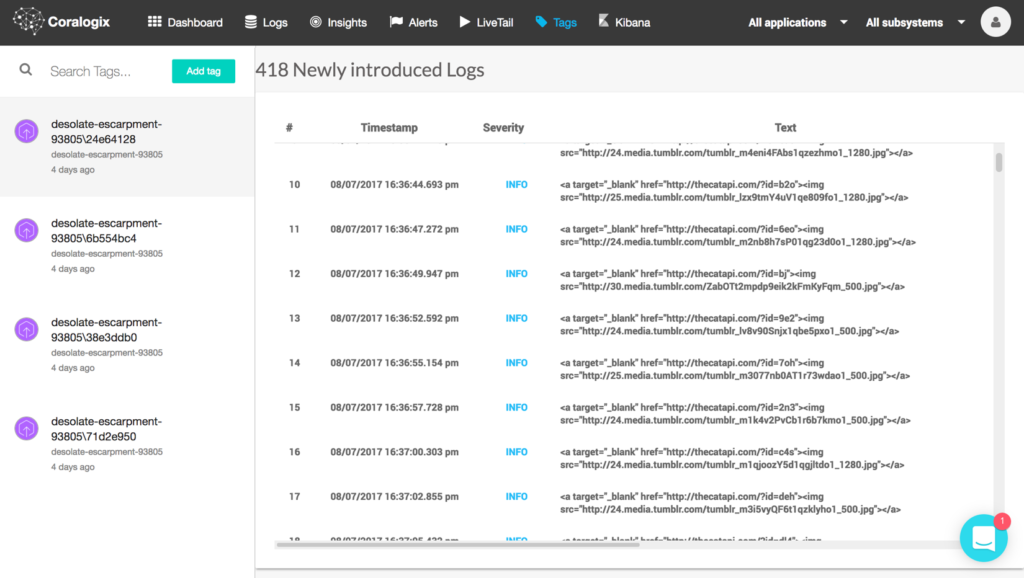
After 24 hours, Coralogix’ Loggregation feature will kick in to automatically cluster log entries and make finding what you need faster and easier. In the screenshot below you can see that Loggregation has identified that despite being ‘random’, the CatAPI repeats itself a lot, outputting the same value over 1,000 times. In this case, it’s not important, but in a mission critical application, this helps you identify patterns clearly.
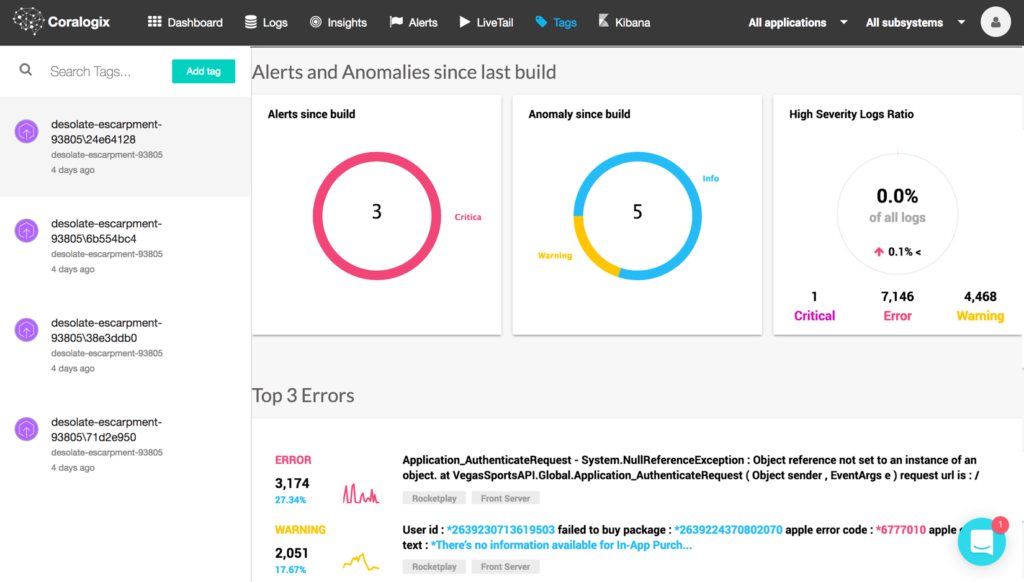
Errors and broken flows are often introduced by new versions and builds of an application. Coralogix’s integration with Heroku includes an integration to Heroku Pipelines and offers an automatic status for new Heroku builds (or tags). Coralogix presents the suspicious and common errors introduced since that build as well as the alerts and anomalies which might be related to the new version release, thus allowing you to pinpoint issues to particular versions and points in time.
After 5 days of learning, Coralogix will start to send a daily report highlighting new anomalies (errors and critical messages), further helping you identify new errors, and not constantly bombard you with logging noise.
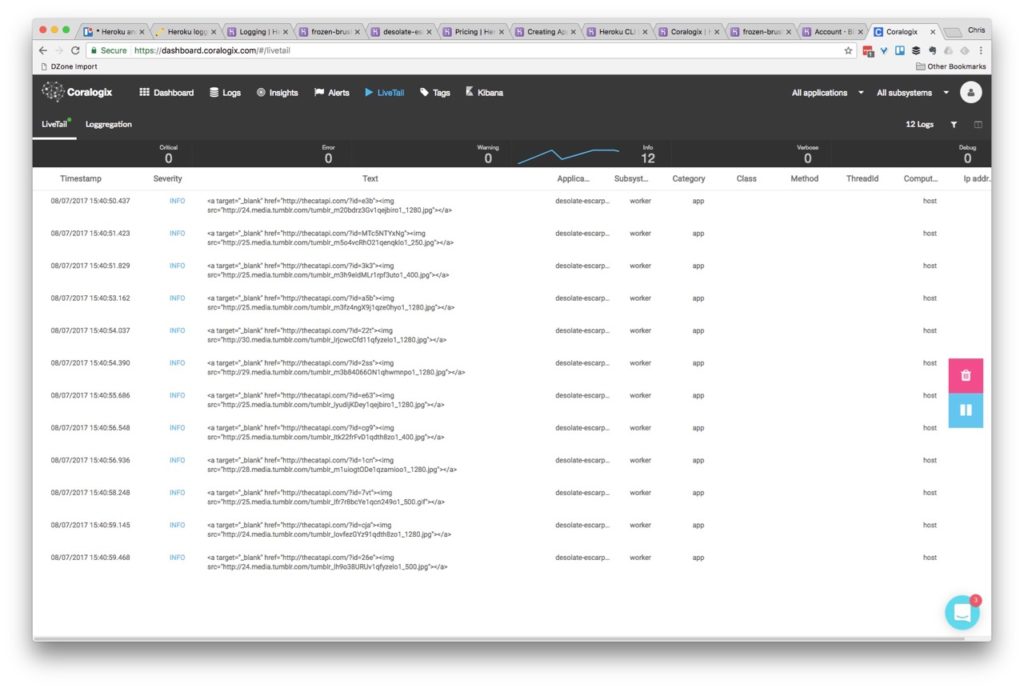
In addition to the machine learning aspect, Coralogix offers the entire set of Logging capabilities, including Log Query, a centralized live tail, user defined alerts to email or slack, and a fully hosted Kibana for data slicing and dashboards creation.
Making Logging Personal
I started this post by highlighting best practices for logging, and many of them focus on making logs work for you and your team. By compelling you to use their own internal solutions, many of the cloud providers can make your logging experience impersonal and unfocused. Whilst logging with Heroku can take extra steps, to begin with, when you get the setup honed, it can result in a logging system that truly works the way you want and helps you see the issues that matter.
In recent years, microservices have emerged as a popular architectural pattern. Although these self-contained services offer greater flexibility, scalability, and maintainability compared to monolithic applications, they…
Distributed microservices and cloud computing have been game changers for developers and enterprises. These services have helped enterprises develop complex systems easily and deploy apps faster….
Gaming apps are complex systems. They combine multi-function systems, like the game engine, to other resources such as server containers, proxies and CDNs in order to…
Where Modern Observability and Financial Savvy Meet.