Ruby logging best practices and tips
Ruby is an opinionated language with inbuilt Ruby logging monitoring options that will serve the needs of small and basic applications. Whilst there are fewer alternatives…
As software is evolving away from monoliths and towards service-based architectures, it is becoming more apparent than ever that monitoring logging performance needs to be a first-class consideration of our architectural designs.
This article will explore how to build and maintain a logging solution for a microservice-oriented containerized application, how to address some common difficulties which come with running such a solution, plus some tips for debugging and eliminating bottlenecks.
Although primarily for large businesses, public sector, and non-profit organizations operating at scale, the architecture discussed here could easily be implemented in smaller-scale applications that anticipate scaling issues in the future.
There are many options out there for containerization, log formatting, pub/sub, indexing, and visualization, all of which have their pros and cons. This article will not attempt to analyze or compare every permutation of a reliable & scalable logging architecture, as the field is fast-moving and any such benchmarking and feature listing would become dated very quickly.
Instead, for longevity and simplicity, we’re going to work with industry-standard components which are known to work reliably at scale and have the development resources required to be healthy for years to come:
This architecture is built entirely from mature and open source components, so they can be implemented long before their high availability functions are required and scaled up to meet the demands of any distributed application as it grows.

This section gives a high-level overview of configuring and connecting all of the moving parts of our architecture, optimized for logging performance. We won’t be focusing on code snippets or low-level implementation details as these are likely to differ significantly between application stacks. Instead, we will examine the implementation principles suitable for all scalable applications.
We will focus entirely on how to set up the logging pipeline, and it’ll be assumed that our application is already set up and running on Docker/Kubernetes or similar.
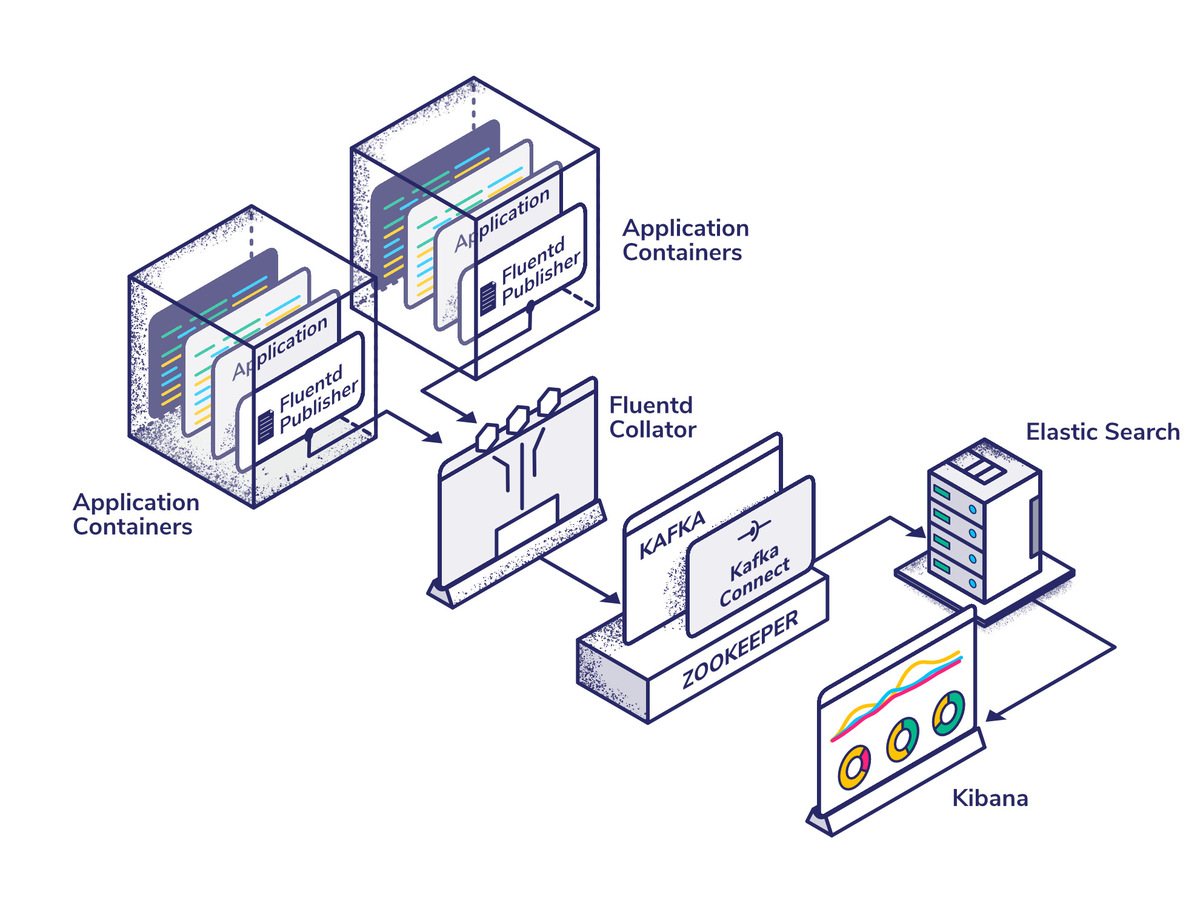
The first significant service in our stack is Fluentd, an application that collates logs from our Docker containers (called pods in Kubernetes), parses and formats them, and then publishes them to an external datastore, in our case, Kafka.
Fluentd works with output plugins which allow it to connect to various external stores. For our purposes, thankfully there is a mature Kafka connector with millions of downloads and a long history of being well-maintained.
There is also great documentation on the Fluentd website which explains how to set the application up as a Kubernetes DaemonSet, which is a way to ensure that each node in our cluster runs a copy of the Fluentd pod. The documentation uses the ElasticSearch output plugin, but it won’t be too difficult to modify it for our purposes.
Before putting logs onto Kafka, you’ll want to define the structure of the data we want to publish. This will be unique to the application, you’ll probably want to use the concatenation plugin to merge multi-line Docker logs.
From a point of view of logging performance, you can use buffering. This is built into the Kafka output plugin, which allows us to write our logs to a temporary file and publish them to Kafka every few seconds instead of writing each log line individually. This vastly reduces your connection & I/O overheads in exchange for a negligible delay in publishing your logs.
The default data structure which Fluentd puts out is perfectly serviceable, but depending on your application and the types of events we’re particularly interested in, we might want to create new fields from data found within our logs. Fluentd’s powerful configuration and wide array of data parsing and transformation plugins make this fairly trivial. However, it can take a bit of time to configure it exactly to your liking.
Apache Kafka needs no introduction. In the past decade it’s gone from being a niche internal platform at LinkedIn to one of the most popular open-source tools in the industry. Kafka has a reputation, which is not entirely undeserved, for being difficult to configure and maintain. However, with a bit of perseverance and willingness to consult the documentation, it’s difficult to beat for moving large amounts of data across a web-scale system.
Anyone who has set up Kafka has probably come across Zookeeper, but it’s often thought of as more esoteric and many people don’t understand why they need Zookeeper to manage Kafka. Zookeeper operates as the ‘brains’ of the setup; it handles orchestration and brokering of information and services across the Kafka cluster.
There are plenty of offerings when it comes to Kafka on Kubernetes. My personal preference is Yolean’s Kafka StatefulSet repo, which aims to be a “production-worthy Kafka setup for persistent (domain- and ops-) data at small scale”. As per the description, it will need some configuration tweaks to operate at scale (we’ll come back to this later), but it offers a well-tailored starting point to build on.
As of 2020, there is an example in the variants directory of the repository which covers scaling up the configuration to 6 replicas on GKE, which will provide a good starting point for our setup.

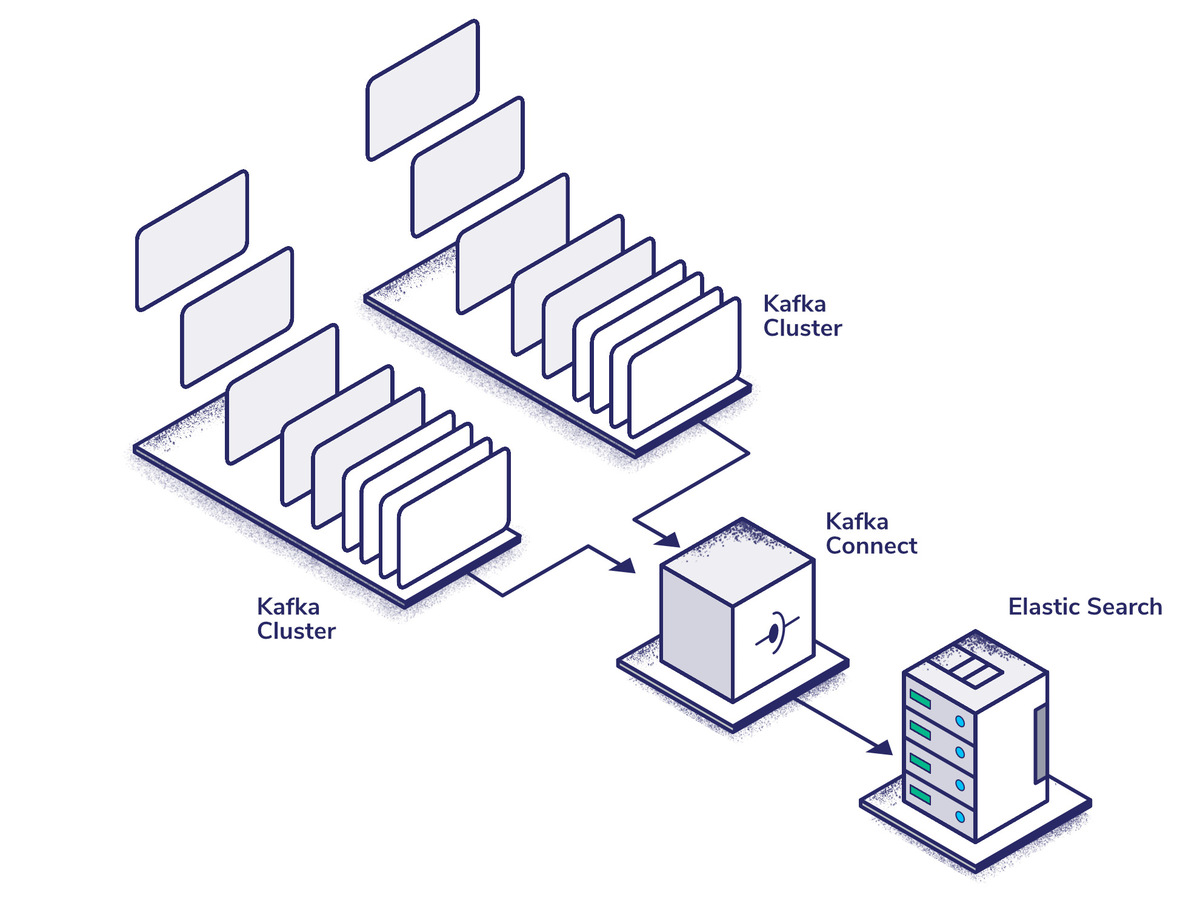
Kafka Connect is an application for managing data I/O from Kafka. Since Fluentd has its own publisher plugin, you don’t need to worry about the source side, but there is a sink which allows us to push data directly to ElasticSearch.
You could write a custom consumer to replace Kafka Connect in our stack, but in most cases with logging, Kafka Connect is more than capable and abstracts away a lot of the complexity of writing scalable, high availability applications. Kafka Connect also provides at least once delivery by default. Whilst exactly once delivery is possible, it has a significant performance overhead and is probably unnecessary for this use-case as you can de-dupe any message delivered multiple times with ElasticSearch.
Conveniently, Confluent Inc offers a pre-built Docker image for setting up a distributed Kafka Connect cluster, so all you have to do is write a Kubernetes manifest to scale it to your application’s needs.
ElasticSearch is the industry standard when it comes to self-hosted highly searchable databases. There is an official Kubernetes distribution for the application, which we’ll be using for our logging stack.
Once you have ElasticSearch set up, assuming everything is configured correctly, you should be able to watch your logs move through the pipeline. You’ll need to make sure you have enough storage space and resources allocated to your components, especially Kafka and ElasticSearch which can both use significant IO and computational resources.
Because we’re using Kubernetes, high availability is a well-documented concern. You will need to set up a load balancer that can balance traffic between multiple control planes, each of which will be located in different regions. Some cloud providers manage this behavior automatically on their managed Kubernetes offerings, but the official documentation explains detailed options for setting it up on a self-hosted cluster.
Now that you have the skeleton of your stack set up and working, you should do a bit of fine-tuning to ensure that our logging performance is up to the task of handling our application. This section will focus on configuring scalable and resilient applications rather than horizontal scaling, as the latter is largely managed by Kubernetes.
This is by no means an exhaustive list of performance tweaks, because that could be a series of articles by itself, but it aims to highlight the quick performance wins we can achieve when operating Kafka at scale.

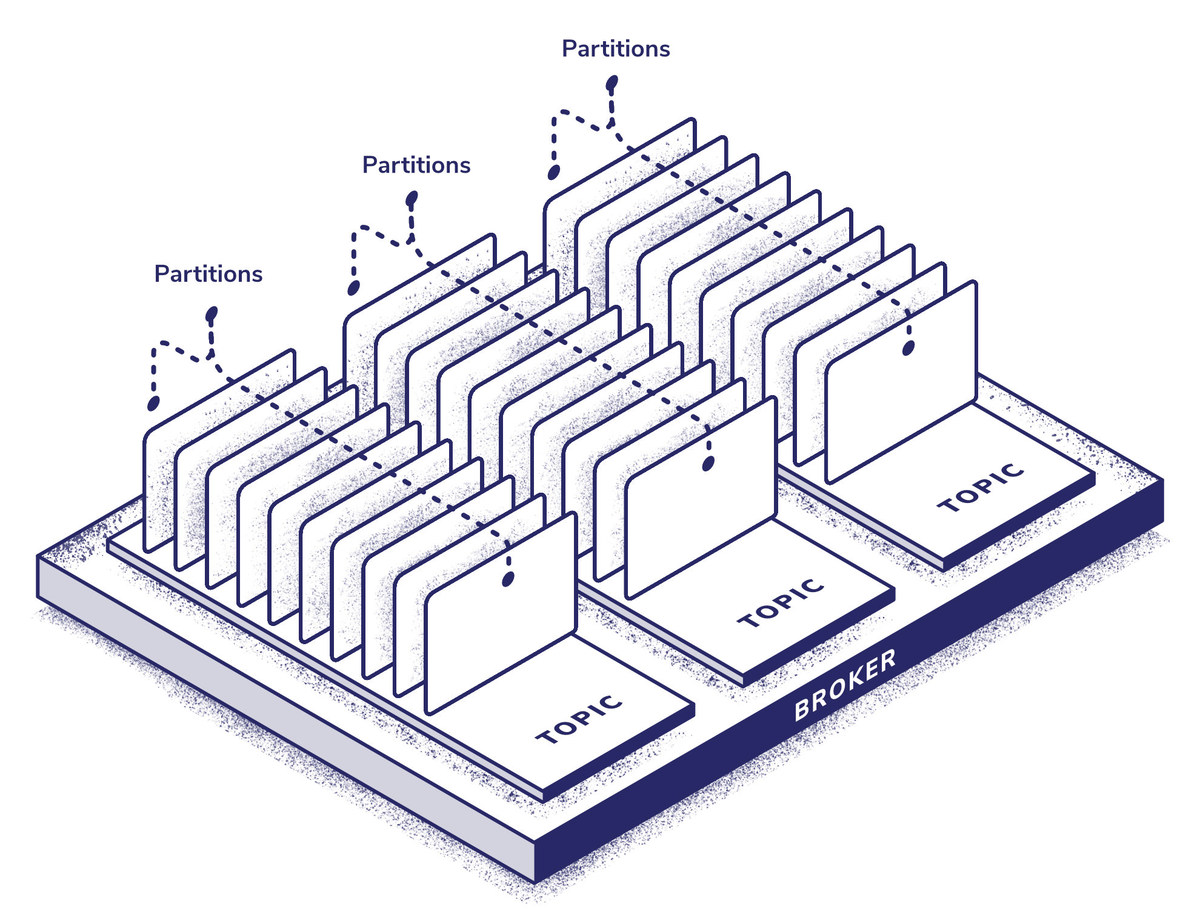
Kafka’s topics are the service’s system for sorting messages, though in this logging setup we’ll be using a single topic with multiple partitions. A good rule of thumb for determining how many partitions to start with is to work out the throughput per producer (P), the throughput per consumer (C), and the total throughput (T). Then we can take (max(T/P, T/C)) as a starting point. Increasing the partitions on the fly can be done, but it can have a fairly significant performance impact whilst load balancing occurs, so it’s always better to overprovision than to underprovision partitions.
This resource on the Confluent blog goes into more depth on the subject, but nothing will be better for determining the number of partitions you need to run than trial and error, because it’s so different for every application. It’s recommended that you don’t use more than 4,000 partitions per broker.
Many system-level options can affect Kafka’s performance, and this could easily be an article on its own. Some of the most important things to look at are:
You should also avoid having Kafka share disks with any other application, as this will significantly slow down disk operations for what can be a very disk-hungry service.
Most of the default settings in Zookeeper are surprisingly suitable for scaling, but for some use cases it’s worth looking at timeout, max connections, and buffer settings.
The Fluentd Kafka producer doesn’t compress messages by default. For most use cases, it makes sense to enable gzip compression as it significantly reduces disk I/O and network traffic in exchange for a small CPU overhead.
One positive aspect of using these tried-and-tested industry-standard applications is that they’re all probably running on applications with greater logging needs than yours, which means that any of the issues you’re going to run into, someone else has probably already solved. Unfortunately, finding those solutions can prove challenging because they’re not common problems – scalable logging in general isn’t a common domain.
The first step to fixing a problem is finding out where it is. Kubernetes has quite a few tools for troubleshooting, but I prefer to use Prometheus, which can be easily configured to directly monitor each node’s disk I/O, CPU usage, memory usage, and network usage. This usually makes finding the source of speed troubles fairly simple.
Often, you can improve logging performance by simply scaling whichever service is experiencing bottlenecks, either horizontally by requiring more pods or vertically by allocating more resources to our cluster nodes.
With Kafka, often the issues are disk I/O based, and they can be eased by allocating faster disks (SSDs instead of hard drives), more disks (organized in a write-optimized configuration like RAID-1 or RAID-10), or tweaking the pagecache configuration for the service.
Building pipelines optimized for performance and stability can be a rewarding and educational experience, but it can also be expensive, time-intensive, and difficult, despite the leaps and bounds of qualify of life that have come along with open source tooling and containerization.
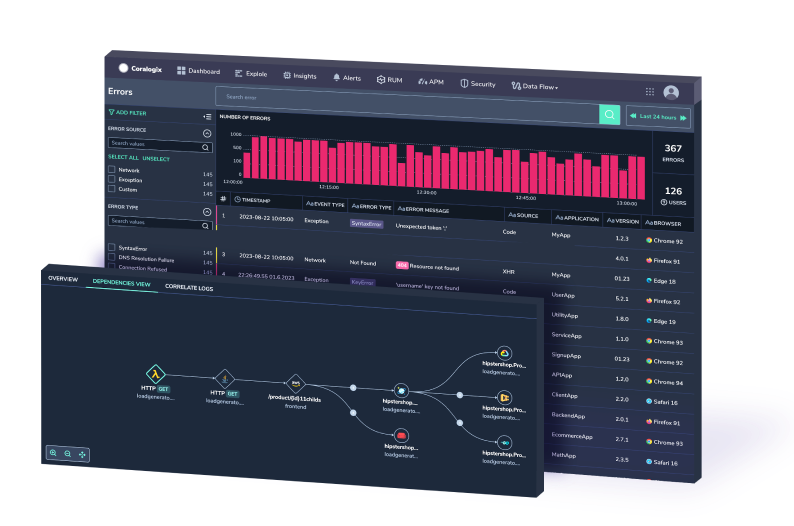
Coralogix is an observability platform optimized for scalability and stability, which maintains power-user friendliness via a wide array of integrations and customization options without sacrificing ease of use.
Coralogix services are priced based on GB of logs ingressed, which means that they can grow organically with your business, and they offer easy integrations with almost every dashboard and data source conceivable (and a powerful API for custom integrations). For Kubernetes ingress, they offer documentation and real-world examples for configuration, which is no more than a few lines of config for even the largest clusters.
Whether or not Coralogix makes sense for your organization is likely to depend on your in-house ops resources, level of expertise with Apache Kafka, and ability to quickly troubleshoot and rectify the issues that come with scalable data streams. If you’re not sure whether our managed platform is suitable for your use case, check out our 14-day free trial.
