Today we’re happy to announce a new business model for logging and optimizing cloud cost, allowing you to finally define the data pipeline your log data will go through based on the importance of data to your business and the price you are willing to pay for it.
CIOs see data costs as their greatest logging challenge to overcome, according to this survey we collaborated on with IDC. If you’re running significant production operations, you’re almost certainly generating 100’s of GB of log data every day. Naturally, you’re also monitoring those logs and querying for incident investigations.
However, most log data is never queried or analyzed, yet makes up the majority of logging costs. That’s a shocking fact when you consider that some organizations end up having to limit important logs due to overwhelming amounts of less useful data. The price you pay for the most critical log is identical to the price you pay for the most irrelevant log.
To further complicate things, the volume of log data is generally volatile – making it difficult to predict the costs, which is not the case for tracing or metrics that are relatively stable.
The entire Coralogix team decided to spend the past year focused on creating an array of capabilities to tackle this challenge head-on.
These new capabilities not only succeed in drastically reducing logging costs but also improve your ability to query, monitor, and manage your data.
Low priority: Non-important log data that needs to be kept for compliance/post-processing reasons, will go straight to your archive.
Medium Priority: Logs that are used for monitoring or statistics will be fully available for those use cases by allowing you to define alerts, build dashboards, view statistics, query the live data stream, and receive proactive anomalies.
High Priority: Your most important logs, typically high severity, or business-critical data will be stored on highly available SSDs, replicated, and ready to be queried within seconds.
You can always move your data from one level to another, even retroactively.
This new model enables you to get all of the benefits of an ML-powered logging solution at only a third of the cost and with more real-time analysis and alerting capabilities than before.
Use Case 1 – Web Server Logs
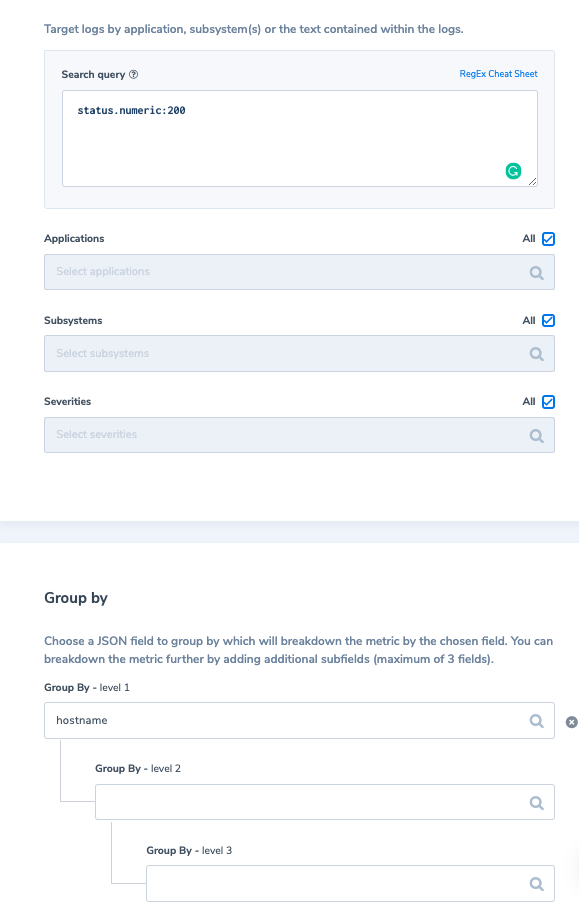
Most of your web server logs will probably be the “Status 200”, but do you actually need to index these INFO level logs that are generated in massive quantities and worry that they’ll consume most of your logging quota?
Assigning a medium priority to these logs allows you to archive them to your S3, query and view them in real-time in LiveTail, create alerts on them, create custom metrics based on them to be saved for a year, and once you need to pull them out of your S3 archive, e.g. when an alert is triggered, you can do it easily by directly syntax-querying the archived data.
A typical case we’ve seen is to have ~95% status 200 (info severity) out of all web server logs. That means the majority of server logging quota is unnecessarily wasted.
With Coralogix TCO, you simply designate these logs as medium-priority and they get archived to your S3 bucket. The amazing thing is you can still view a live stream of these logs in LiveTail, and anomalies continue being generated and custom alerts triggered even though the logs are not being indexed.
You may also use Logs2Metrics to create a custom metric representing the count of these logs with a 1-minute granularity of buckets and labeled by (i.e. grouped by) hostname. The metric data will remain available for 12 months.
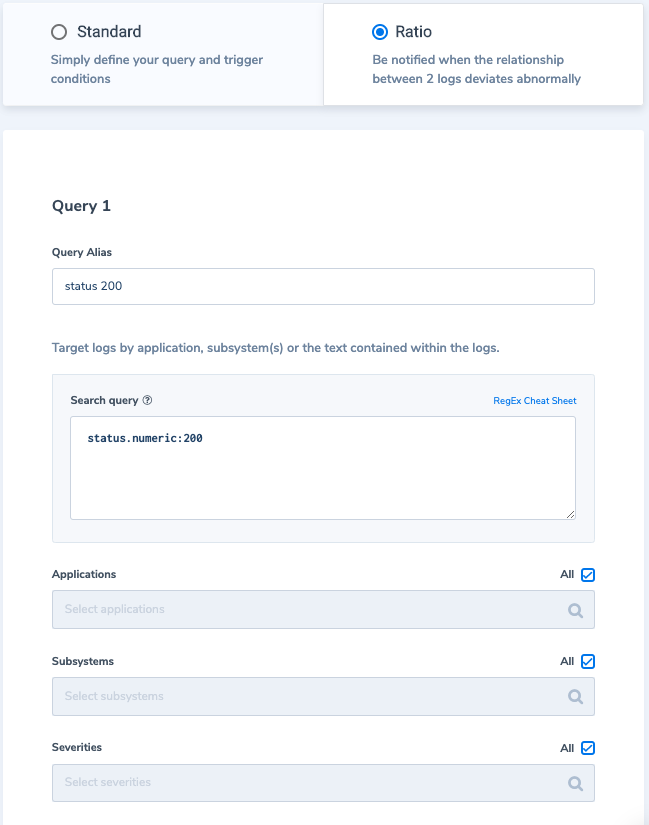
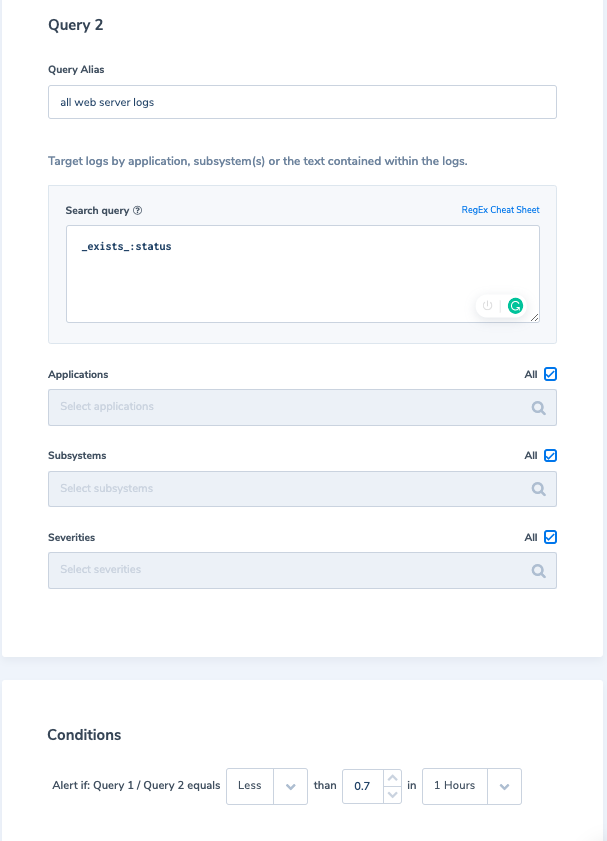
Taking things further, we can create an alert for a scenario where these status 200 logs are arriving with a ratio less than a certain threshold (which can indicate a potential issue as we expect activity to remain the same). We will use a “Ratio” type alert, using the first query to match all status 200 logs and for the second query, we’ll match all logs with the field status.
Alert Condition: Query 1 / Query 2 equals Less than 0.7 in 1-hour time window
Next, as we already set up our metrics above, once our alert triggers we can instantly go to the logs2metrics index and show a predefined data table visualization in Kibana showing how many status 200 logs we have per hostname so we can notice what hostnames are having significantly less traffic.
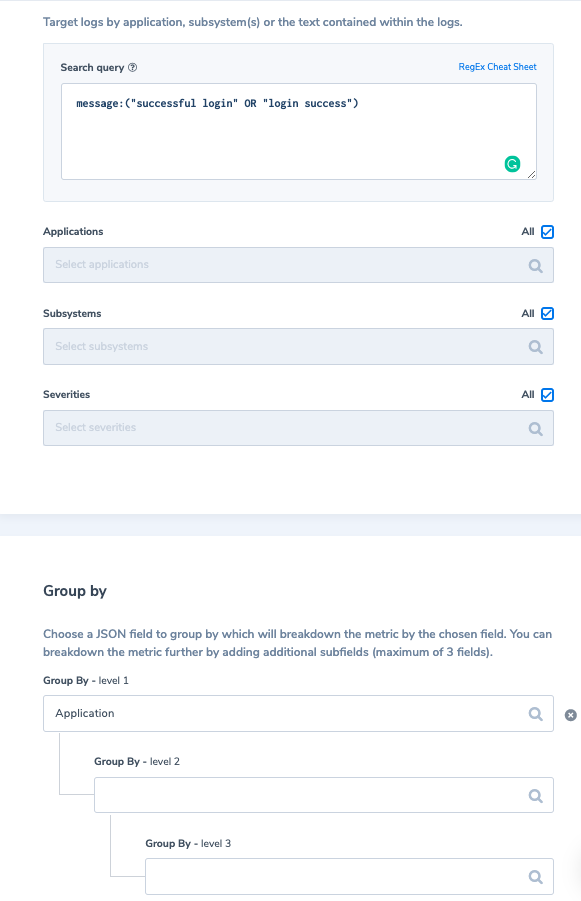
Use Case 2 – Application Logs
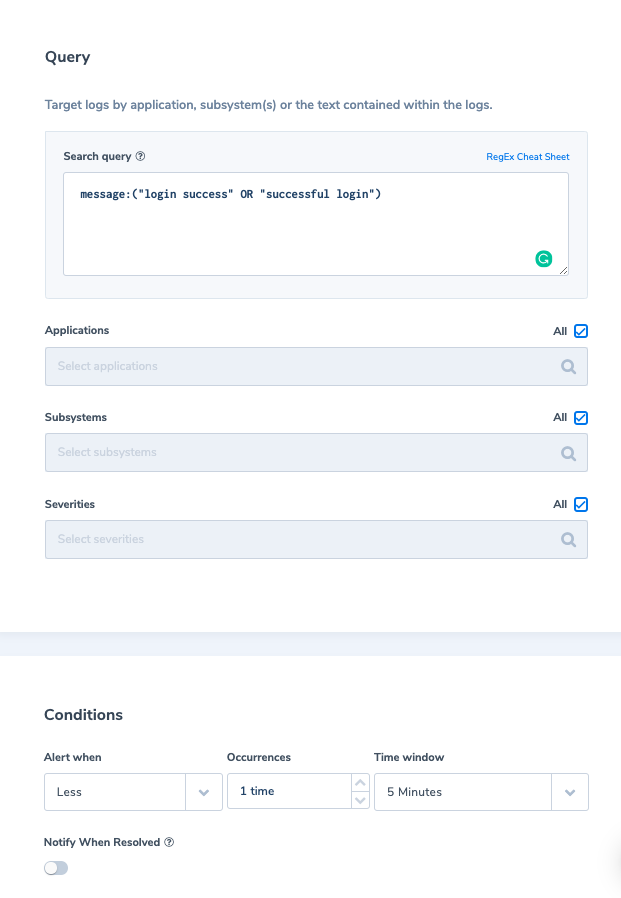
An example of application logs is successful login events. Is it really necessary to index these logs as per your Coralogix retention plan? Not necessarily. What we recommend doing is similar to our first example above; assign these logs as ‘medium’ priority. Second, we would create a metric of their count grouped by applicationName, saving the count of successful login events per application (for a period of 12 months). It will look like this:
We can also define an alert which would trigger if no user logged into the app in the last 5 min. Then we can respond faster to application issues. For example:
Use Case 3 – Security Logs
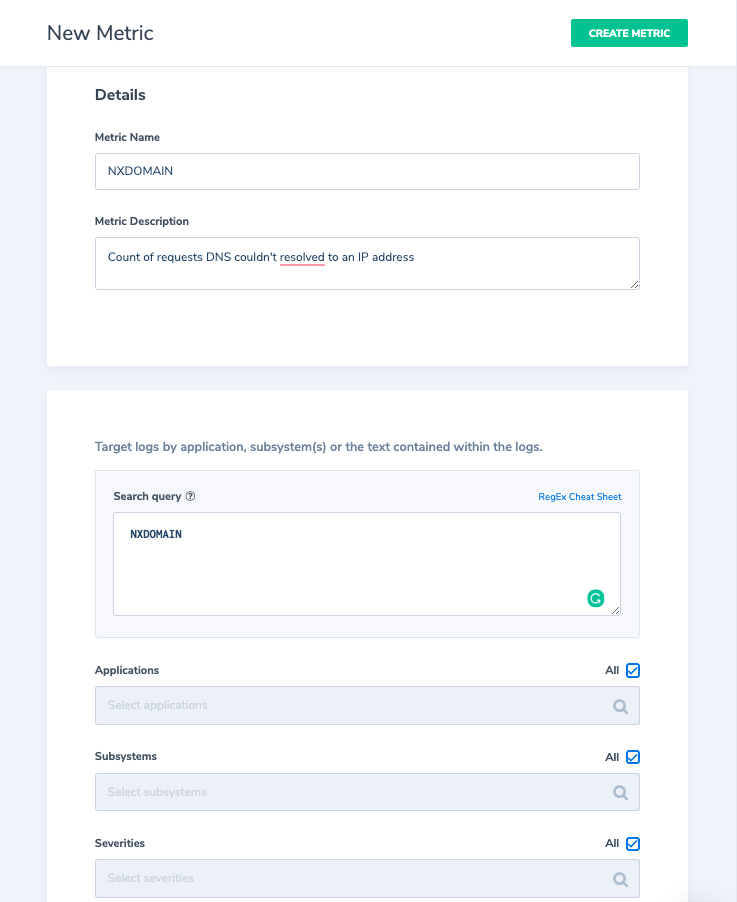
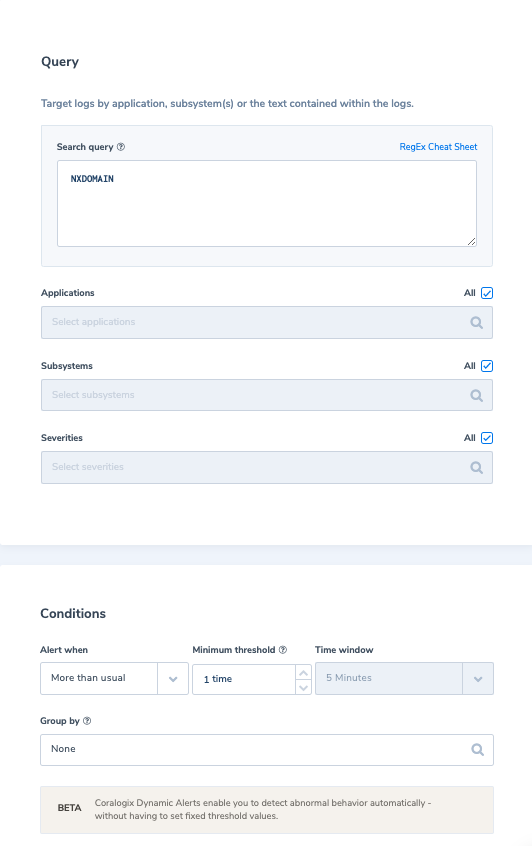
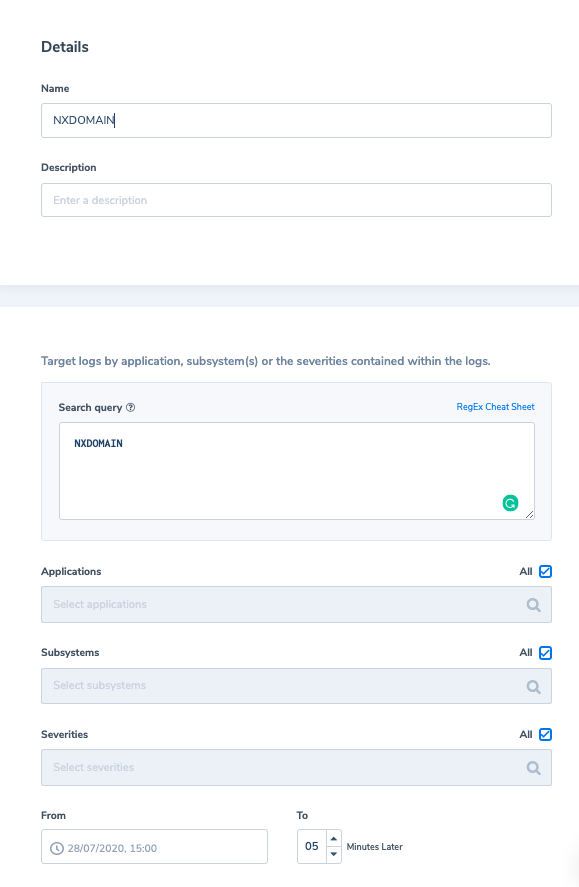
For our security logs example, let’s discuss NXDOMAIN error messages. The NXDOMAIN is a DNS message type received by the DNS resolver (i.e. client) when a request to resolve a domain is sent to the DNS and cannot be resolved to an IP address. An NXDOMAIN error message means that the domain does not exist. Understanding that, the question you can ask is: “if I don’t know from which domain a request came from, why do I need to maintain this data (the entire log including the message and all its metadata) in Elasticsearch”. What if I could aggregate how many logs with NXDOMAIN messages I have without indexing the actual logs? What if I only want to set up an alert to trigger when I am receiving “more than usual” NXDOMAIN requests from a specific host? With Coralogix we can do exactly that. First, we will create a metric to capture how many NXDOMAIN requests we have per-minute. This information will continuously be saved in the long term index.
Next, we will create the following alert to alert us if we have abnormal behavior which results in receiving more NXDOMAIN requests than we usually do.
And when such an alert is triggered, we can reindex the related logs from our S3 archive for further analysis, if required.
In recent years, microservices have emerged as a popular architectural pattern. Although these self-contained services offer greater flexibility, scalability, and maintainability compared to monolithic applications, they…
Distributed microservices and cloud computing have been game changers for developers and enterprises. These services have helped enterprises develop complex systems easily and deploy apps faster….
Gaming apps are complex systems. They combine multi-function systems, like the game engine, to other resources such as server containers, proxies and CDNs in order to…
Where Modern Observability and Financial Savvy Meet.