
ELK Stack: 5 Common ELK Issues and How to Fix Them
Running an ELK stack provides unrivaled benefits for your organization, however, ELK issues will inevitably crop up. ELK is scalable, and largely agnostic of internal infrastructure,…

Production logs can help ensure application security, reveal business insights and find and understand errors, crashes, and exceptions. But as useful as logs are, they’re difficult to manage and hard to keep track of. Making matters worse is that as log data volume grows, so does the difficult task of maintaining managing and monitoring logs. It’s for this reason that developers, DevOps engineers, and CTOs turn to log management tools.
In this post, we’ll outline and compare two popular open-source log management solutions: ELK and Graylog.
ELK is an acronym for 3 open-source projects – ElasticSearch, Logstash, and Kibana.
The stack was started after ElasticSearch, which was first released in 2010, joined forces with Logstash and Kibana. Since the critical component of proper log management is log aggregation, the two most important aspects of the ELK stack are Logstash and Kibana, for analysis purposes.
Generally, the ELK stack uses Filebeat, a solution to forward and centralize logs. After they’ve been forwarded, they get processed with Logstash and made into an ElasticSearch cluster. From that point, they start the visualization process using the Kibana component of the stack.

Usability:
Being an advanced suite of products, ELK has a fairly steep learning curve. Additionally, it is difficult to maintain. With that said, though, it allows you to do almost everything you need from a single tool. Once you get over the learning curve, it can be a great solution. Logs, metrics, and visualizations are good, and if you want additional functionality, you can search the wide ecosystem of available plugins.
Pricing:
The ELK stack is a free open-source solution but can get pretty costly for an organization. The total price varies greatly from company to company but depends on aspects like the amount of data that’s generated by your system(s), length of time you want to retain data for, and accessibility of your data. Even though it’s “free,” ELK stack has hidden costs that add up quickly.
Pros:
Cons:
Overall, ELK open source is a robust solution for log management once you get over its steep learning curve. It can be used as a stand-alone tool, or if you need more functionality, can be integrated with other applications.
Graylog depends on MongoDB and Elasticsearch to operate. It’s a powerful log management solution, but it is limited in functionality once you get outside the scope of what it does really well. This means that if you’re trying to do something out of its normal scope, it’ll become pretty difficult and time-consuming.
If you want to add to its functionality, you will likely have to add other tools like Grafana for intricate graphs, an InfluxDB or Graphite datastore or other custom scripts and programs. In terms of heavy parsing requirements, Graylog offers a powerful “all-or-nothing” sort of solution.
Usability:
Graylog has a pretty simple learning curve, which allows you to have an almost fully functional setup in a relatively small amount of time. Another feature that makes Graylog a pleasure to use is that all important items are easy to find in the GUI.
Pricing:
Graylog is an open-source tool, which means you can use it for free. There is also enterprise licensing available for $1,500 per graylog-server instance in your Graylog cluster.
Pros:
Cons:
Graylog is simple to set up and quick to learn. It offers useful features, but for anything else out of its scope, you will have to add other tools.
Both ELK stack and Graylog are extremely popular log management solutions, and both offer a similar set of basic features. Choosing the right solution depends on what’s important to you and on your organization’s needs.
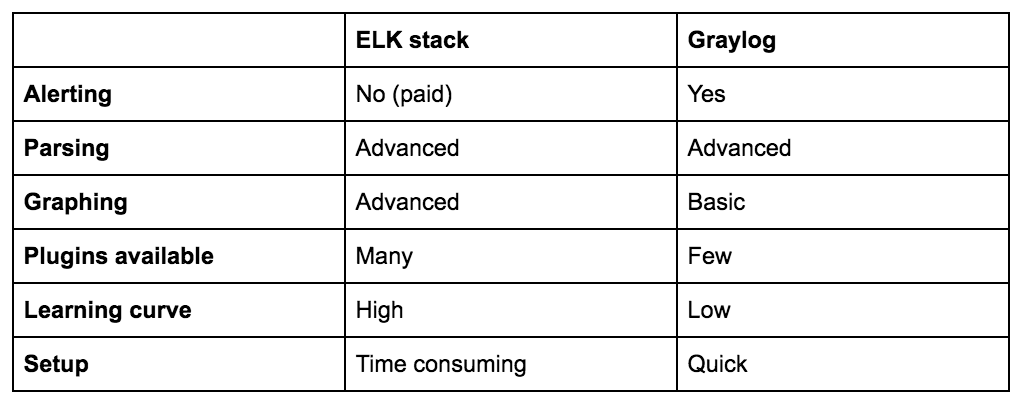
DevOps engineers and CTOs mostly care about speed, reliability, and flexibility in queries and visualizations. For this, the ELK stack is a better choice. Additional elements to consider are alerting, proactivity, livetail, automatic insights, and integration with their workflow (like the Coralogix tags feature). If alerting is important to you, Graylog is your best option. Graylog is also the better choice for security logs collection, while the ELK stack has can be a bit more difficult to implement for that matter.
Everyone has different specifications, which should guide your decision. Be sure to keep cost in mind, as well as maintenance requirements.
Looking for a log analytics solution that requires low maintenance? Want one that has real-time alerting, automatic anomaly detections and tons more?

Running an ELK stack provides unrivaled benefits for your organization, however, ELK issues will inevitably crop up. ELK is scalable, and largely agnostic of internal infrastructure,…

Surveys show that developers spend roughly 25% of their time troubleshooting issues, amounting to over one working day per week! Let’s examine the solutions that will…

When teams begin to analyze their logs, they almost immediately run into a problem and they’ll need some JSON logging tips to overcome them. Logs are…
