Centralized Log Management: Why It’s Essential for System Security in a Hybrid Workforce
Remote work increased due to Covid-19. Now heading into 2023, remote or hybrid workplaces are here to stay. Surveys show 62% of US workers report working…

It is tempting to consider log monitoring as a simple, solved problem. We write a log, check our file and, boom, we’ve cracked it. Yet those of us who have sat up at three in the morning, trawling through log files over an unreliable SSH connection, know that this is simply not enough. As your system scales, so too must the sophistication of your tooling. Your web application logging best practices must be scalable and ready to support your efforts.
Logging has been a staple of software engineering for decades, but what is logging? In its most basic form, it is the act of writing out an audit of what the application is currently doing. Open any simple log file and you’ll see little signatures of the application’s progress.
27-01-01T18:59:59.757Z - INFO: Received write requests from API

27-01-01T18:59:59.859Z - INFO: Converting into database format

27-01-01T19:00:00.001Z - DEBUG: Writing to the database
...
Each line in a log file is a footprint that your software leaves behind. More importantly, however, in times of crisis, the logs become clues, hidden around the crime scene, with you, the detective, looking desperately for the smoking gun. It is vital that these logs are in the best possible place. That they are flexible, queryable, clear, and reliable.
Many never venture further than the basic log file, but for those who do, there are findings, rewards and revelations that will completely change the way that you approach operations. Throughout this article, we’ll be taking a step-by-step journey, building logging capabilities layer by layer. With each step, the complexity of these logging best practices grows but so do the rewards. Let’s begin.
For those who do not want to dive into the details of each section of this article, here is a simple table that summarises each capability and the problems that it solves.
| Section | Capability | Problems Solved |
| Let There be Light | Simple, file based logging | Access to logs for application provides insight into what the application is doing in real time. |
| Centralize to Understand | Log centralization | Avoid jumping in and out of multiple servers when you have more than one running instance of your application. |
| Inject a little structure | Logs become Structured Events. | Consistency in logs makes it much easier to sift through and see what your logs are doing, as well as query on specific values. |
| Analyse what you have | Logging Graphs and Metrics | Visualising the logs in dashboards, graphs and counts means less time spent digging through actual log lines and provides a higher level view of the system. |
| Non-negotiable logging | Logging tools built into the applications and servers | Stop inconsistency between which apps are publishing logs and which aren’t. Ensure that every component of the platform behaves consistently. |
| Give your logs a voice | Alerts attached to logs | Alarms that are based on logs provide a powerful early warning system and shorten the time to recovery. |
| The Space Age of Logging | Machine learning analysis of logs | Fill in the gaps missed by your alerting rules, learn new and interesting patterns in your system. Categorise and optimise data for human consumption. |
You’re live. Your application is running merrily on your Linux server, probably hosted in an Amazon datacenter somewhere across the country. And then one day, it begins to falter. You haven’t set up any monitoring, and it takes a long time for someone to tease out the content of stdout to see the source of the error. When the smoke clears and the service is restored, it is at this point that your team makes a decision to write to a log file. It’s a good choice.
When you take advantage of a simple log library, such as SLF4J, you get access to a very common logging concept – Levels. Logging levels enable you to tune down the noise and focus only on those high level events, should you need to. Likewise, they enable you to open the floodgates and really see what is going on under the hood. Common loggins levels are:
Many teams opt for the simplest possible option when their application architecture is straight forward. When you have a single, easy to understand server, a log file might be sufficient, but this is only a temporary measure. And soon, the requirements of your business will increase the complexity of your system. At this point, the limitations of the text file emerge.
And then your boss needs you to scale
From a business perspective, this is excellent news. We’re growing and so is our customer base. For you, the engineer, the fun is just beginning. This is when the single file solution to logging really falls apart. Up until now, it has been trivial to jump onto the server and manipulate your log file to find the truth. Now? You’ve got multiple instances and that means multiple files. Without adequate monitoring, you won’t know which instance is failing you.
With three instances, you’ve got a 33% chance of picking the failing deployment. These kinds of dice rolls never spell success in an outage. If you’re going to straighten this problem out, it needs another component. There needs to be a single place where you can view your logs. Now, we are forced to really think about our logging best practices.
You’ve taken your first real step forward. Centralizing logs takes far more than a simple file configuration or framework on the classpath. It needs servers, time and, crucially, money. It’s an investment, one that will become a cornerstone of your operational procedure. The big decision you have now, is which tool to use?
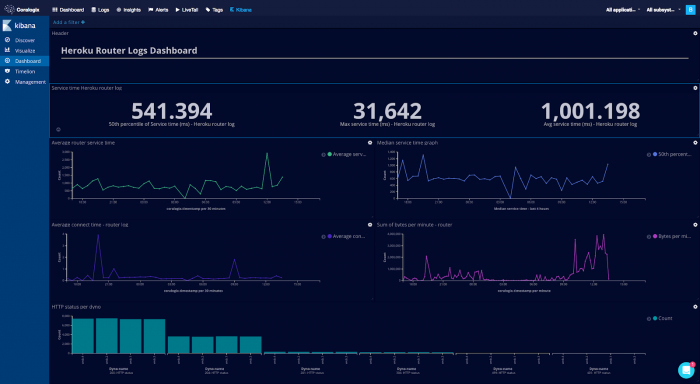
In log centralization (sometimes called Log Aggregation) there is a very popular open source player in town. It is comprised of three key tools. Elasticsearch, Logstash and Kibana. Together, they form the inveterate ELK stack. Most cloud providers offer managed solutions for these tools, for example, Amazon Elasticsearch will give you a managed instance of Elasticsearch with Kibana installed.
If you simply want to get your logs in one place, the ELK stack is a great option. It is easy to get running and, if you avoid the operational overhead with a managed service, it will typically work very well for you. There is a wealth of interesting transformational tools that can create a very powerful troubleshooting platform.
Progress is unending and, as engineers, it’s important that we position ourselves to be ready for that inevitable next step forward. The ELK stack will get your logs in one place, but it doesn’t unlock any further potential beyond that. It offers very little investment in the future and, when the time comes to be more sophisticated, we are forced to repeat the investment again and again.
Involving ourselves in a managed service from the off can save us headaches down the road. In the end, we want to rapidly troubleshoot issues with our software. We don’t want to be bogged down, understanding the intricacies of how to authenticate kibana on AWS. Instead, an off the shelf version provides agility and expertise with much less engineering time. This allows you to focus on your logging best practices, without being stuck in the detail of infrastructure or networking.
So all of your logs are in the same place. You’re able to search through them to find your application output and, without having to play SSH roulette, you are quickly getting to the bottom of the problems during an outage.
Your next stage is to move from logs to a newer concept – Structured Events. Structured events are a different take on logging. Instead of worrying about rich text explanations, you’re instead outputting events that have occurred. Take the example logs from the introduction.
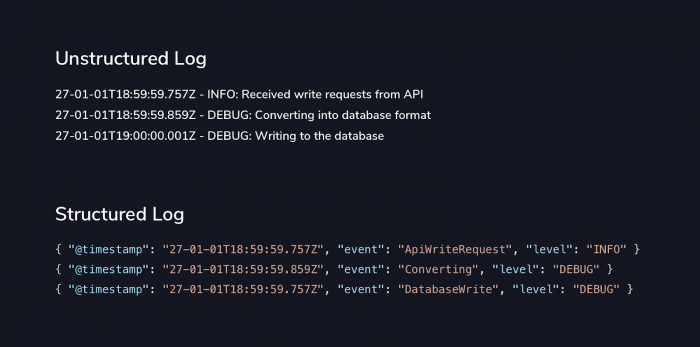
The first thing you’ve likely noticed here is that the logs don’t look like logs any more. Someone with database experience might be fooled into thinking that these are documents in a NoSQL database. This might seem like a straightforward change but once you cross this hurdle, you’re beginning to unlock some of the truly amazing capabilities that your logging solution has to offer.
For example, without properly separating the fields, how would you tell your log centralization tool to only show you the INFO level logs? What if you only wanted ERROR? Without a structured format for your logs, this is a tricky and often brittle query. Any good data miner will tell you, the trick is to clean the data first. That’s exactly what you’re doing here – cleaning up your logs to give yourself the best possible chance of understanding your system quickly. This is a logging best practice that will underpin much of your future success. Structure breeds structures.
There are tools, such as MDC, that will automagically place desired values onto each and every one of your logs. This solves a really simple problem that rapidly descends into a nightmare for the code. Let’s consider the following code block in Java:
logger.debug("DatabaseWrite", value("id", row.getId()));
If we were logging in JSON, it would appear like this:
{ "@timestamp": "27-01-01T18:59:59.757Z", "event": "DatabaseWrite", "level": "DEBUG", "id": "1234" }
Now, if you wanted to ensure that your object with ID 1234 was written to the database, you can simply look for id: 1234. However, what if the log isn’t there? Well, if it isn’t there, one can assume that the database hasn’t written your object, but why? Well, you don’t have anything bringing events together and without that, you’re going to struggle.
In the effort to ensure the correct values are present on all of your logs, you may find yourself forced to pass values all over your code, simply to ensure that they appear in the logs. This problem quickly spirals out of control.
public void writeToDatabase(String id, String userName, String trackingHeader, String transactionId) {
    // userName, trackingHeader and transactionId have nothing to do with this function, they exist only to be logged.
    database.write(id);

    // All this noise in a function that only wants to write to the database

    logger.debug("DatabaseWrite",
      value("id", row.getId()),
      value("user", userName),
      value("trackingHeader", trackingHeader),
      value("transactionId", transactionId)
      // What does the transaction ID, tracking header or user have to do with this DB read and write?
    );
}
Most of those values are not needed for your logic, but they are forced into your method anyway. Noisy code provides the perfect surface area for bugs. Maintainability becomes more difficult and as more and more values are attached to your growing set of logs, your problems will only grow. This is where context scoped variables come into their own. For example:
import org.apache.log4j.MDC;

public void handleDbWrite(String id, HttpRequest request) {
    MDC.put("user", request.getUsername());
    MDC.put("trackingHeader", request.getTrackingHeader());
    MDC.put("transaction", request.getTransactionId());

    String id = transformInput(request.getObject());

    writeToDatabase(id);
}
Now, you don’t need to pass the values around everywhere – they simply crop up. This allows you to keep your code clean but your logs useful and verbose.
public void writeToDatabase(String id) {
    // Now, your function is only concerned with what it wants, nothing more.

    database.write(id);

    logger.debug("DatabaseWrite",
      value("id", row.getId())
    );
}
It also means that any logs you don’t have control over, for example errors that you didn’t catch, will still have your values on them. When you query for ID 1234, you get everything. But being able to view the raw logs is only the first step. You have invested in this logging best practice – now you can reap the rewards.
Logs are simply data. Even more so when you’ve shaped them into structured events. So it should come as no surprise that you can represent your data in a multitude of different ways. You can sum the values of fields, graph the count of logs, take averages and standard deviations and much more.
It is at this point that logging occupies a whole new space in your operational function. You’re not simply dashing to the logs when there is a problem. You’re using the logs as a measure of normality. This brings logs to a much earlier point in your monitoring and they can form a brilliant early warning system. It is common practice to render these graphs on TVs hanging in the office, in conjunction with metric driven graphs, to provide insight into the behaviour of your software. This capability is intrinsically linked with a continuous delivery approach to software development. You simply can’t deploy regularly and take sensible risks without the rapid feedback that this type of monitoring offers you.
Some monitoring platforms are far more sophisticated than others. Grafana is a more powerful alternative to Kibana’s graphing solution for metrics, but it requires separate hosting. You put in a little more effort and you reap the benefits of more powerful graphs and monitoring. The next step after this is to involve yourself into an entire ecosystem, like Coralogix.
This is another key decision point for your journey, because after this, the difficulty level takes a sharp incline. As an organisation, you must constantly be asking yourself whether you’re focusing on the value. Every moment spent working around the problem, rather than on the problem, is potential waste. Removing this waste is key to levelling up your logging best practices.
When logging shifts earlier into your monitoring process, you begin to see how powerful it is. It is natural to rely on this new capability regularly and, of course, struggle to proceed without it. When you start measuring your failure metrics, it will become more and more important that these logs are in place.
Applications, or whole servers, without these logs fall into a monitoring black spot and the consistency of your performance suffers. If you’re feeling a sense of dread about this prospect, it is entirely natural. And there are plenty of things you can do to overcome it.
Shared functionality is commonly pulled out into our own libraries. For example, if you have a set of business logic, such as mathematical conversions or API clients, you might move those out into a library so lots of applications can make use of them. This does come with its own complexity but it is often a worthwhile pursuit.
Logging libraries are exactly what you might imagine. They are tools that bring everything you need into your application. They ensure that logs are in the correct structure and they make sure that the correct values are available in them. This provides consistency in format and data, meaning that your applications avoid the natural drift that comes from constantly reinventing the wheel.
The cost here is in your engineering effort. You need to remember to bring that logging library into your application, over and over. If you’re running microservices, that can mean hundreds of new services. Not to mention all of the applications that you’ll need to patch. This presents a high upfront cost in ensuring compliance, and enforcing logging best practices can become a complex task. You need some automation.
Sooner or later, application level libraries aren’t going to cut it for you. If you have a serverless architecture, this might not apply, but most don’t. There is some kind of mechanism, be it AWS, GCP or a private cloud, by which you spin up new servers. This is the forge where consistency is crafted. Rather than hoping that everyone follows your logging best practices, you can bake it into your software.
There are lots of tools that can run on the server. For example, Filebeat. It can be a little bewildering, deciding which open source tool to use. Many of them do not come with any decent level of support either, so when you’re facing issues, you’re often on your own. Many paid for services also support open source tools as integrations into their platform. Coralogix integrates with a vast collection of open source tools, from Jenkins to Fluent-Bit to raw HTTP calls.
By bringing these agents into your server image, you’re ensuring that if it runs on a server, the logs are going to be centralized. By using logging libraries, you’re able to guarantee that they’ll be consistent and reliable. The combination of the two creates unprecedented certainty in the reliability of your logs. Which gives you a great idea for your next logging best practice.
This new bedrock of consistency in your logs gives you confidence that, if an issue is occurring, the logs will represent it. As such, it is natural and wise to begin to hook alerting into this data. Many open source tools offer alerting and, likewise, many paid-for providers offer comparable (and in some ways, superior) functionality.
Alerts can be based on anything, from the presence of a certain number of logs, to a threshold that a certain log value mustn’t pass. These kinds of alerts can also be configured as an early warning system. If you see a sudden spike in error logs, that can be an early flag for your supporting engineers. The logs are often the first place that an error will present itself and attaching alerts creates an incredibly powerful option for you. Alerting from your logs is one of those crucial logging best practices to grasp, allowing you to take full advantage of the data you have available.
At the beginning of this journey, logging was simply an audit trail in a log file. Logging best practices weren’t even considered. You would SSH into one of a handful of servers and hope for the best. Now, you’re altering key server provisioning processes to ensure that your structured events always make it into your log centralization solution. This is a huge leap forward.
You’ve got graphs, displaying the normal state of your system and counts displaying key business metrics, accompanied with a chorus of other measurements that provide unprecedented insight into your operational performance. All of this began with writing to a simple log file, but it has taken you to a new level of operational excellence. There is, however, one further leap forward. One way to take your logging best practices to the next level.
The capabilities we’re about to discuss are at the cutting edge of logging. Most organisations never even think about implementing them. Once logs are in one place, analysed and rendered, we tend to consider that a job well done and move on. This is a false summit.
With the advent of machine learning, the algorithms we can write (or more appropriately, learn) can take on whole new levels of sophistication. It is one thing to put business rules in place and tie alerts to them. They will capture our approximation of what’s going on. In many cases, this is sufficient, except in that one unforeseen case where it isn’t. We’re reaching a point where we need our logging best practices to tell us what to look for.
The problem with traditional alerting is simple – who watches the watchmen? How do we know that our alerts are properly configured and that our rules cover our error cases? We could pick any engineer with more than a few years of experience and they’ll have dozens of errors that slipped past their alarms. Alarms in the classical sense need to be iterated, constantly, in order to stay relevant.
Machine learning techniques can be applied to the analysis of logs to detect anomalies. This is akin to having a person, all the time, combing through the millions of lines of logs that your system generates, and finding quirks, oddities and concerns. What is essential to understand here is that this technique learns about your system. It doesn’t depend on the perfection of the rules you invent, it creates its own rules. When you combine this, with some traditional alerting, the types of errors that you can catch grow exponentially.
Logs can also be run through intrusion detection systems that utilise the same techniques, spotting potential security issues that no one has ever seen before. By taking advantage of a system that is capable of categorising your data in this way, you’re optimising the effort of your colleagues. You are no longer trawling through endless reams of logs to find one single unexpected HTTP packet. Software can do that for you.
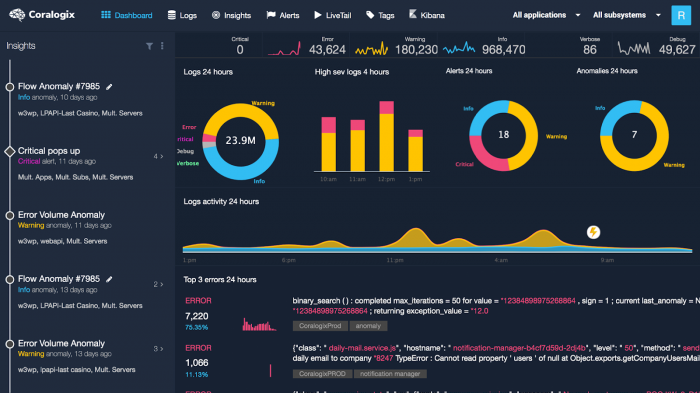
A fascinating skill of machine learning is the classification of data. Given huge volumes of information and some training, a properly configured model will neatly sort your content into accessible, summarised bundles. These bundles are so much clearer than the endless streams of logs you’ll need to sift through.
Rapidly accessing information like this not only gives you a more complete view of your data, but it gives you an outstanding top down view of the behaviour of your system.
If you are an organisation with a strong background in machine learning, and plenty of time to invest in something like this, it might be possible to build your own platform. For the vast majority of companies out there, these kinds of capabilities are going to come from a 3rd party. If you’re determined to avoid the use of 3rd party providers for these kinds of features, then the only other option is a huge upfront effort (in some cases, years) and the opportunity cost associated with choosing a log platform over solving the problems for your own industry.
For those that have made the investment early, this is, again, some more configuration. A few clicks and the capability will begin to take shape. The earlier in the chain that this investment was made, the more value you will reap from it. Throughout this article, we’ve seen several points where your organisation has been faced with either huge upfront effort or collaboration with a 3rd party. The theme is consistent and only grows more extreme, as your appetite for operational resilience becomes more sophisticated.
At the beginning of our journey, we began with SSH roulette, dancing in and out of servers to find the failing instance, hoping that our flaky connection would hold out long enough for us to get that grep command just right. At the end of our journey, we were discussing tooling that sounds like it could have come from a science fiction novel, with machine learning algorithms detecting anomalies in your data and automatically warning you.
Logging is no longer an application afterthought, or a capability we bring in after a giant outage. It is at the bedrock of how we run and analyse our software. Organisations are upgrading their logging infrastructure in droves to keep up with the competition.
Whichever way you decide to turn, paid for or completely self-hosted, an investment in your logging is going to transform the way your applications are supported and make the diagnosis of even the most complex issues, straight-forward.
The only choice left to you is this: do you solve the problem that’s in front of you, right now, or do you make the strategic choice and take your organisation on a journey that will redefine how it builds software.

Remote work increased due to Covid-19. Now heading into 2023, remote or hybrid workplaces are here to stay. Surveys show 62% of US workers report working…

Security is a top-of-mind topic for software companies, especially those that have experienced security breaches. This article will discuss how to set up Elasticsearch audit logging…

When teams begin to analyze their logs, they almost immediately run into a problem and they’ll need some JSON logging tips to overcome them. Logs are…
