Monitoring Jenkins: Essential Jenkins Logs to Watch Out For
Jason Smyth
October 12, 2020
Share article
Monitoring Jenkins is a serious challenge. Continuous auditing and logging are often overlooked, but it provides a wealth of information about the health of your Jenkins instance. The following are some approaches to generating informative logging to these issues, that can help to monitor and provide suitable explanations of where the problems lie; even identifying what the possible solutions are.
RAM usage on your Jenkins Instance
When Jenkins is running or has run out of RAM, it normally has a few root causes:
growth in data size requiring a bigger heap space
a memory leak
The operating system kernel running out of virtual memory
multiple threads need the same locks but obtain them in a different order
To identify the root cause of memory leaks, it normally requires access to one of three log sources. Those being the garbage collection logs, a heap dump, or a thread dump. These three sources are hugely important when monitoring Jenkins.
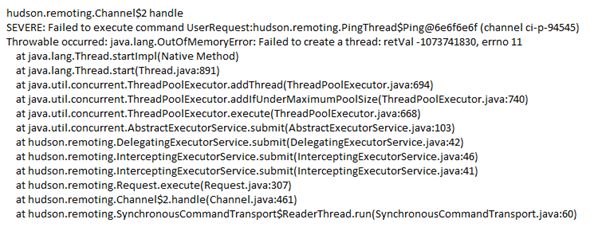
To demonstrate an OOM (OutofMemory) issue, a snippet from stdout log shows a Jenkins instance on a Master node, throwing such an error. Usually, when you see an OutOfMemory error and it references threads, this is commonly a native (system) out of memory because each additional thread that the JVM (Java Virtual Machine) spawns uses native memory (as opposed to Java Heap memory). The advice, in this case, would be to lower the Java heap size – since a large Java heap is crowding out the address space that needs to be used for keeping track of new threads
When Jenkins does perform a rebuild though, it will keep the jobs and build data on the filesystem and load the new format to the memory. This can also lead to high memory consumption and result in slow UI responsiveness and OOM errors. To avoid such cases as the one demonstrated, it is best to open the old data management page (located at your-jenkins-url/administrativeMonitor/OldData/manage), verify that the data is not needed, and clear it.
A key tip to managing the RAM or heap usage is to define the right heap size or ensure it is throttled. When defining the heap size, there is a very important JVM feature you should consider implementing on the JVM for Jenkins. This feature is called UseCompressedOops, and it works on 64 bit platforms, which are now most often used. What it does, is to shrink the object’s pointer from 64bit to 32bit, thus saving a lot of memory. Enabling the configuration of Memory usage thresholds (throttle usage), can enable job builds to fail or be unstable, but notify users if memory usage goes beyond the maximum available.
You need to constantly check and analyze Jenkins performance by implementing configurations for:
Monitoring memory usage. This checking and monitoring RAM memory usage continuously for Jenkins master / slave node
Checking java memory leak
Adding correct java option arguments/parameters which are suggested by Jenkins official documents
Monitoring with the correct plugin. The monitoring plugin will help you to monitor running setup with live scaled data. This will involve, install the monitoring plugin and monitor Jenkins memory usage
With the plugin, add monitoring alerts for deadlock, threads, memory, and active sessions. You can add monitoring alerts to capture threshold baseline details and present it in tooling such as the ELK ‘stack’ – ElasticSearch, LogStash, Kibana, to perform a search, analysis, and visualization operations in real-time
Jenkins doesn’t normally need a lot of processing power to work, but memory and storage performance issues can make the CPU load spike exponentially. When Jenkins is performing tasks, CPU usage will rise and/or spike temporarily. Once the CPU intensive process completes, the CPU usage should drop down to a lower level. When you’re monitoring Jenkins, the CPU usage is of paramount importance.
However, if you are receiving high CPU alerts or are experiencing application performance degradation, this may be due to a Jenkins process being stuck in an infinite loop (normally deadlock threads), repeated full Garbage collections, or that the application has encountered an unexpected error. If the JVM for Jenkins is using close to 100% of the CPU consumption, it will constantly have to free up processing power for different processes, which will slow it down and may render the application unreachable. When you’re monitoring Jenkins, you need to be able to catch these issues quickly.
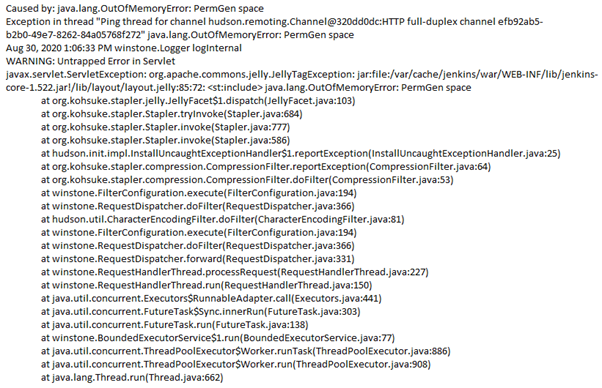
To demonstrate high CPU usage, a snippet from stdout log, indicates high usage with a deadlock when queueing up jobs from a Jenkins Master instance. Causing the issue is the OutOfMemoryError: PermGen space error. PermGen is one of the primary Java memory regions and has a limited amount of memory without customization. Application of the JVM parameters -Xmx and -XX:MaxPermSize will help rectify this problem. If you do not explicitly set the sizes, platform-specific defaults will be used, this potential issue can occur.
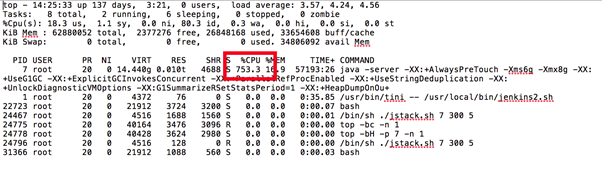
In order to reduce the CPU usage, you do need to determine what processes are taxing your CPU. The best way of diagnosing this is by executing the jenkinshangWithJstack.sh script while the CPU usage is high, as it will deliver the outputs of top and top -H while the issue is occurring, so you can see which threads are consuming the most CPU.
The following heap stack example shows that the Jenkins UI has become unresponsive, after running the jenkinshangWithJstack.sh script to gather data. In the output it shows the JVM is consuming a high amount of CPU:
Excessive CPU usage can be reduced or tempered by the following actions:
Minimizing the number of builds on the master node. This meaning you want to make the Jenkins master as “free” from work as you can, leaving the CPU and memory to be used for scheduling and triggering builds on slaves only
Looking at the garbage collection logs to see if there’s a memory leak
From repeated build processes, not keeping too much of the build history. Trying to limit it
Making sure your Jenkins & installed plugins version, are installed with the most up to date stable releases
Constantly monitor CPU performance, by checking and monitoring the CPU usage for Jenkins slaves the master node. Resulting outputs can be analyzed in the ELK stack
The garbage collector is an automatic memory management process.
Its main goal is to identify unused objects in the heap and release the memory that they hold. Some of the GC actions can cause the Jenkins program to pause. This will mostly happen when it has a large heap (normally 4GB). In those cases, GC tuning is required to shorten the pause time. If Jenkins is processing a large heap but requires low pause times, then you should consider as a starting point, the use of the G1GC collector. It will help manage its memory usage more efficiently.
A typical case example is when the java.lang.OutOfMemoryError: GC overhead limit exceeded error happens within a Jenkins instance. This is the JVM’s way of signaling that Jenkins is spending too much time doing garbage collection with too little result. By default the JVM is configured to throw this error if it spends more than 98% of the total time doing GC and when after the GC only less than 2% of the heap is recovered. The Garbage collector is always running behind the scenes, and when you’re monitoring Jenkins, you need to make sure it is running efficiently.
So when trying to build jobs in Jenkins from the Master node, and the build log (or stdout file) presents this repeated output…
Exception in thread "main" Java.lang.OutOfMemoryError: GC overhead limit exceeded.
…it is suggesting to clear any old builds which have been deployed way back in time (weeks or possibly months) and to consider increasing the build counter in Jenkins.
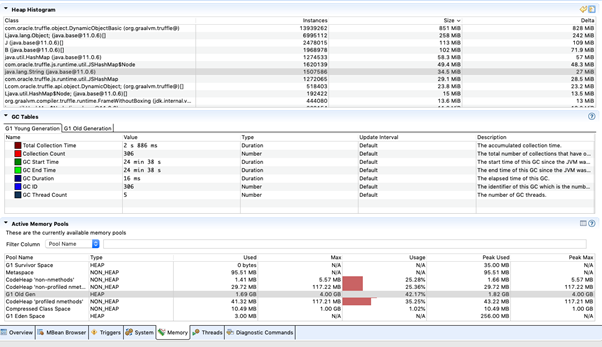
Through the use of a heap histogram as demonstrated, this can identify where the GC shows a large heap area (of 4GB) and its current usage from the Jenkins instance.
To manage the Garbage Collector more effectively and allow it to compact the heap on-the-go, it is suggested to apply the following configurations.
Enable GC logging
Enable G1GC – this is the most modern GC implementation (depending on JDK version)
Monitor GC behavior with plugins, services or toolings
Tune GC with additional flags as needed
Utilise the ELK stack to analyze the logging source
Keep monitoring and attach any key metric alerting to the logging process
This will involve tuning the garbage collection and setting arguments on the JVM for Jenkins.
Resulting in a more detailed, explanatory and transparent approach to log management and the monitoring of the garbage collector. Key is to parse effective logging, through primarily CUI/GUI GC monitoring tools, so as to provide better visualization of the issue and to identify and isolate, where any slow unresponsive behaviour Jenkins is showing.
Pipeline Build Failures
It is pretty common when starting with Jenkins to have a single server which runs the master and all builds, however Jenkins architecture is fundamentally ‘Master and Agent (slave)’. The master is designed to do coordination and provide the GUI and API endpoints, and the agents are designed to perform the work. The reason being that workloads are often best ‘farmed out’ to distributed servers.
When Jenkins is used in cloud environments, it has many integrations with agents, plugins and extensions, to support those various environmental elements. This may involve Virtual Machines, Docker Containers, Kubernetes, AWS (EC2), Azure, Google Cloud, VMWare and other external components. Where problems can arise in those build jobs, is if you use Jenkins as just a master instance, and finding that you start to run out of resources such as memory, CPU, etc. At that point you need to consider either upgrading your master or setting up agents to pick up the load. You might also need to factor having several different environments to test your builds.
When Jenkins Jenkins spins up an agent, you are likely dealing with a plugin that manages that agent. The fact that you need plugins in Jenkins to do just about anything can be problematic — and not only because it means software delivery teams have to spend time installing and configuring them before they can start working. A bigger issue will come into play here, in that most of Jenkins’ plugins are written by third parties, vary in quality, and may lose support without notice.
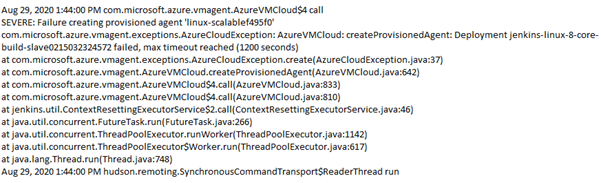
If the plugin version is out of sync, such as one to create Jenkins agents in Azure Virtual Machines, then the following error can occur is displayed in a stdout or build log:
This provisioning agent error shown, was specific to a bug not identified before release and applied outside of a repository used for approved build dependencies.
To ensure you follow some best practice for you build pipeline:
Avoid where possible, running jobs on the Master. User a master/slave (node) configuration. Ideally each jobs should run on slave and make sure you are executing jobs on slave to have minimum load on master node
Add correct cleanup configuration to delete old jobs from the master node
Add the correct memory configurations and limits for the Jenkins deployment
Use a central, shared and supported repository for build dependencies, so ensuring a cleaner, more reliable and safer build job workspace
Install only supported plugins and avoid those that have memory leak issues. Make sure you are installing correct plugins that you can test on a staging (testing) server first, before consideration of installing them in production
Avoid installing unwanted plugins, and checking before installing them, that they are security compliant and do not having security vulnerabilities
Export build logs to the ELK stack. In case of a large amount of running jobs, it can become difficult to keep track of all the activity. So collecting all this data and shipping it into the ELK Stack, can help to give you more visibility and identify any issues
Jenkins is a tool that needs to interface with a myriad of systems and applications throughout DevOps environments. It needs unabridged access to code and artifacts, and to accomplish its role as the ‘steward,’ Jenkins must have access to a considerable breadth of credentials – or secrets – from usernames and passwords to source control and artifact deployment. When monitoring Jenkins, it’s tempting to only think about operational issues, but security issues come up regularly.
All too often, users who use Jenkins do have a propensity to treat security as secondary. The business risk of not securing your Jenkins servers is high. You need to ensure that user authentication is established and enforce access control policies to your Jenkins servers. Due to the centrality of its role, a breach of your Jenkins servers can end up exposing access credentials to your most valuable resources. Key to securing Jenkins, is ensuring there is an elimination of weaknesses related to misconfigured environments and poorly constructed security controls. This mainly related to authentication and authorization policies.
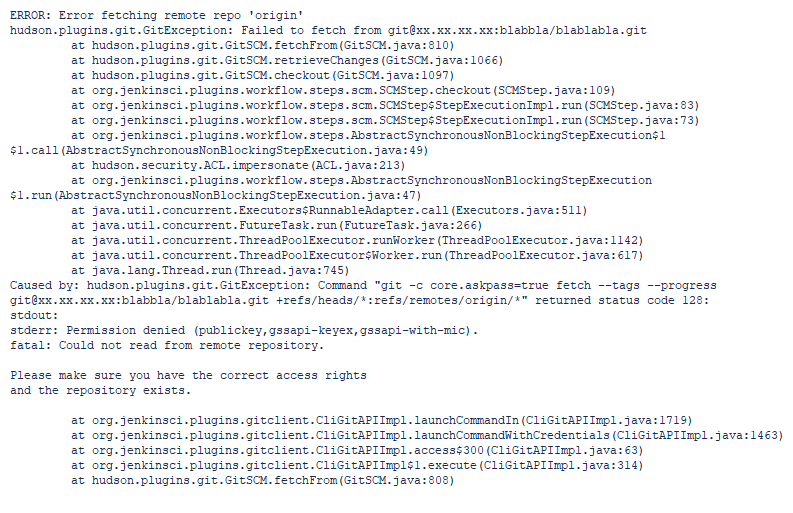
Understanding how to apply security controls can be seen in this log output, when encountering a problem trying to launch a pipeline Job with access to a Git repository.
The permission denied error meant there was something wrong with the credential(s) in the job definition, provided by Jenkins to access the Git server. It was corrected with an ‘id_rsa’ credential (permission).
To ensure you follow some best practice for securing your Jenkins instance and jobs:
Enable Jenkins’ security. Jenkins global security is the first line of defense in protecting the asset it controls. Core Jenkins supports four security realms: delegate to servlet container, Jenkins’s own user database, LDAP, and Unix user/group database
Consider the use of the Jenkins credentials plugin, that can provide a default internal credentials store. This can be used to store high value or privileged credentials, such as GitHub tokens
Configuring access control in Jenkins using a Security Realm and Authorization configuration. A Security Realm, informs the Jenkins environment, how and where to pull user (or identity) information from. Authorization configuration which informs the Jenkins environment as to which users and/or groups can access which aspects of Jenkins
Jenkins can provide various ways of keeping track of an instance, with two main categories of logs represented: system logs and build logs. Jenkins will provide some pretty useful in-console capabilities, for keeping track of your builds using these logs. As Jenkins takes constant effort to monitor, getting the context right in the form of the most informative logging, is critical to managing the most common and valid issues.
CI/CD pipelines have become a cornerstone of agile development, streamlining the software development life cycle. They allow for frequent code integration, fast testing and deployment. Having…
Continuous Integration/Continuous Delivery (CI/CD) has now become the de-facto standard for all engineering teams seeking to keep pace with the demands of the modern economy. At…
Continuous integration (CI) and continuous delivery or deployment (CD) cover the process of automatically merging, building, and testing code changes ready for release, and – in…
Where Modern Observability and Financial Savvy Meet.