Thousands of Insights at a Glance With Coralogix Alert Map
An effective alerting strategy is the difference between reacting to an outage and stopping it before it starts. That’s why at Coralogix, we’re constantly releasing new…

10 years ago, Google was facing a critical bottleneck caused by extremely prolonged C++ compilation times and needed a totally new way to solve it. Google engineers tackled the challenge by creating a new language called Go (aka Golang). The new language of Go borrows the best parts of C++, (most notably it’s performance and security features) and combines it with the speed of Python to enable Go to quickly use multiple cores while being able to implement concurrency.
Here, at Coralogix, we’re parsing our clients’ logs in order to give them real-time insights, alerts, and meta-data on their logs. In order to do that, the parsing phase, which is very complex and loaded with tons of rules for each log line service, must be extremely quick. That’s one of the reasons we decided to use Go lang.
The new service is now running full-time in production and while we’re seeing great results, it needs to run on high-performance machines. Over tens of billions of logs are parsed every day by this Go service that runs on an AWS m4.2xlarge instance with 8 CPUs and 36 GB of Memory.
At this stage, we could have called it a day feeling great that all was running well, but that’s not how we roll here at Coralogix. We wanted more features (performance, etc) using less (AWS instances). In order to improve, we first needed to understand the nature of our bottlenecks and how we can reduce or eliminate them completely.
We decided to run some Golang profiling on our service and check what exactly caused high CPU consumption to see if we can optimize.
First, we have upgraded to the latest stable Go version (a key part of the software lifecycle). We were on Go version v1.12.4, and the latest was 1.13.8. The 1.13 release, according to the documentation had major improvements in the runtime library and a few other components which mainly utilized memory usage. Bottom line, working with the latest stable version was helpful and saved us quite some work →
Thus, memory consumption improved from about ~800MB to ~180MB.
Second, in order get a better understanding of our process and understand where we’re spending time and resources, we started to profile.
Profiling different services and programming languages may seem complex and intimidating, but it’s actually pretty easy in Go and can be described in few commands. Go has a dedicated tool called ‘pprof’ that should be enabled in your app by listening to a route (default port— 6060) and use the Go package for managing http connections:
import _ "net/http/pprof"
Then initialize the following in your main function or under your route package:
go func() {
	log.Println(http.ListenAndServe("localhost:6060", nil))
}()
Now you can start your service and connect to
http://localhost:6060/debug/pprof
Full documentation by Go can be found here.
The default profiling for pprof will be a 30 seconds sampling of CPU usage. There are a few different paths that enable sampling for CPU usage, heap usage and more.
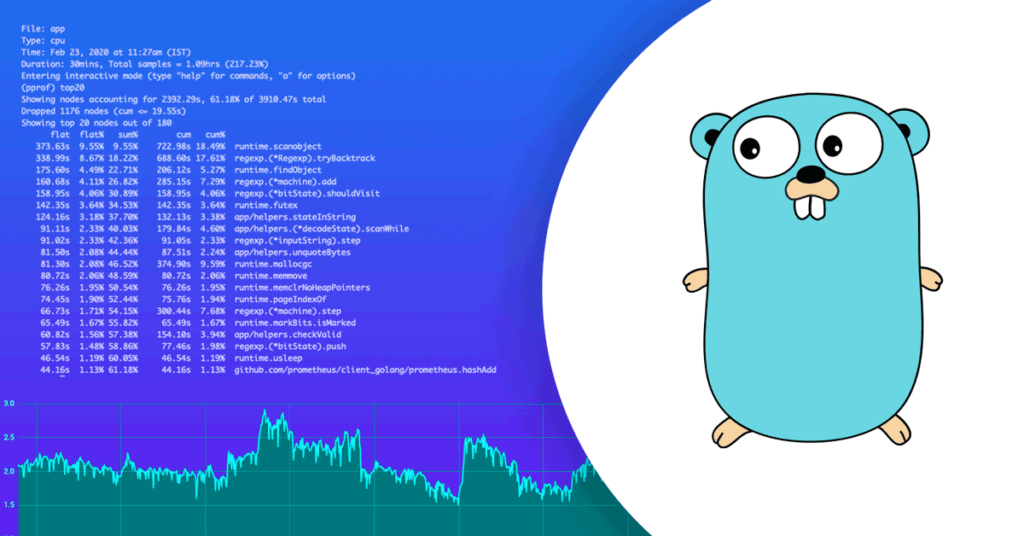
We focused on our CPU usage, so we took a 30 sec profiling in production and discovered what you see in the image below (reminder: this is after upgrading our Go version and decreasing the internal parts of Go to the minimum):

As you can see, we found lots of runtime package activity, which indicated specifically GC activity → Almost 29% of our CPU (just the top 20 most consumed objects) is used by GC. Since Go GC is quite fast and pretty optimized, the best practice is to not change or modify it and since our memory consumption was very low (compared to our previous Go version) the main suspect was a high object allocation rate.
If that’s the case, there are two things that we can do:
Looking at our instance type, it was clear that we had a lot of memory to spare and we are currently bound by the machine CPU. So we just switched that ratio. Golang, since its early days, has a flag which most developers are not aware of, called GOGC. This flag, with a default of 100, simply tells the system when to trigger GC. The default will trigger the GC process whenever the heap reaches 100% of its initial size. Changing that value to a higher number will delay the GC trigger and lowering it will trigger GC sooner. We started benchmarking a few different values and the best performance for our purpose was achieved when using: GOGC=2000.
This immediately increased our memory usage from ~200MB to ~2.7GB (That’s after memory consumption decreased due our Go version update) and decreased our CPU usage by ~10%.
The following screenshot demonstrates the benchmark results:

The top 4 CPU consuming functions are our service’s functions, which makes sense. Total GC usage is now ~13%, less than half of its previous consumption(!)
We could have stopped there, but decided to uncover where and why we allocate so many objects. Many times, there’s a good reason for that (for example in case of stream processing where we create lots of new objects for each message we get and need to get rid of it because it’s irrelevant for the next message), but there are cases in which there’s an easy way to optimize and dramatically decreasing object creation.
To start off, let’s run the same command as before with one small change to take the heap dump:
http://localhost:6060/debug/pprof/heap
In order to query the result file you can run the following command within your code folder in order to analyze the dump:
go tool pprof -alloc_objects <HEAP.PROFILE.FILE>
our snapshot looked like this:

All seemed reasonable except for the third row, which is a monitoring function reporting to our prometheus exporter at the end of each Coralogix rule parsing phase. In order to get deeper, we ran the following command:
list <FunctionName>
For example:
list reportRuleExecution
And then we got the following:

The 2 calls to WithLabelValues are Prometheus calls for metrics (we left it for Product to decide whether they really need it or not). Also, we saw that the first row is creating a huge amount of objects (10% of the total objects allocated by that function). We took a deeper look and saw it was a conversion from int to string for the customer ID we attached to the reported metric, which is important, but considering the fact that there’s a limited amount of customers in our DB, we shouldn’t adapt to Prometheus’ way of receiving variables as strings. So instead of creating a new string each time and at the end of the function throw it away (wasted allocation and more work for the GC) we defined a map at the initialization of the object, including mapping for all numbers between 1 to 100K and performed a “get” action from that map in that function.
A new profiling session was ran now to verify our thesis and proved that it was correct (you can see that this part doesn’t allocate objects anymore):

This wasn’t a dramatic improvement, but overall that saves us another GC activity and to be more specific — about 1% CPU.
The final status is in the snapshot attached:

1) Memory usage: ~1.3GB → 2.7GB
2) CPU usage: ~2.55 avg and ~5.05 at peaks → ~2.13 avg and ~2.9 at peaks.


Overall, we see that the major improvement was at peak times when our log processing per second increases. This means that now our infrastructure doesn’t have to be tuned for outliers but is much more stable.
By profiling our parser Go service we were able to pinpoint the problematic areas, understand our service better, and decide where, if at all, to invest our time in order to improve. A majority of profiling jobs end up in basic tuning of flags or configurations resulting in a better fit to your use case and ultimately better performance.

An effective alerting strategy is the difference between reacting to an outage and stopping it before it starts. That’s why at Coralogix, we’re constantly releasing new…

If you’re just getting familiar with full-stack observability and Coralogix and you want to send us your metrics and traces using the new OpenTelemetry Community Demo Application,…

In the world of data observability, there are several distinct problems to solve. Fast queries, intuitive visualizations, scalable storage, and more. The technical problems receive the…
