In the context of monitoring logging, multiline logs happen when a single log is written as multiple lines in the log file. This can either be caused by not using a standard logger to write with (e.g. print to console) or there’s a \n (Newline) in the log to make it more readable (e.g. Java stack traces are error logs formatted as a list of stack frames)
When logs are sent to 3rd party full-stack observability platforms like Coralogix using standard shipping methods (e.g. Fluentd, Filebeat), which read log files line-by-line, every new line creates a new log entry, making these logs unreadable for the user. But, have no fear, there are many shipping methods that support pre-formatting multiline logs so that you are able to restructure, format, and combine the lines into single log messages.
Multiline Log Example
Here’s how a multiline log looks, using a Java stack trace log for this example:
09-24 16:09:07.042: ERROR System.out(4844): java.lang.NullPointerException
     at com.temp.ttscancel.MainActivity.onCreate(MainActivity.java:43)
     at android.app.Activity.performCreate(Activity.java:5248)
     at android.app.Instrumentation.callActivityOnCreate(Instrumentation.java:1110)
     at android.app.ActivityThread.performLaunchActivity(ActivityThread.java:2162)
     at android.app.ActivityThread.handleLaunchActivity(ActivityThread.java:2257)
     at android.app.ActivityThread.access$800(ActivityThread.java:139)
     at android.app.ActivityThread$H.handleMessage(ActivityThread.java:1210)
When sending this log using a log shipper, each line will be considered as an independent log message since log files are read line by line (assuming new entry when encountering \n) unless a multiline pattern was set in your configuration file.
Configurations with Multiline
Multiline is a configuration option, which should be configured by the user. As mentioned before, most shipping methods support adding multiline pattern options. We will review a few of the most common file shipper configurations and see how to configure multiline to work with them.
Logstash
Being part of the Elastic ELK stack, Logstash is a data processing pipeline that dynamically ingests, transforms, and ships your data regardless of format or complexity. Here is an example of how to implement multiline with Logstash.
The negate can be true or false (defaults to false). If true, a message not matching the pattern will constitute a match of the multiline filter and the what will be applied.
The what can be previous or Next. If the pattern matched, does the event belong to the next or previous event?
For more information on multiline using Logstash visit here.
Filebeat
Also developed by Elastic, Filebeat is a lightweight shipper for forwarding and centralizing logs and files. You can either forward data to your local Logstash and from there to Coralogix, or. you ship directly to our Logstash endpoint.
Within the filebeat.inputs under type–>log use:
 multiline:
   pattern: '^[0-9]{1,3}\.[0-9]{1,3}\.[0-9]{1,3}\.[0-9]{1,3}'
   negate: true
   match: after
The negate can be true or false (defaults to false). If true, a message not matching the pattern will constitute a match of the multiline filter and the what will be applied.
The match can be after or before. If the pattern matched, does the event belong to the next or previous event? (The after setting is equivalent to previous in Logstash, and before is equivalent to next)
For more info on working with multiline in Filebeat, visit here.
FluentD
Fluentd is a data collector which lets you unify the data collection and consumption for better use and understanding of data.
The format_firstline specifies the regexp pattern for the start line of multiple lines. Input plugin can skip the logs until format_firstline is matched.
The formatN, N’s range is 1..20, is the list of Regexp formats for the multiline log. For readability, you can separate Regexp patterns into multiple regexpN parameters. These patterns are joined and constructs regexp pattern with multiline mode.
Note that in my example, I used the format1 line to match all multiline log text into the message field. Then, I used Coralogix parsing rules to parse my logs into a JSON format. For more information on Coralogix parsing rules visit here.
Fluent Bit is a multi-platform Log Processor and Forwarder which allows you to collect data/logs from different sources, unify and send them to multiple destinations.
The Main config, use:
[SERVICE]
    Log_Level debug
    Parsers_File /path/to/parsers.conf
[INPUT]
    Name tail
    Path /var/log/fluent-bit/*.log
    Multiline On
    Parser_Firstline multiline_pattern
parsers.conf file:
[PARSER]
    Name multiline_pattern
    Format regex
    Regex ^\[(?<timestamp>[0-9]{2,4}\-[0-9]{1,2}\-[0-9]{1,2} [0-9]{1,2}\:[0-9]{1,2}\:[0-9]{1,2})\] (?<message>.*)
Note: In Fluent Bit, the multiline pattern is set in a designated file (parsers.conf) which may include other REGEX filters. At that point, it’s read by the main configuration in place of the multiline option as shown above. Secondly, in a Fluent Bit multiline pattern REGEX you have to use a named group REGEX in order for the multiline to work.
For more info on multiline in Fluent Bit visit here.
2017-03-29 10:00:00,123^%{TIMESTAMP_ISO8601} (In Logstash you can also use Grok patterns)
2017-03-29 Or Mar 22, 2020^(\d{2,4}-\d{2}-\d{2,4}|[A-Za-z]{3} \d{1,2}, \d{4})
How to check for a multiline issue in Coralogix
It is recommended to look for multiline problems once integration was implemented so you can be sure your log collection works correctly. You can take a few steps in Coralogix to check whether you are dealing with a possible multiline issue:
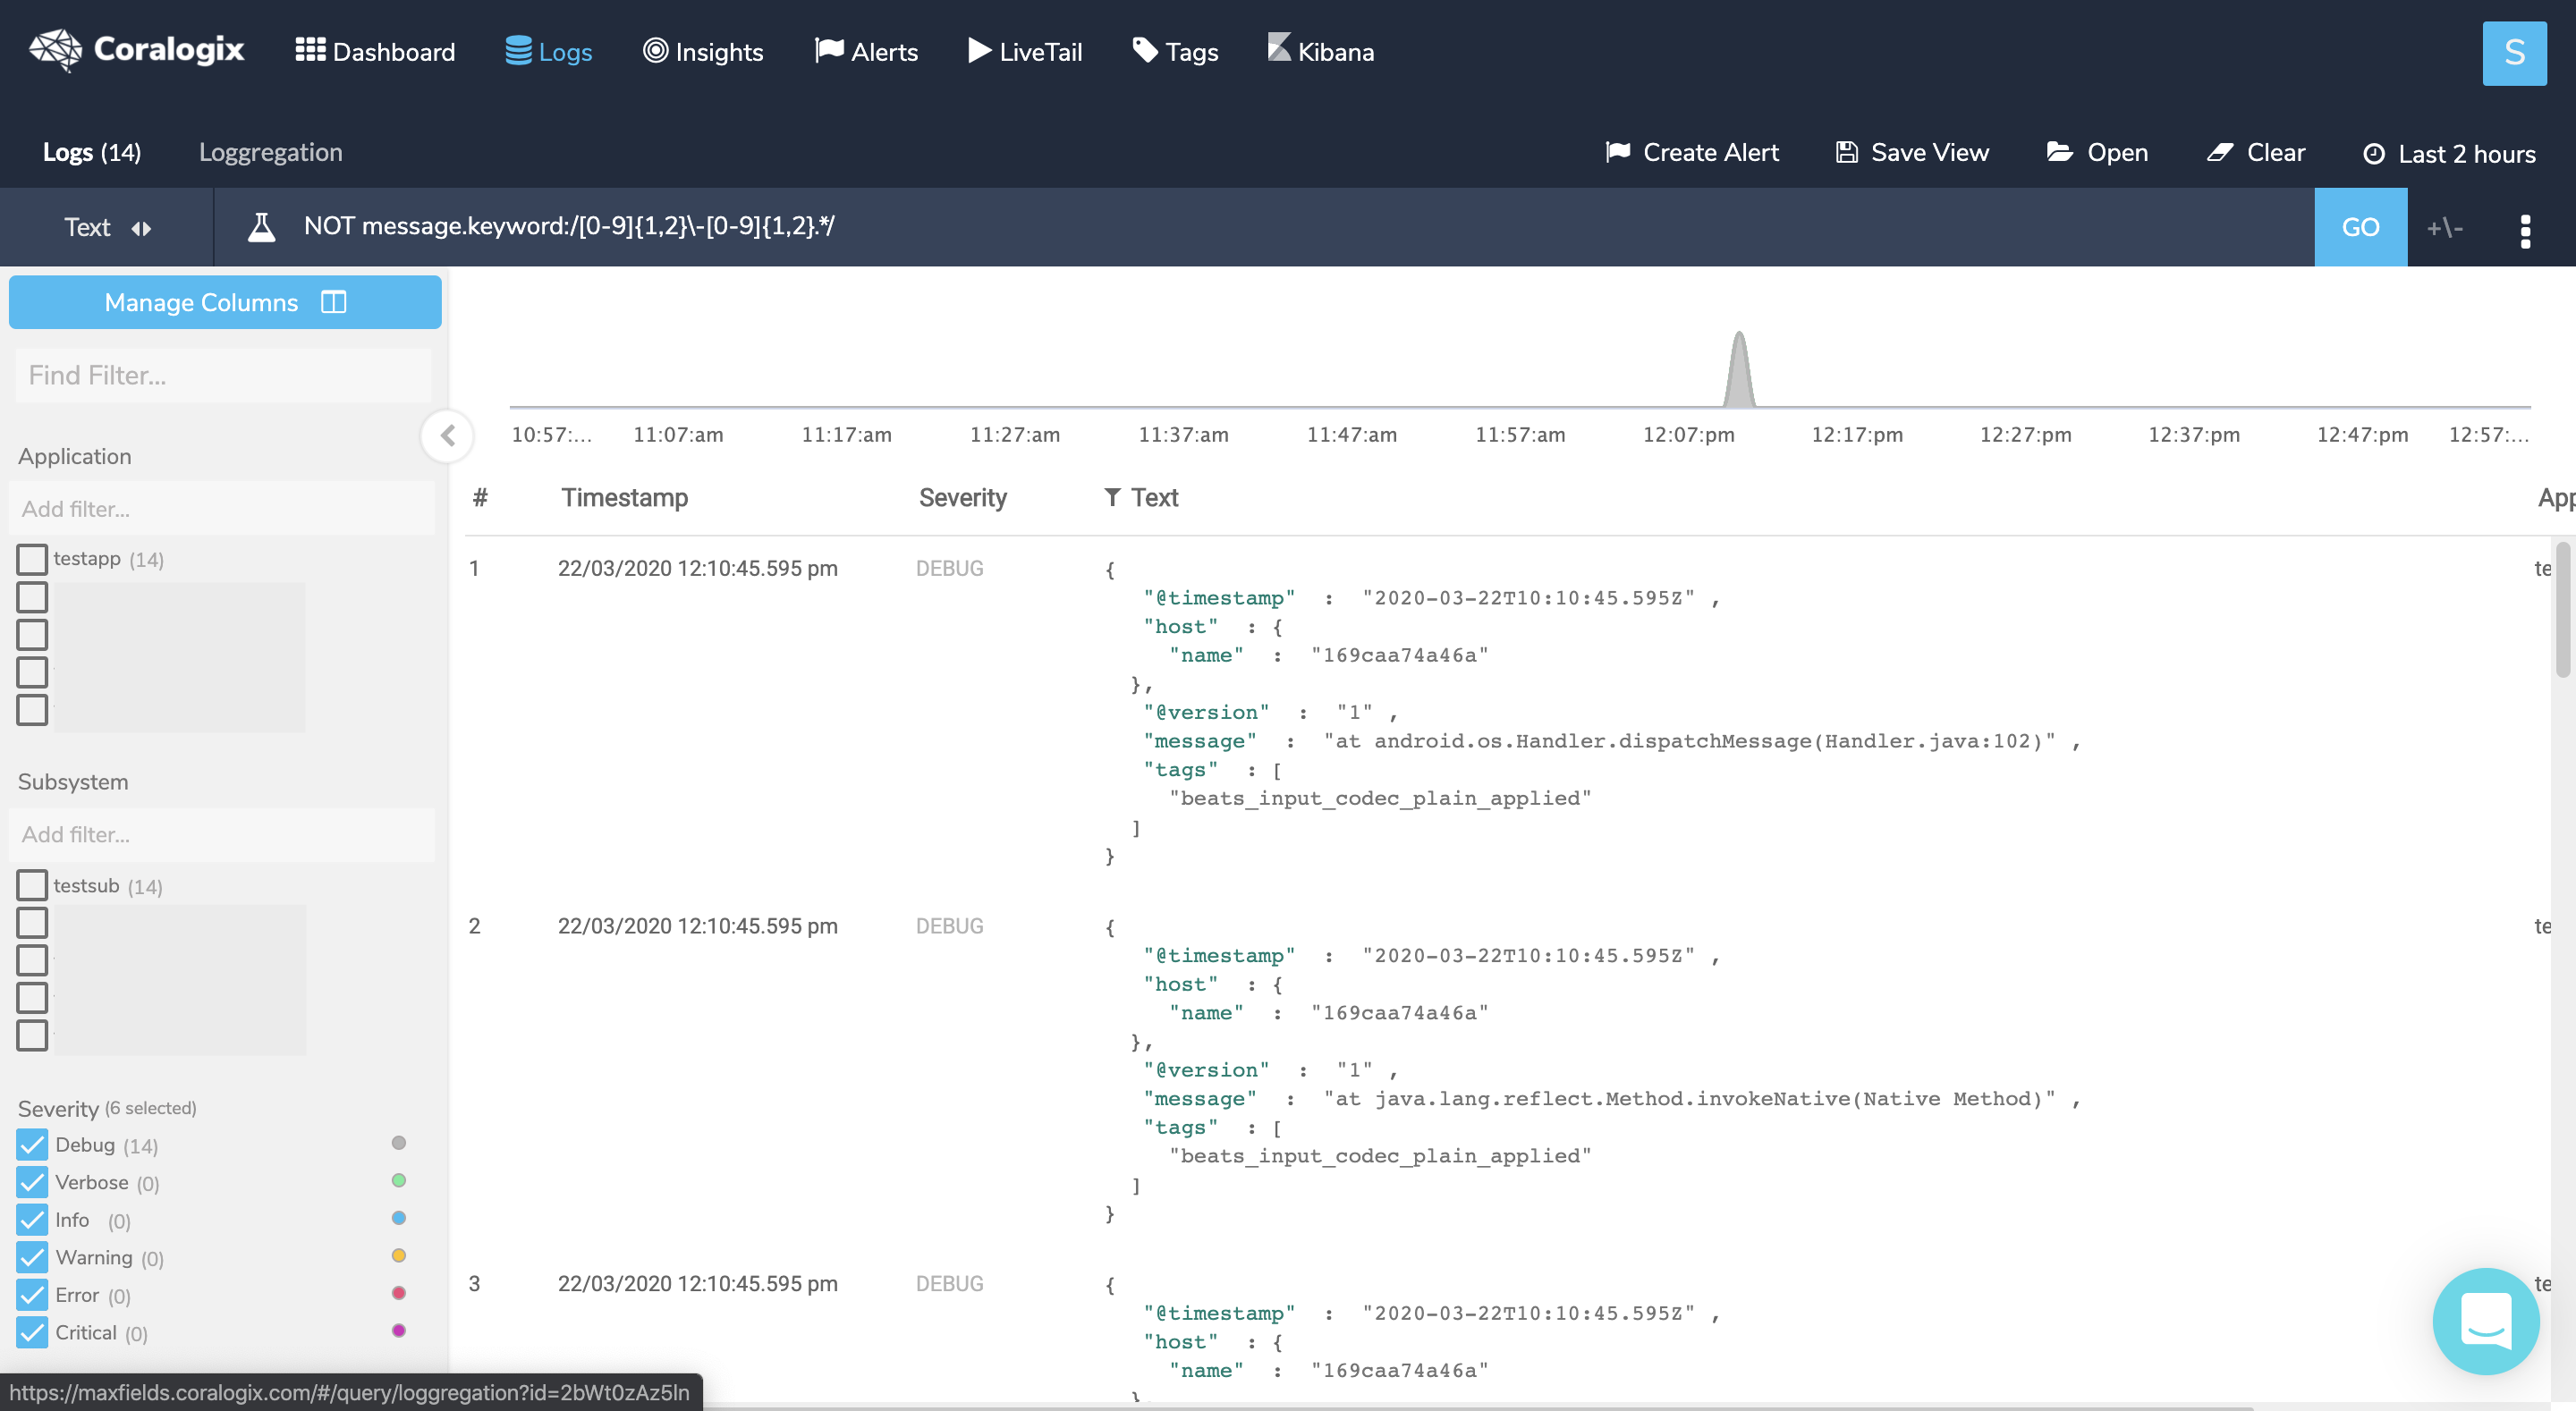
Given the above example of Java stack trace logs, when you know what is the beginning of a line you can create a NOT query on those logs to see if you have any logs that don’t start as expected, which might point to a multiline issue.
Query : NOT message.keyword:/[0-9]{1,2}\-[0-9]{1,2}.*/
To verify that these logs are indeed part of another log entry click on one of them, then hover the +/- sign near the ‘GO’ button and choose a time interval (the min 5 seconds should suffice) and check whether you can find a log before the chosen log that represents its beginning. In our example, I would find the log that starts with the timestamp just right before the marked log. To solve this issue, set a new multiline pattern in your configuration and restart your service.
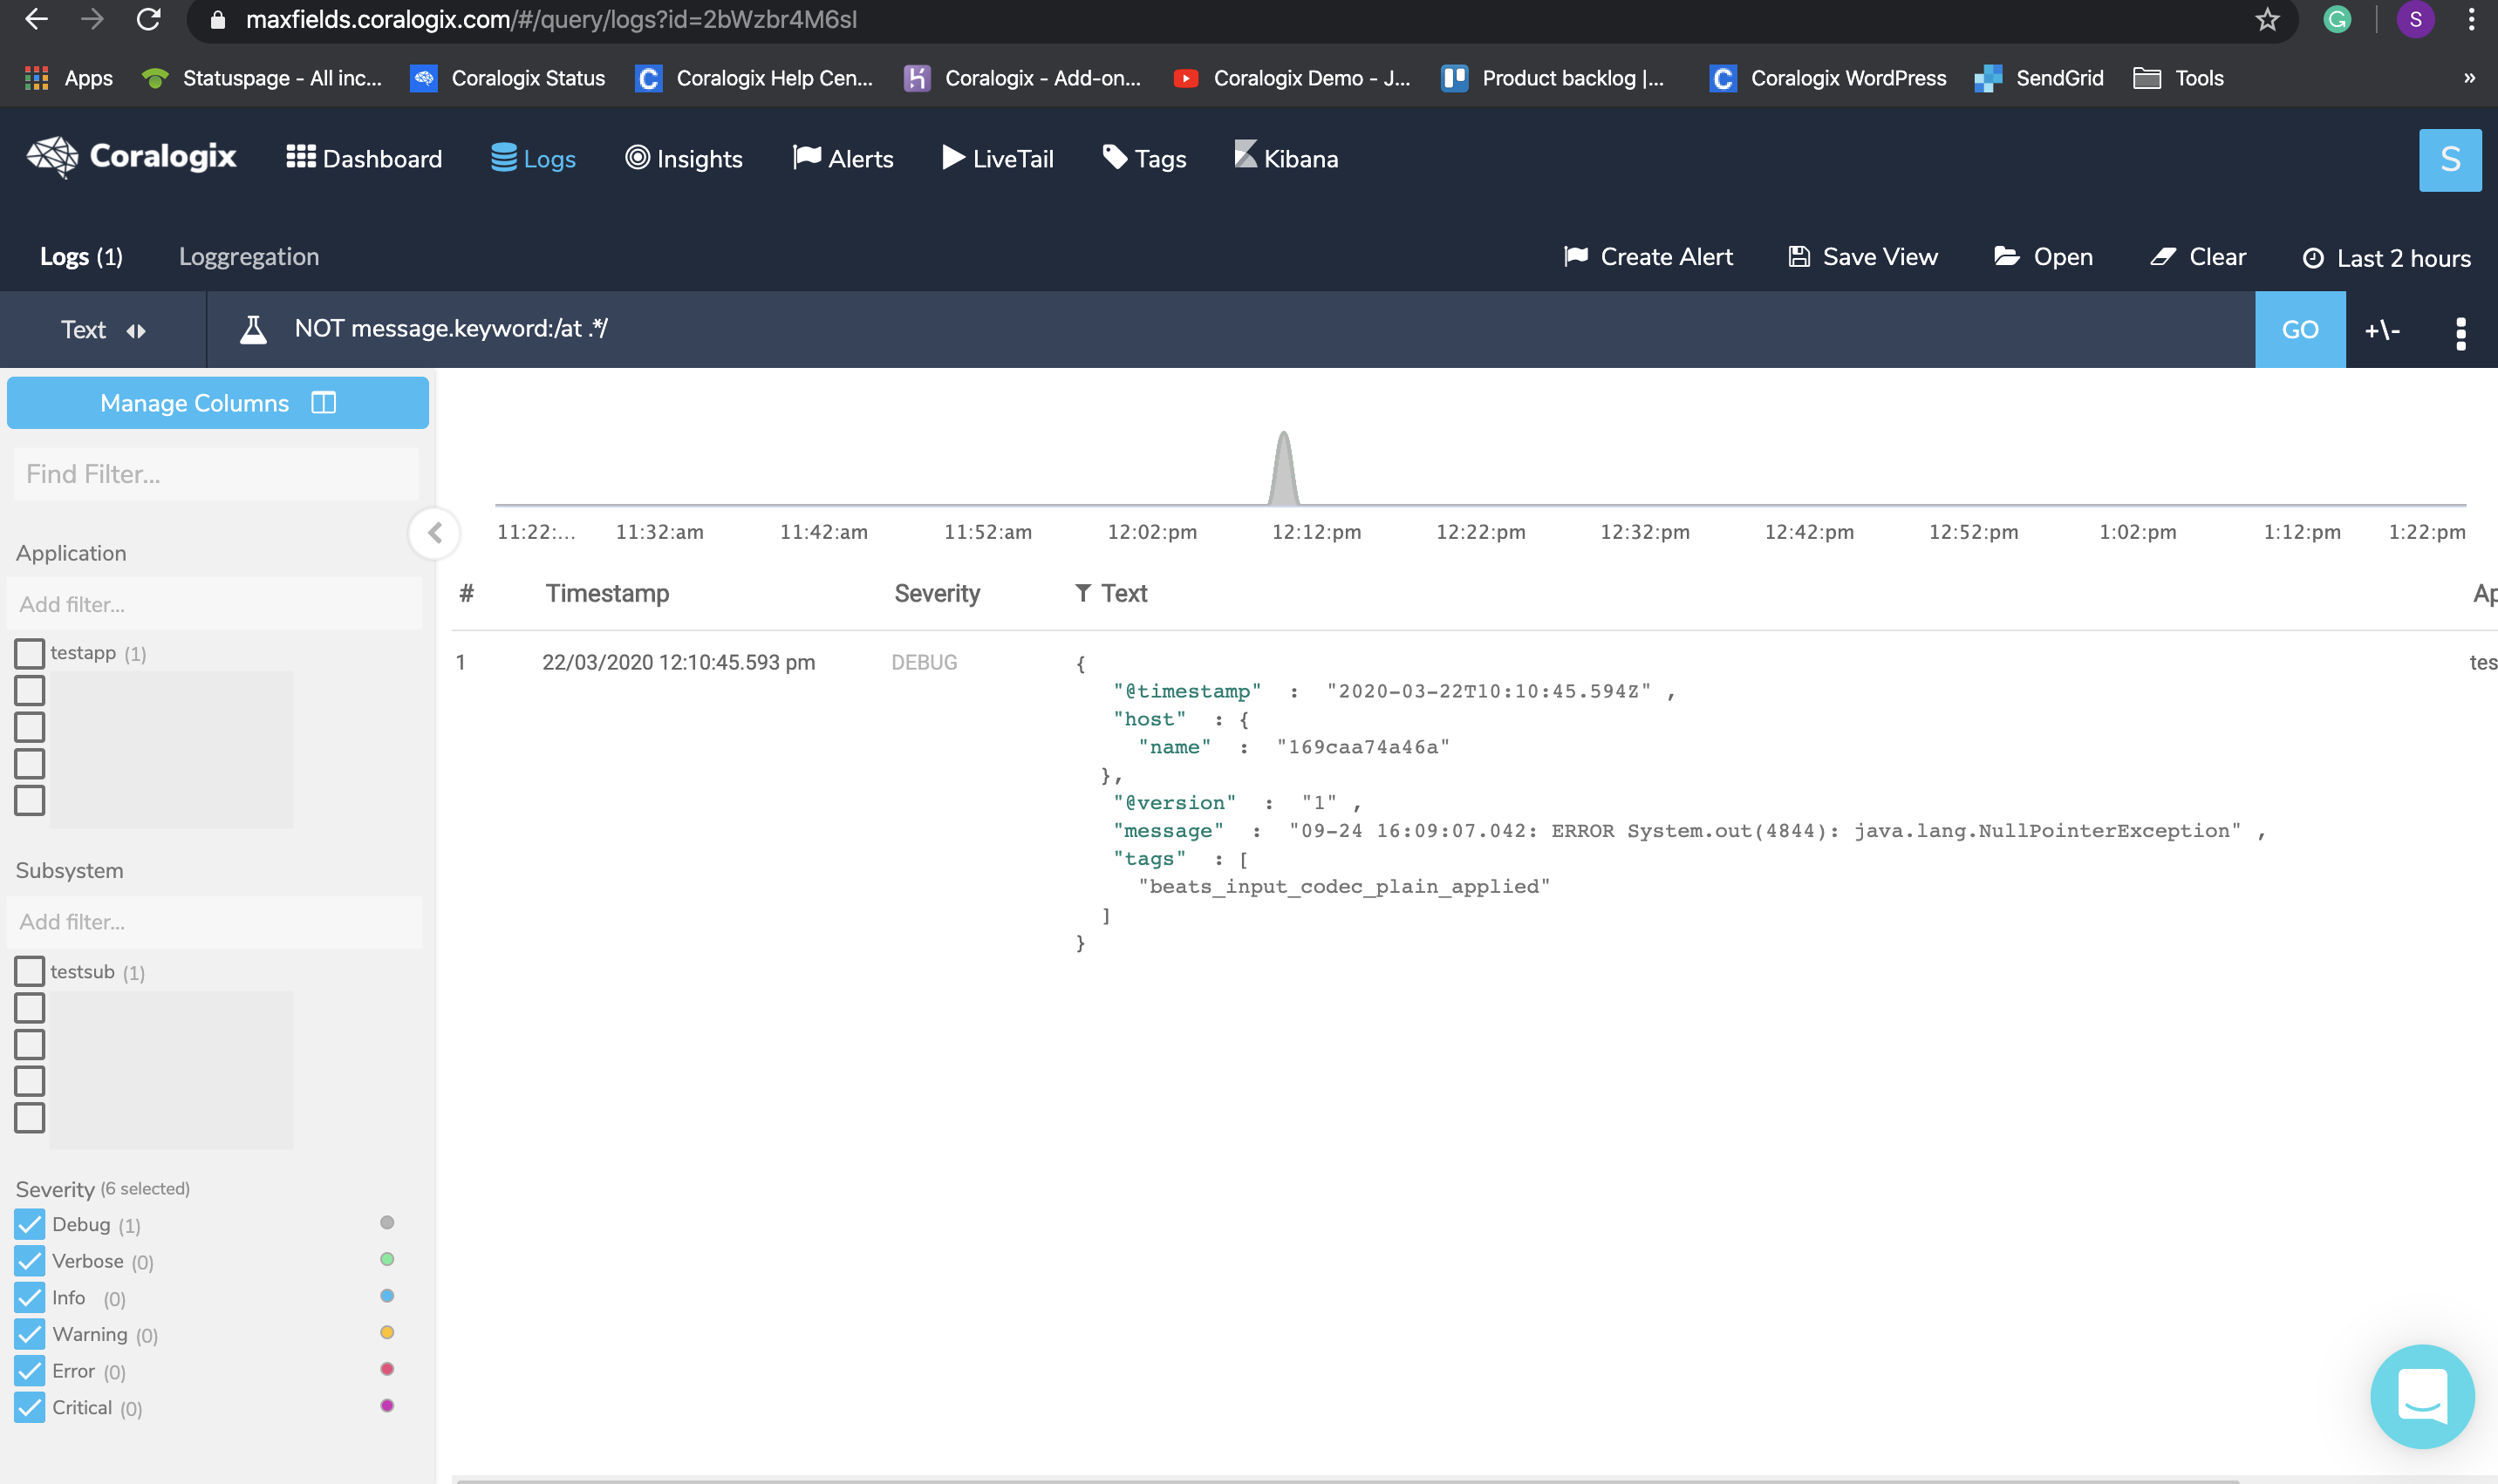
When you are not sure what is the beginning of a line but are encountering logs that don’t seem to represent a full log, you can create a NOT query on those logs to see what are their possible beginnings.
Query : NOT message.keyword:/at .*/
Click on the result, hover the +/- sign and check if you got any logs before or after the chosen log that might be a part of it. To solve this, set a new multiline pattern in your configuration and restart your service.
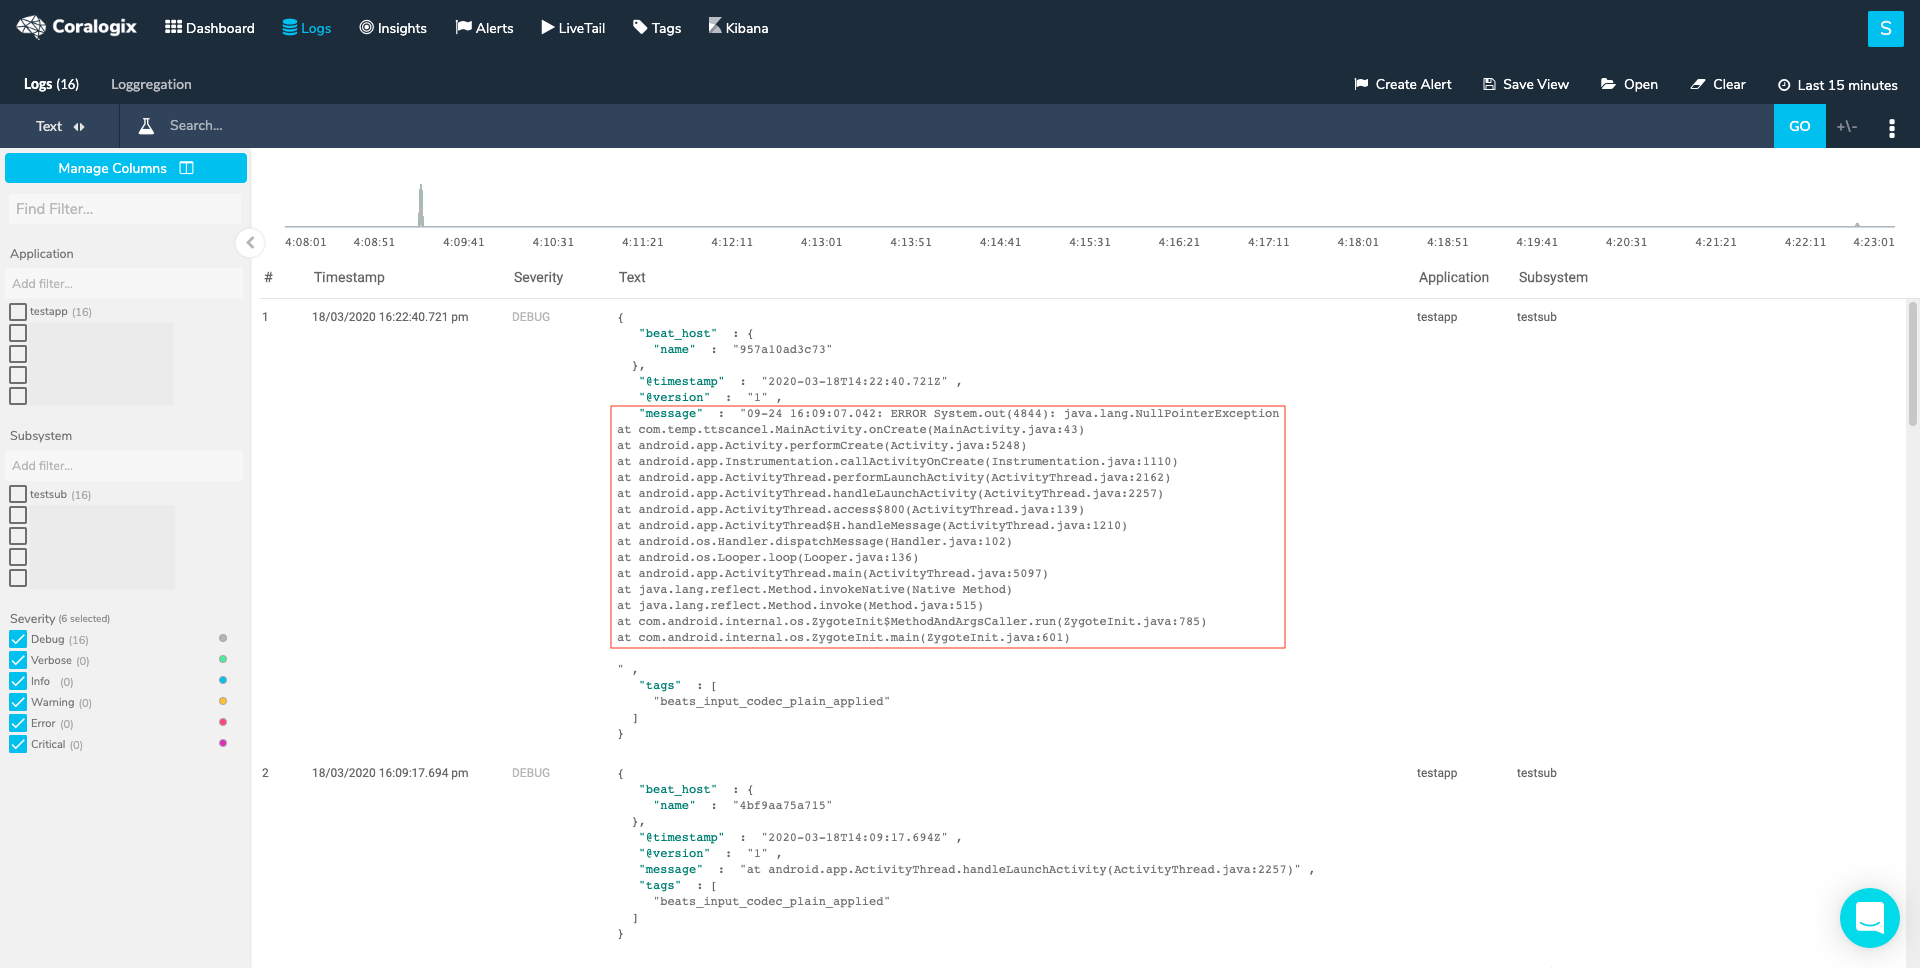
Use Loggregation to identify log templates that belong to multiline logs. Briefly, Loggregation is a Coralogix proprietary algorithm that condenses millions of log entries into a narrow set of patterns, allowing you to easily identify a case where the message field, within a template, doesn’t contain the full log message. After setting the right multiline in our configuration we should expect the full log entry to look like this:
Need help? check our website and in-app chat for quick advice from our product specialists.
In recent years, microservices have emerged as a popular architectural pattern. Although these self-contained services offer greater flexibility, scalability, and maintainability compared to monolithic applications, they…
Distributed microservices and cloud computing have been game changers for developers and enterprises. These services have helped enterprises develop complex systems easily and deploy apps faster….
Gaming apps are complex systems. They combine multi-function systems, like the game engine, to other resources such as server containers, proxies and CDNs in order to…
Where Modern Observability and Financial Savvy Meet.