AWS IAM Best Practices
In today’s interconnected digital landscape, robust IAM (Identity and Access Management) practices are critical pillars of an organization’s cybersecurity strategy. IAM serves as the fortress guarding…

Cloud environments like AWS monitoring can be a challenge for security monitoring services to operate in since assets tend to dynamically appear and disappear. Making matters more challenging, some asset identifiers that are stable in traditional IT environments like IP addresses are less reliable due to their transient behavior in a cloud service like AWS. Amazon GuardDuty protects your AWS environment with intelligent threat detection and continuous monitoring.
GuardDuty is a continuous security AWS monitoring service that analyzes log data from sources like VPC Flow Logs, AWS CloudTrail event logs, Route 53, and DNS logs. It uses threat intelligence feeds, such as lists of malicious domains and IP addresses together with machine learning to identify unexpected and potentially malicious activity.
Malicious activity can include unusual API calls, unauthorized deployments that can indicate that an account was compromised, reconnaissance by attackers, issues like escalations of privileges, exposed credentials, or communication with malicious IP addresses, URLs, or domains.
GuardDuty can be configured to send logs to S3 and Cloudwatch which can ship the logs to Coralogix via our Cloudwattch and S3 integrations.
When GuardDuty detects suspicious or malicious activity in your account it generates a finding. A Finding can be viewed in the GuardDuty console, but it can also be sent as a log.
Guard duty finding format:
ThreatPurpose:ResourceTypeAffected/ThreatFamilyName.ThreatFamilyVariant!Artifact
The threat purpose is at the highest level and describes the primary purpose of a threat or a potential attack. It includes descriptions like:
ResourceTypeAffected describes which AWS resource is the potential target of an attack. Currently, EC2 instances, credentials, and resources can be identified.
ThreatFamilyName describes the overall threat or potentially malicious activity that GuardDuty is detecting.
ThreatFamilyVariant describes the specific variant of the ThreatFamily that GuardDuty is detecting. Attackers often slightly modify the functionality of the attack, thus creating new variants.
Artifact describes a specific resource that is owned by a tool that is used in the attack.
‘Backdoor:EC2/C&CActivity.B!DNS’ Is interpreted as: A suspected Backdoor attack was identified. An EC2 instance is targeted. It was identified to query a domain name associated with a Command and Control server. Command and Control servers issue commands to members of a botnet.
‘CryptoCurrency:EC2/BitcoinTool.B!DNS’ is interpreted as an EC2 instance is querying a domain name that is associated with the cryptocurrency-related activity. Unless you use this EC2 instance to mine or manage cryptocurrency or your EC2 instance is involved in blockchain activity, your EC2 instance might be compromised.
The log field that holds the type is ‘detail.type’. In the following example, we used Coralogix rules with a regex to extract the different finding’s format components into the fields:
‘threat_purpose’
‘threat_resorce_affected
‘Threat_name’ (combined family name and family variant)
‘threat_artifact
Each log includes the finding’s severity in the field ‘. This is a number between 0 and 10 (Values 0 and 9.0 to 10.0 are currently reserved for future use).
High severity is defined as between severity 6.9 to 9
Medium severity is defined as between severity 3.9 to 7
Low severity is defined as between severity 0 and 4
Another interesting field is ‘detail.resource.instanceDetails.service.resourrceRole’. Its optional values are “TARGET” or “ACTOR” and represent whether your resource was the target of the suspicious activity or the actor that performed the suspicious activity respectively.
The log has many other fields that describe the findings as well as the resources involved. Here is an example log:
{

 "version": "0",

 "id": "xxxxx-xx",

 "detail-type": "GuardDuty Finding",

 "source": "aws.guardduty",

 "account":"1234567890",

 "time": "2018-02-28T20:25:00Z",

 "region":"us-west-2",

 "resources": [],

 "detail": {

      "schemaVersion":"2.0",

      "accountId": "1234567890",

      "region": "us-west-2",

      "partition": "aws",

      "id": "xxxxxxxx",

      "arn": "arn:aws:guardduty:us-west-2:1234567890:detector/XXXXXXX/finding/xxxxxxx",

      "type": "Trojan:EC2/PhishingDomainRequest!DNS",

      "resource": {

                     "resourceType": "Instance",

                     "instanceDetails":{

                                      "instanceId": "i-99999999",

                                      "instanceType": "m3.xlarge",

                                      "launchTime": "2016-08-02T02:05:06Z",

                                      "productCodes": [{

                                                  "productCodeId":   "GeneratedFindingproductCodeId",

                                                  "productCodeType": "GeneratedFindingProductCodeType"

                                                  }],

                                      "iamInstanceProfile": {

                                                  "arn": "GeneratedFindingInstanceProfileArn",

                                                  "id": "GeneratedFindingInstanceProfileId"

                                                 },

                                       "networkInterfaces": [{

                                                  "ipv6Addresses": [],

                                                  "privateDnsName": "GeneratedFindingPrivateDnsName",

                                                  "privateIpAddress":"127.0.0.1",

                                                  "privateIpAddresses": [{

                                                             "privateDnsName": "GeneratedFindingPrivateName",

                                                             "privateIpAddress":"127.0.0.1"

                                                          }],

                                       "subnetId": "GeneratedFindingSubnetId",

                                       "vpcId": "ein-ffdd1234",

                                       "securityGroups": [{

                                                 "groupName": "SecurityGroup01",

                                                 "groupId": "GeneratedFindingSecurityId"

                                                 }],

                                       "publicDnsName":"bbb.com",

                                       "publicIp": "127.0.0.1"

                                       "tags": [{

                                         "key": "GeneratedFindingInstaceTag1",

                                         "value":"GeneratedFindingInstaceValue1"

                                       },

                                       {

                                         "key":"ami-99999999",

                                         "imageDescription": "GeneratedFindingInstaceImageDescription"

                                       }],

                                       "service": {

                                       "serviceName": "guardduty",

                                       "detectorId": "xxxxxx",

                                       "action": {

                                          "actionType": "DNS_REQUEST",

                                          "dnsRequestAction":{

                                              "domain": "GeneratedFindingDomainName",

                                              "protocol": "UDP",

                                              "blocked": true

                                           }

                                       },

                                       "resourceRole": "TARGET",

                                       "additionalInfo": {

                                          "threatListName": "GeneratedFindingThreatListName",

                                          "sample": true

                                       },

                                       "eventFirstSeen": "2020-06-02T20:22:26.350Z",

                                       "eventLastSeen": "2020-06-03T20:22:26.350Z",

                                       "archived": false,

                                       "count": 1.0

                                },

                                "severity": 8.0,

                                "createdAt": "2020-06-02T20:22:26.350Z",

                                "updatedAt": "2020-06-03T20:22:26.350Z",

                                "title":"Trojan:EC2/PhishingDomainRequest!DNS",

                                "description": "Trojan:EC2/PhishingDomainRequest!DNS"

                          }

                  }

         }

}
Coralogix log management solution complements GuardDuty by creating one pane of glass through which DevSecOps, as well as other teams like engineering and CS, can view logs from different accounts and parts of the infrastructure in a consolidated way.
Coralogix visualizes the data and allows customers to create their visualizations based on their needs. It gives users powerful analysis tools and helps identify correlations between findings and other infrastructure events using ML techniques.
Coralogix can also put logs in the context of the application’s lifecycle in the CI/CD process – allowing you to assess the impact of every change on your infrastructure.
In the next section, we’ll provide a few examples of Coralogix alerts and visualizations based on GuardDuty logs. We’ll also include a few examples based on Cloudwatch logs, showing how Coralogix can help protect the integrity of GuardDuty itself.
Coralogix comes with an easy-to-use but sophisticated alerts’ engine. Here, we present a diverse set of examples that will highlight different capabilities within the engine. Each alert is defined by a query that identifies the set of logs that will trigger the alert.
And by a condition that defines when the alert should be triggered.
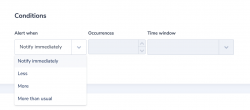
Throughout this section, we’ll provide the query and condition for each example alert.
The following is a Cloudtrail alert and it triggers when the GuardDuty findings collection is disabled or altered. This is an example of how Coralogix can help protect the integrity of GuardDuty itself from attacks or operational errors.
Alert Query is based on Cloudtrail’s log entries:
Alert condition: eventSource:”guardduty.amazonaws.com” AND eventName.keyword:/CreateFilter|DeleteDetector|DelteIPSeet|DeleteMember|DeletePublishingDestination|DisableOrganizationAdminAccount|StopMonitoringMembers|UpdateDetector|UpdateIPSet|UpdatePublishingDestination|UpdateThreatIntelSet)/
Alert Condition is ‘Notify immediately’.
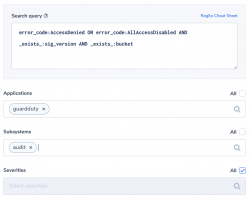
This is another Cloudtraill alert example that will be triggered if an attempt is made to alter access to S3 buckets that collect GuardDuty logs.
Alert Query: eventSource:”s3.amazonaws.com” AND (eventName:PutBucketAcl OR eventName:PutBucketPolicy) AND requestParameters.bucketName:your-bucket-names
Alert Condition ‘Notify immediately’
This is another GuardDuty integrity alert. This time it is based on GuardDuty logs and uses the ‘less than’ condition in Coralogix alert engine. The alert will be triggered if no GuardDuty logs will arrive in a 10 minutes window.
Alert Query: source:”aws.guardduty”
Alert Condition: ’less than 1’ in 10 minutes. Again the values should be tuned for your specific infrastructure profile.
Next, we’ll identify a finding that indicates a resource is trying to connect with a Phishing website or trying to set one up.
Alert query: threat_name:phishingdomainrequest
Alert Condition: ‘Notify immediately’
A Resource role, detail.resource.instanceDetails.service.resourceRole, with the value “ACTOR” indicates that your internal resource was involved in suspicious activity against a remote host. This alert will be triggered if such a finding is sent to Coralogix.
Alert Query: detail.resource.instanceDetails.service.resourceRole:actor
Alert Condition: ‘Notify immediately’
This alert uses Coralogix’s ‘Ratio alert’ capability. It will be triggered when the ratio between ‘Backdoor’ findings and all findings is higher than a defined value. Ratio alerts have two queries and the alert triggers based on the ratio between the count of their results.
Alert Query 1: threat_purpose:backdoor
Alert Query 2: source:”aws.guardduty”
The condition, in this case, will be ‘more than 0.1’ in 30 minutes, which means that it will be triggered if the ratio is more than 10% within the time window of 30 minutes. Choose a time window that will be meaningful but long enough to avoid false alerts due to spikes.
This alert uses Coralogix dynamic alerting capability to learn the behavior of your application and will trigger an alert if the query results deviate from the usual values. In this example, an alert will be triggered if a more than usual amount of high severity findings are detected.
Alert query: source:”aws.guardduty” AND detail.resource.instanceDetails.severity.numeric:(>6.9 AND <=8.9)
We add the source to make sure the alerts will not be triggered by other logs with the same field. Amazon findings with a severity between 7 and 9 are considered high severity.
The condition is ‘More than usual’ and we defined a threshold of 10 which means that the alert will be triggered if the number of high severity findings will be more than usual and more than the threshold.
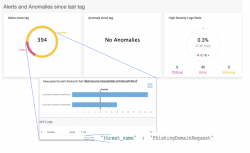
Visualizations are about trends and about giving users insights across accounts and infrastructure into GuardDuty findings. Here are few examples:
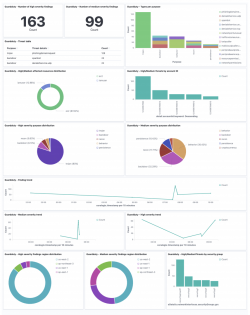
Starting from the top left you can see:
Count of high and medium severity findings
These visualizations use AWS classification of High for severities between 6.9 and 9, Medium for severities between 3.9 and 7 and Low for ones that are between 0 and 4 (severities 0 and 9-10 are kept for future use).
Types per purpose
This visualization uses the parsed finding and gives the different types of findings per purpose.
High/Medium affected resource distribution
Gives the ratio of each resource associated with findings. We filter by high and medium threats ( between 3.9 and 9).
High/Medium threats by account
This visualization gives the findings by accounts which enable users to get a birds-eye view of which accounts are under attack or maybe already compromised.
High and Medium severity purpose distribution
These two visualizations use the parsed findings field.
Trend lines
Showing the trends of overall findings and per medium and high severity.
High and Medium severity by region
These visualizations show the findings distributions by region. Similar to distribution by account it gives the big already compromised or under attack.
High and Medium threats by security group
This visualization uses the security group name field, detail.resource.instanceDetails.networkInterfaces[0].securityGroups[0].groupName (pay attention to the arrays, they are tricky) to find if there is a specific more vulnerable security group.
Coralogix has the ability to put logs in the context of application lifecycle events. It integrates with CI/CD pipelines to create version tags for every change and release. Logs can be observed in the context of these tags for greater context. Tags can also be created via API calls or manually.
Aside from identifying deployments of new features or versions, it can also point to events like significant customers or marketing campaign rollouts that can change usage patterns.
In this example, we see that we had a spike in security events that started around 7:30
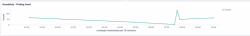
A quick look at the logs screen will confirm that an application lifecycle event happened around that time (see the customizable logo on the logs’ flow graph)

The tags dashboard will discover that it took the bad actors about 3 hours to start exploiting new vulnerabilities that were introduced into the application in the last release. Clicking on the alerts that came following the deployment will take us into an insight screen and we see that two of our AWS accounts are already infected with a Phishing DNS request.
In today’s interconnected digital landscape, robust IAM (Identity and Access Management) practices are critical pillars of an organization’s cybersecurity strategy. IAM serves as the fortress guarding…
As we reflect on AWS re:Invent 2023, the Coralogix team is invigorated by the incredible response and feedback we received from the thousands of participants who…
Amazon Web Services, Inc. (AWS), an Amazon.com company, today announced the 2023 AWS Partner Award winners, recognizing leaders around the globe playing a key role helping…
