Ship OpenTelemetry Data to Coralogix via Reverse Proxy (Caddy 2)
It is commonplace for organizations to restrict their IT systems from having direct or unsolicited access to external networks or the Internet, with network proxies serving…

This is last installment of our 3-part series on running ELK on Kubernetes with ECK. If you’re just getting started, make sure to check out Part 1 and Part 2.
With that, let’s jump right in.
When dealing with a Kubernetes cluster, containers can appear and disappear at any time. As a container gets removed, the data contained within it is lost too. That’s no problem for stateless apps, but Elasticsearch is a stateful one, and needs to preserve some of its data. Let’s learn how to do this with Persistent Volumes, which we’ll sometimes call PVs, for short, throughout this post.
First, we’ll delete the last Elasticsearch node we created in the previous post:
kubectl delete -f https://raw.githubusercontent.com/coralogix-resources/elastic-cloud-on-kubernetes-webinar/master/04_single_node_es_plugin_install.yaml
Let’s clean it up even more and delete Kibana:
kubectl delete -f https://raw.githubusercontent.com/coralogix-resources/elastic-cloud-on-kubernetes-webinar/master/02_kibana.yaml
And now we’ll remove the Dashboard:
kubectl delete -f https://raw.githubusercontent.com/coralogix-resources/elastic-cloud-on-kubernetes-webinar/master/03_k8s_dashboard-not-safe-for-production.yaml
Next, let’s create a 5GB persistent volume we’ll call “es-data-holder“:
kubectl apply -f https://raw.githubusercontent.com/coralogix-resources/elastic-cloud-on-kubernetes-webinar/master/05_persistent-volume.yaml
The output confirms that the PV has been created:
![]()
To display a list of persistent volumes available, we can use this next command:
kubectl get pv
In our case, the output should look like this:

Let’s analyze the YAML file we used to create this PV.
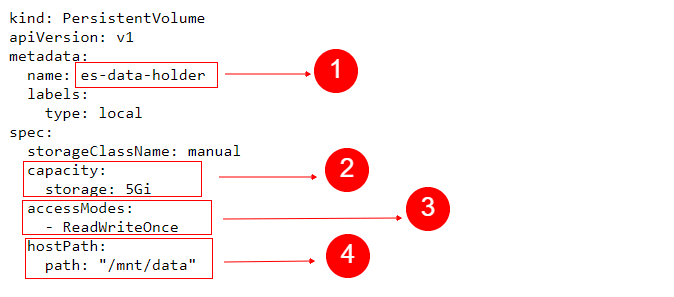
We can see the name we chose for the PV, in the metadata section. Under capacity, we specified 5Gi for the storage attribute. While other tools may use MB or GB to represent megabytes and gigabytes respectively, Kubernetes uses Mi and Gi to represent so-called mebibytes and gibibytes. As an example, a kilobyte is made out of 1000 bytes, while a kibibyte represents 2 to the power of 10 (2^10) bytes, which equals 1024. Similarly, a mebibyte is 2^20 bytes, a gibibyte is 2^30 and so on.
We set accessModes to ReadWriteOnce, which means that the volume may be mounted in read-write mode by only one node.
hostPath instructs Kubernetes to use the local directory specified by path, for this PV.
Note that we’re using this here since it’s a convenient way to quickly start testing, without spending hours to setup network shared filesystems, or similar solutions. However, in production environments, you should never use a local directory for a PV. Instead, use filesystems that are available to all nodes, such as NFS shares, AWS storage, GlusterFS and so on.
Although our persistent volume has 5 gibibytes of total space available, we don’t have to allocate all of it to a single pod. Just like we can partition a disk to be used by multiple operating systems, so can we allocate different portions of the PV to different pods. In this case, we will claim 2 gibibytes for our pod.
Let’s look at the YAML file we will use for this purpose.

We can see a few new additions, compared to the YAML files we used previously for our Elasticsearch node. In the section named volumeClaimTemplates we request 2Gi of space from one of the persistent volumes existent in Kubernetes. The application will decide which PV will serve the request.
Let’s apply the settings in this YAML file:
kubectl apply -f https://raw.githubusercontent.com/coralogix-resources/elastic-cloud-on-kubernetes-webinar/master/06_es-with-persistent-volume-enabled.yaml
As usual, we should wait for the Pod to be created. We can check the status with the same command we used before:
kubectl get pods
We will continue only when the quickstart-es-default-0 pod displays Running under its STATUS column and it’s also READY 1/1.
Now let’s see, did our Pod successfully claim the persistent storage it needed? We can check, with the next command:
kubectl get pvc
Note that “pvc” here stands for Persistent Volume Claim.
The output will show that the claim was successful. We can tell, because we see Bound under the STATUS column:

For simplicity, up until now we’ve only played around with a single Elasticsearch node. But, under normal circumstances, Elasticsearch forms a cluster out of multiple nodes to achieve its performance and resiliency. Let’s see how we can create such a cluster.
This time, we will provision two persistent volumes, named “es-data-holder-01” and “es-data-holder-02“.
Afterwards, we will create an Elasticsearch cluster composed of two nodes. Each node will have one of the PVs allocated to it. Normally, Kubernetes will allocate whichever PV it decides is convenient. In most scenarios, multiple pods may use the same persistent volume. However, since we’ll use the ReadWriteOnce option, only one pod may use a PV, hence, one PV will be allocated to one pod and the other will be allocated to the other pod.
Ok, now let’s deploy our multi-node cluster. First, let’s delete the single node Elasticsearch setup we created earlier:
kubectl delete -f https://raw.githubusercontent.com/coralogix-resources/elastic-cloud-on-kubernetes-webinar/master/06_es-with-persistent-volume-enabled.yaml
Let’s also delete the persistent volume we created:
kubectl delete -f https://raw.githubusercontent.com/coralogix-resources/elastic-cloud-on-kubernetes-webinar/master/05_persistent-volume.yaml
Now, we’ll create two new PVs.
kubectl apply -f https://raw.githubusercontent.com/coralogix-resources/elastic-cloud-on-kubernetes-webinar/master/07-pv-for-multi-nodes.yaml
The output will confirm their creation:

Let’s check the available PVs and confirm everything looks as it should:
kubectl get pv

Now let’s take a look at the YAML config we used, where we’ll learn a new trick.
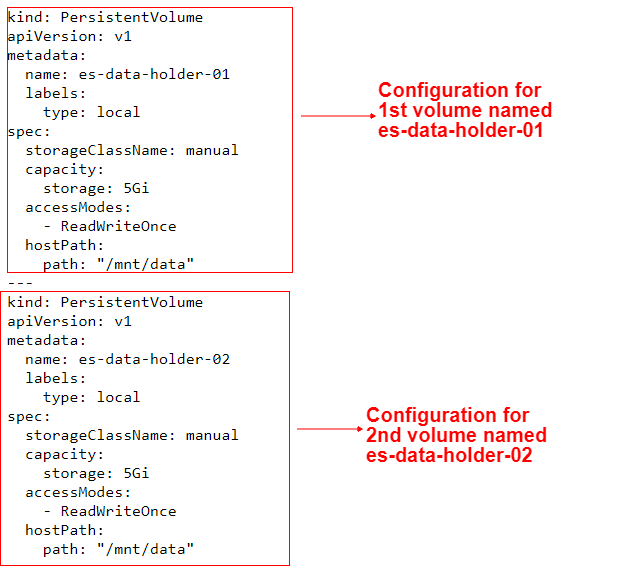
Since we wanted two separate PVs, we should have used two different YAML files. But in this case, we only used one because it’s more convenient.
How did we do this? Notice the three minus signs — in the middle of this config. This let basically allows us to logically separate two different YAML specifications in a single file; pretty simple and effective!
At this point, we can instruct Kubernetes about the multi-node Elasticsearch cluster we want to create.
Again, let’s analyze the contents in the YAML file that we’ll use.
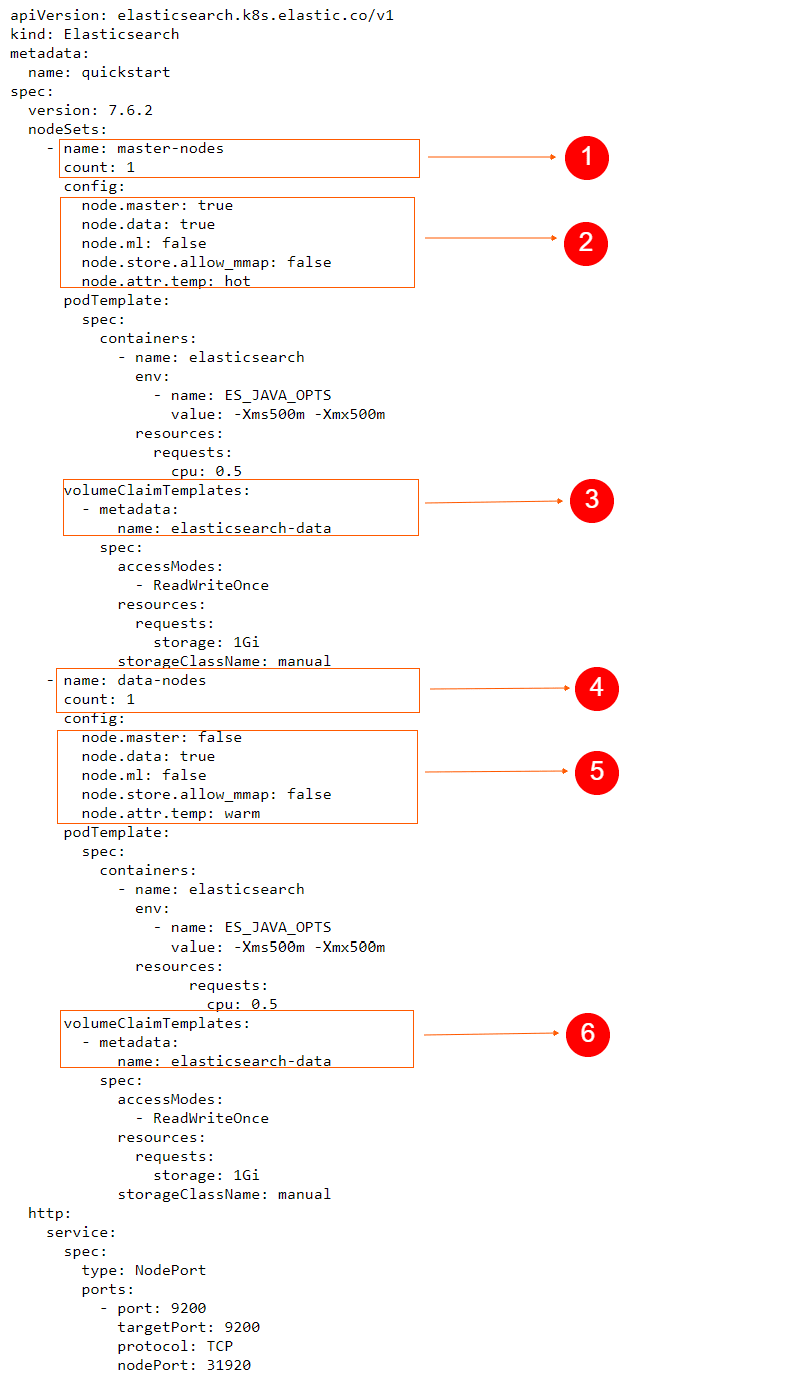
We now have two nodeSets, one with master-nodes and another with data-nodes. We can see that the Elasticsearch master nodes will also serve as data nodes since node.data is also set to true.
For our exercise, we see that the count of master nodes is one. We used the same count for data nodes as well, but in a real-world scenario, we can easily scale up an Elasticsearch cluster by simply setting the count number higher, for whichever nodeset that we want to have more nodes on.
Finally, notice that we configured it so that each pod in the nodeSet will claim one gibibyte of storage space on the persistent volumes.
We’re ready to apply this YAML specification:
kubectl apply -f https://raw.githubusercontent.com/coralogix-resources/elastic-cloud-on-kubernetes-webinar/master/08-multinode-es.yaml
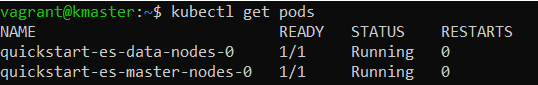
Once again, we’ll check the status of the pods until we notice that quickstart-es-data-nodes-0 and quickstart-es-master-nodes-0 are both Running and READY 1/1:
kubectl get pods
Let’s see how the Persistent Volume Claims look this time:
kubectl get pvc

Now we want to make some cURL requests to Elasticsearch, so we’ll need access to the same type of password we retrieved in previous posts:
PASSWORD=$(kubectl get secret quickstart-es-elastic-user -o go-template='{{.data.elastic | base64decode}}')
Let’s send a request to the _cat API to list information about the nodes available in our Elasticsearch cluster:
curl -u elastic:$PASSWORD -k https://localhost:31920/_cat/nodes?v
We see an output similar to this:

The node.role column is useful here. The letter d indicates that this is a data node. The letter i indicates it is also an ingest node. m means it is eligible for the master role. We can also see an indication of master nodes in the master column. An asterisk, * denotes that this is the currently elected master node and – signals the entry is not elected as master.
In a typical scenario, some data in our Elasticsearch cluster may end up being searched more often while there could be data that’s rarely accessed. In this case, it makes sense to implement the so-called hot-warm architecture.
In such a setup, our often-searched data would end up on hot nodes, while less-frequently searched data would end up on warm nodes. This way, we can do useful things, such as use faster servers for our hot nodes, so that search results are returned quicker for a better user experience. It also helps cut down on cloud-related costs.
You can read more about the hot-warm-cold architecture in this great blog post.
Implementing this in Kubernetes is quite easy, since it does all the heavy lifting for us. We just need to assign the right values to the node.attr settings in our YAML specifications.
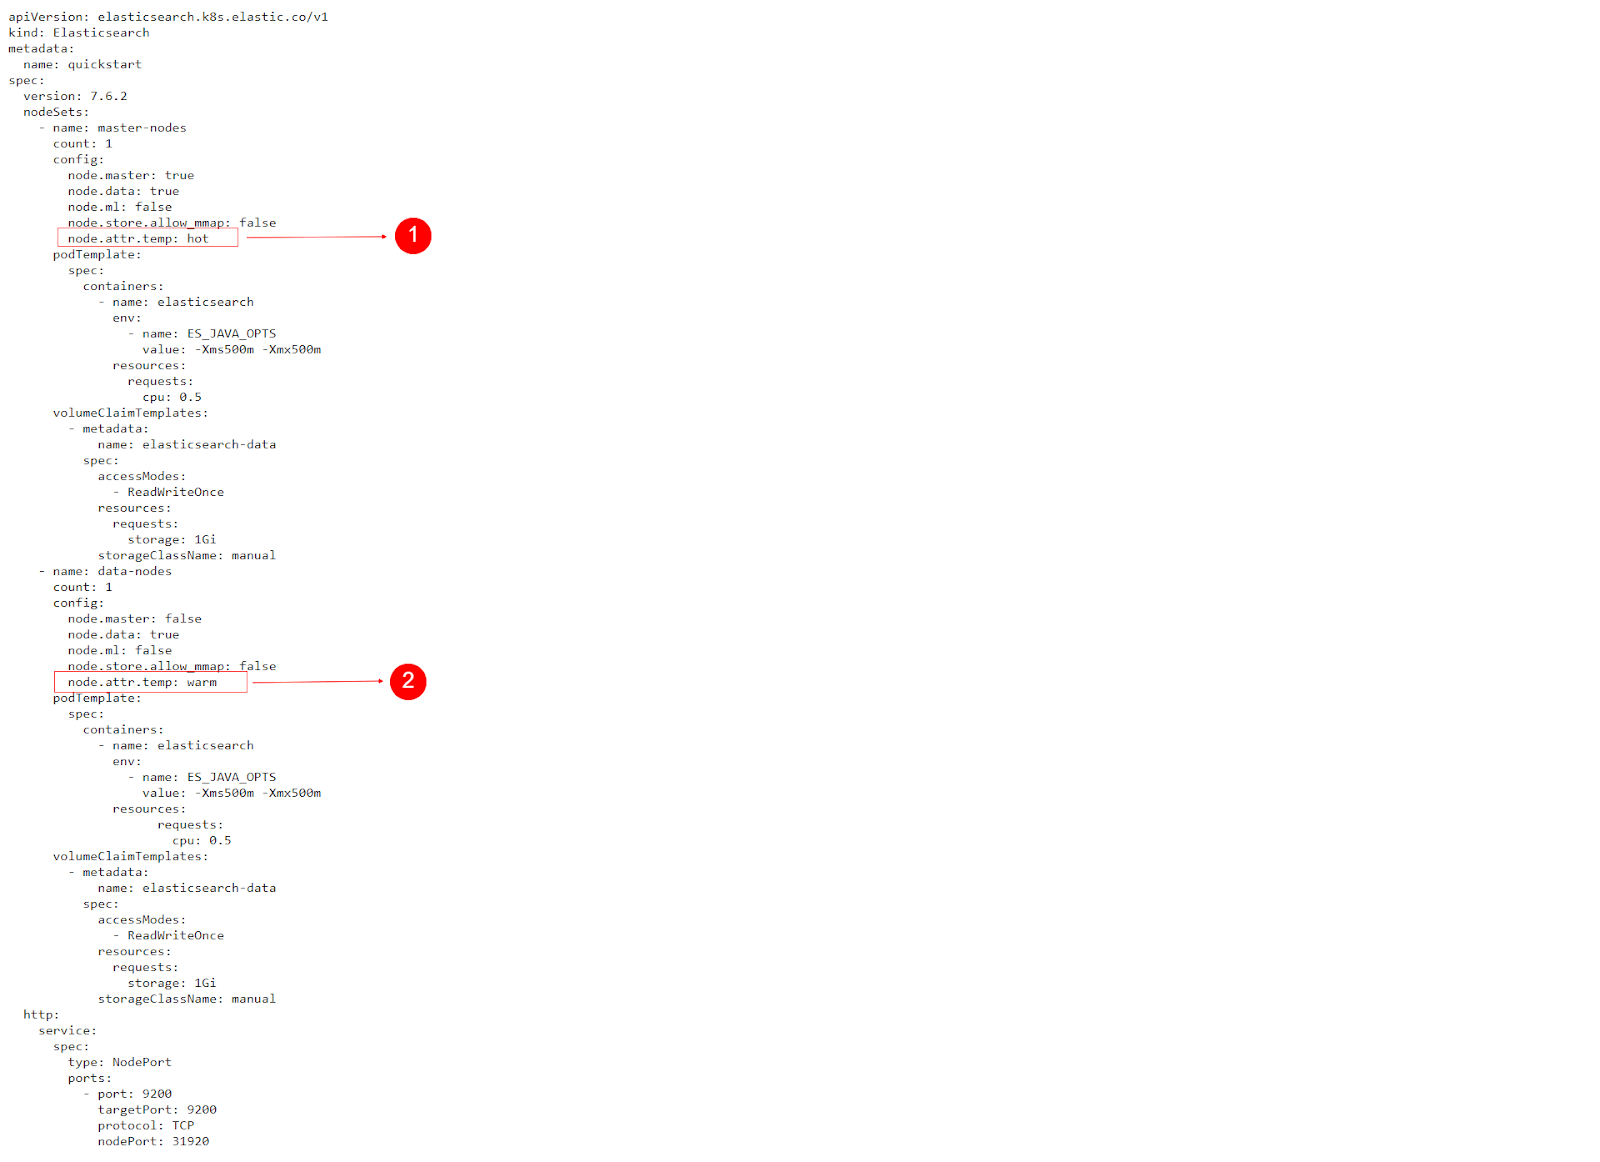
We already used the required node attributes in our previously applied YAML, so the foundation for our hot-warm architecture is already set up at this point.
Our master nodes have the node.attr.temp set to hot and our data nodes have the node.attr.temp set to warm. We implemented this in advance, to avoid having to repeat the steps to delete the Elasticsearch nodes and recreate them, as this can be time consuming on some systems.
Let’s index some data on the nodes and test this hot-warm architecture.
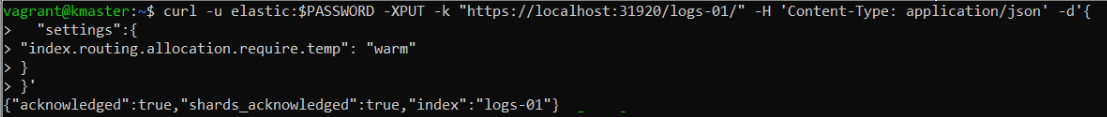
First, we’ll create two indices, named “logs-01” and “logs-02“. We’ll assume “logs-02” will contain fresh new data that is often searched while “logs-01” will contain rarely searched for data.
Ok, let’s jump right in! When we create the first index, we set “index.routing.allocation.require.temp” to “warm”, to ensure that it will be assigned to a warm node:
curl -u elastic:$PASSWORD -XPUT -k "https://localhost:31920/logs-01/" -H 'Content-Type: application/json' -d'{
  "settings":{
"index.routing.allocation.require.temp": "warm"
}
}'
Creating the “logs-02” index is very similar, the difference being that we’ll set the routing allocation parameter to “hot“.
curl -u elastic:$PASSWORD -XPUT -k "https://localhost:31920/logs-02/" -H 'Content-Type: application/json' -d'{
  "settings":{
"index.routing.allocation.require.temp": "hot"
}
}'
Let’s go ahead and send a request to the _cat API and see if the shards from the “logs-01” index were placed on the right node:
curl -u elastic:$PASSWORD -XGET -k https://localhost:31920/_cat/shards/logs-01?v

We can see that the primary shard of the index ended up on quickstart-es-data-nodes-0. We designated that our data nodes should be warm, so everything went according to plan. We also notice that the replica is UNASSIGNED, but that’s normal here. Elasticsearch wants to place it on another warm node, but we have only one available in our setup. However, in a configuration with multiple warm nodes, this would need to be properly assigned.
Now let’s check the same thing for the “logs-02” index:
curl -u elastic:$PASSWORD -XGET -k https://localhost:31920/_cat/shards/logs-02?v

Great, we can see that the primary shard was properly assigned to the master node, which is configured as hot.
The demand put on our Elasticsearch cluster will normally fluctuate. During certain periods, it could be hit by a higher than usual amount of requests and the amount of nodes at that time may be unable to respond quickly enough.
To handle such spikes in requests, we could increase the number of nodes, otherwise known as “scaling-up”.
Kubernetes can take care of putting these nodes on different physical servers, so that they can all work in parallel and respond to requests more efficiently.
Let’s say we’d want to increase the number of data nodes in our Elasticsearch cluster. All we would need to do in this scenario, is increase the count parameter in our YAML file, from 1, to a higher number.
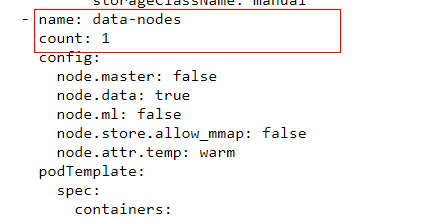
Let’s test this out, by applying the following YAML configuration, which is identical to the previous “08-multinode-es.yaml” we used, except this time, we’re configuring it as “count: 2” for the data-nodes and master-nodes nodesets:=
kubectl apply -f https://raw.githubusercontent.com/coralogix-resources/elastic-cloud-on-kubernetes-webinar/master/09-multinode-es-with-2-data-nodes.yaml
Now, let’s check out the pods:
kubectl get pods
We will see two extra pods pop up, called quickstart-es-data-nodes-1 and quickstart-es-master-nodes-1.
It’s worth mentioning that since we used ReadWriteOnce with our persistent volumes, these are exclusively claimed by the previous two pods. This means there aren’t any other PVs available, so the new pods won’t start and will remain in a “Pending” state. Once the administrator creates new persistent volumes, the pods can claim them and start running.
Also, in our case, the pods won’t be able to start since we don’t have enough CPU and memory resources available in our Kubernetes cluster. We can explore why a pod is stuck in a Pending state with a command such as:
kubectl describe pods quickstart-es-data-nodes-1
As with any software, new versions of Elasticsearch are released and made available to the public. These may include performance improvements, bug fixes, and security patches. It’s natural that we’d want to periodically upgrade to stay up-to-date.
In our case, Kubernetes will use the Elasticsearch operator to take care of the necessary steps to upgrade software across nodes.
Up to this point, we’ve used Elasticsearch version 7.6.2. We can check the current version number with this request:
curl -u elastic:$PASSWORD -k https://localhost:31920
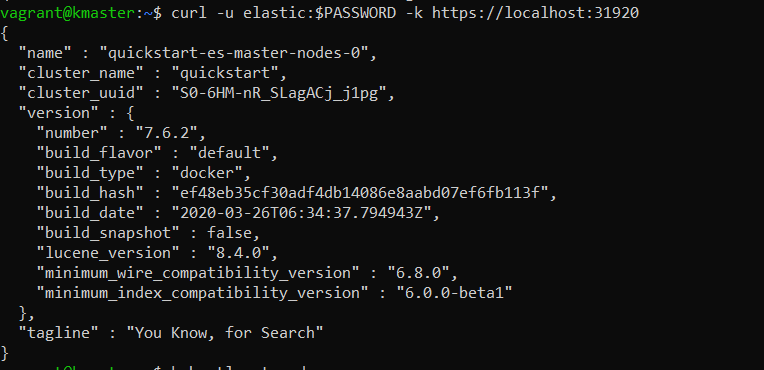
Let’s upgrade Elasticsearch to version 7.7.0 by simply applying a new YAML specification that contains the line “version: 7.7.0” under “spec:“
kubectl apply -f https://raw.githubusercontent.com/coralogix-resources/elastic-cloud-on-kubernetes-webinar/master/10-multinode-es-upgrade-to-7.7.0.yaml

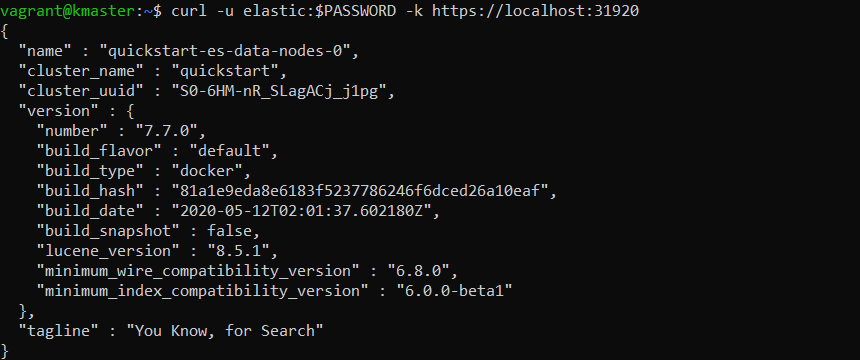
We’ll wait until the upgrade process completes. Then, we can check for the version number again:
curl -u elastic:$PASSWORD -k https://localhost:31920
If you still notice the old version, wait a few more minutes and try the command again.
It’s important to note that in a “live” production cluster that’s receiving data and serving requests, you should take appropriate measures before doing an upgrade. Always ensure to first snapshot the data, create backups, stop indexing new data to the cluster, or index to two clusters simultaneously – whatever’s necessary to ensure a smooth process.
I hope you’ve found this series helpful to get started running ELK on Kubernetes.

It is commonplace for organizations to restrict their IT systems from having direct or unsolicited access to external networks or the Internet, with network proxies serving…

What is AWS Systems Manager Before we jump into this, it’s important to note that older names, and still in use in some areas of AWS,…

Infrastructure as Code is an increasingly popular DevOps paradigm. IaC has the ability to abstract away the details of server provisioning. This tutorial will look at…
