
What Is a Log Agent and Why It Matters, Plus Examples
This article was last updated on June 28, 2023. If you’ve been investigating log monitoring lately, you’ve probably heard of logging agents like Logstash or Fluent…

Logging in Spring Boot can be confusing, and the wide range of tools and frameworks make it a challenge to even know where to start. This guide talks through the most common Spring Boot log monitoring best practices and gives five key suggestions to add to your logging tool kit.
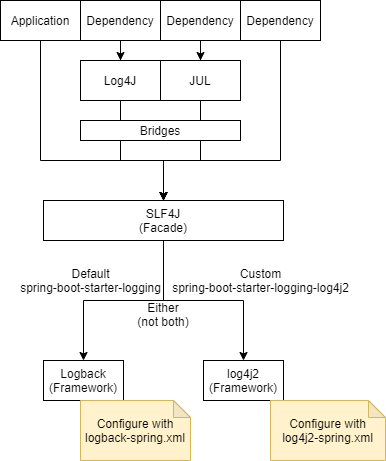
The Spring Boot Starters all depend on spring-boot-starter-logging. This is where the majority of the logging dependencies for your application come from. The dependencies involve a facade (SLF4J) and frameworks (Logback). It’s important to know what these are and how they fit together.
SLF4J is a simple front-facing facade supported by several logging frameworks. It’s main advantage is that you can easily switch from one logging framework to another. In our case, we can easily switch our logging from Logback to Log4j, Log4j2 or JUL.
The dependencies we use will also write logs. For example, Hibernate uses SLF4J, which fits perfectly as we have that available. However, the AWS SDK for Java uses Apache Commons Logging (JCL). Spring-boot-starter-logging includes the necessary bridges to ensure those logs are delegated to our logging framework out of the box.

private static final Logger LOG = LoggerFactory.getLogger(MyClass.class);
2 – Writing some logs:
LOG.info("My message set at info level");
Spring Boot’s default logging framework is Logback. Your application code should interface only with the SLF4J facade so that it’s easy to switch to an alternative framework if necessary.
Log4j2 is newer and claims to improve on the performance of Logback. Log4j2 also supports a wide range of appenders so it can log to files, HTTP, databases, Cassandra, Kafka, as well as supporting asynchronous loggers. If logging performance is of high importance, switching to log4j2 may improve your metrics. Otherwise, for simplicity, you may want to stick with the default Logback implementation.
This guide will provide configuration examples for both frameworks.
Want to use log4j2? You’ll need to exclude spring-boot-starter-logging and include spring-boot-starter-logging-log4j2.
With your initial set up out of the way, here are 5 top tips for spring boot logging.
Spring Boot Logging provides default configurations for logback and log4j2. These specify the logging level, the appenders (where to log) and the format of the log messages.
For all but a few specific packages, the default log level is set to INFO, and by default, the only appender used is the Console Appender, so logs will be directed only to the console.
The default format for the logs using logback looks like this:

Let’s take a look at that last line of log, which was a statement created from within a controller with the message “My message set at info level”.
It looks simple, yet the default log pattern for logback seems “off” at first glance. As much as it looks like it could be, it’s not regex, it doesn’t parse email addresses, and actually, when we break it down it’s not so bad.
%clr(%d{${LOG_DATEFORMAT_PATTERN:-yyyy-MM-dd HH:mm:ss.SSS}}){faint}
%clr(${LOG_LEVEL_PATTERN:-%5p}) %clr(${PID:- }){magenta} %clr(---){faint}
%clr([%15.15t]){faint} %clr(%-40.40logger{39}){cyan} %clr(:){faint}
%m%n${LOG_EXCEPTION_CONVERSION_WORD:-%wEx}
The variables that are available for the log format allow you to create meaningful logs, so let’s look a bit deeper at the ones in the default log pattern example.
| Pattern Part | What It Means |
|---|---|
| %clr | %clr specifies a colour. By default, it is based on log levels, e.g, INFO is green. If you want to specify specific colours, you can do that too. |
| %d{${LOG_DATEFORMAT_PATTERN:-yyyy-MM-dd HH:mm:ss.SSS}} | %d is the current date, and the part in curly braces is the format. ${VARIABLE}:-default is a way of specifying that we should use the $VARIABLE environment variable for the format, if it is available, and if not, fall back to default. This is handy if you want to override these values in your properties files, by providing arguments, or by setting environment variables. |
| ${LOG_LEVEL_PATTERN:-%5p} | Uses the LOG_LEVEL_PATTERN if it is defined, else will print the log level with right padding up to 5 characters (E.g “INFO” becomes “INFO “ but “TRACE” will not have the trailing space). This keeps the rest of the log aligned as it’ll always be 5 characters. |
| ${PID:- } | The environment variable $PID, if it exists. If not, space. |
| t | The name of the thread triggering the log message. |
| logger | The name of the logger (up to 39 characters), in our case this is the class name. |
| %m | The log message. |
| %n | The platform-specific line separator. |
| %wEx | If one exists, wEx is the stack trace of any exception, formatted using Spring Boot’s ExtendedWhitespaceThrowableProxyConverter. |
You can customise the ${} variables that are found in the logback-spring.xml by passing in properties or environment variables. For example, you may set logging.pattern.console to override the whole of the console log pattern.
However, for more control, including adding additional appenders, it is recommended to create your logback-spring.xml and place it inside your resources folder. You can do the same with log4j2 by adding log4j2-spring.xml to your resources folder.
Armed with the ability to customise your logs, you should consider adding:
There are a few items in the default log that I would remove unless you have a specific use case for them:
With the ability to customise these through the use of the logback-spring.xml or log4j2-spring.xml, the format of your logs is fully within your control.
An appender is just a fancy name for the part of the logging framework that sends your logs to a particular target. Both frameworks can output to console, over HTTP, to databases, or over a TCP socket, as well as to many other targets. The way we configure the destination for the logs is by adding, removing and configuring these appenders.
You have more control over which appenders you use, and the configuration of them, if you create your own custom .xml configuration. However, the default logging configuration does make use of environment properties that allow you to override some parts of it, for example, the date format.
Preset configuration for logging to files are available within Spring Boot Logging. You can use the logback configuration with a file appender or the log4j2 configuration with a file appender if you specify logging.file or logging.path in your application properties.
The official docs for logback appenders and log4j2 appenders detail the parameters required for each of the appenders available, and how to configure them in your XML file. One tip for choosing the destination for your logs is to have a plan for rotating them. Writing logs to a file always feels like a great idea, until the storage used for that file runs out and brings down the whole service.
Log4j and logback both have a RollingFileAppender which handles rotating these log files based on file size, or time, and it’s exactly that which Spring Boot Logging uses if you set the logging.file property.
You might want to log every HTTP request your API receives. That’s a fairly normal requirement, but putting a log statement into every controller is unnecessary duplication. It’s easy to forget and make mistakes. A requirement that you want to log every method within your packages that your application calls would be even more cumbersome.
I’ve seen developers use this style of logging at trace level so that they can turn it on to see exactly what is happening in a production environment. Adding log statements to the start and end of every method is messy, and there is a better way. This is where filters and aspects save the day and avoid the code duplication.
If you are looking to create log statements related to specific requests, you should opt for using filters, as they are part of the handling chain that your application already goes through for each request. They are easier to write, easier to test and usually more performant than using aspects. If you are considering more cross-cutting concerns, for example, audit logging, or logging every method that causes an exception to be thrown, use AOP.
Filters can be registered with your web container by creating a class implementing javax.servlet.Filter and annotating it with @Component, or adding it as an @Bean in one of your configuration classes. When your spring-boot-starter application starts up, it will create the Filter and register it with the container.
You can choose to create your own Filter, or to use an existing one. To make use of the existing Filter, you need to supply a CommonsRequestLoggingFilter bean and set your logging level to debug. You’ll get something that looks like:
2020-10-27 18:50:50.427 DEBUG 24168 --- [nio-8080-exec-2] o.a.coyote.http11.Http11InputBuffer      : Received [GET /health HTTP/1.1
tracking-header: my-tracking
User-Agent: PostmanRuntime/7.26.5
Accept: */*
Postman-Token: 04a661b7-209c-43c3-83ea-e09466cf3d92
Host: localhost:8080
Accept-Encoding: gzip, deflate, br
Connection: keep-alive
]
If you use the existing one, you have little control over the message that gets logged.
If you want more control, create your own Filter using this example, and you then have full control over the content of the log message.
Aspect-oriented programming enables you to fulfill cross-cutting concerns, like logging for example, in one place. You can do this without your logging code needing to sprawl across every class.
This approach is great for use cases such as:
Let’s start with a simple example – we want to log the name of every public method that we call within our package, com.example.demo. There are only a few steps to writing an Aspect that will run before every public method in a package that you specify.
That’s all there is to logging every method call. The logs will appear as:
2020-10-27 19:26:33.269  INFO 2052 --- [nio-8080-exec-2]
com.example.demo.MyAspect                : Called checkHealth
By making changes to your pointcut, you can write logs for every method annotated with a specific annotation. For example, consider what you can do with:
@annotation(com.example.demo.Audit)
(This would run for every method annotated with a custom annotation, @Audit).
MDC (Mapped Diagnostic Context) is a complex-sounding name for a map of key-value pairs, associated with a single thread. Each thread has its own map. You can add keys/values to the map at runtime, and then reference the keys from that map in your logging pattern.
The approach comes with a warning that threads may be reused, and so you’ll need to make sure to clear your MDC after each request to avoid your context leaking from one request to the next.
MDC is accessible through SLF4J and supported by both Logback and Log4j2, so we don’t need to worry about the specifics of the underlying implementation.
The MDC section in the SLF4J documentation gives the simplest examples.
Want to be able to group logs for a specific request? The Mapped Diagnostic Context (MDC) will help.
The steps are:
Using a Filter, this is how you can read values from the request and set them on the MDC. Make sure to clear up after the request by calling MDC.clear(), preferably in a finally block so that it always runs.
After setting the value on your MDC, just add %X{tracking} to your logging pattern (Replacing the word “tracking” with the key you have put in MDC) and your logs will contain the value in every log message for that request.
If a client reports a problem, as long as you can get a unique tracking-id from your client, then you’ll be able to search your logs and pull up every log statement generated from that specific request.
Other use cases that you may want to put into your MDC and include on every log message include:
You can unit test your logging code. Too often this is overlooked because the log statements return void. For example, logger.info(“foo”); does not return a value that you can assert against.
It’s easy to make mistakes. Log statements usually involve parameters or formatted strings, and it’s easy to put log statements in the wrong place. Unit testing reassures you that your logs do what you expect and that you’re covered when refactoring to avoid any accidental modifications to your logging behaviour.
SLF4J’s LoggerFactory.getLogger is static, making it difficult to mock. Searching through any outputted log files in our unit tests is error-prone (E.g we need to consider resetting the log files between each unit test). How do we assert against the logs?
The trick is to add your own test appender to the logging framework (e.g Logback or Log4j2) that captures the logs from your application in memory, allowing us to assert against the output later. The steps are:
Each logging framework has suitable appenders, but referencing those concrete appenders in our tests means we need to depend on the specific framework rather than SLF4J. That’s not ideal, but the alternatives of searching through logged output in files, or implementing our own SLF4J implementation is overkill, making this the pragmatic choice.
Here are a couple of tricks for unit testing using JUnit 4 rules or JUnit 5 extensions that will keep your test classes clean, and reduce the coupling with the logging framework.
JUnit 5 extensions help to avoid code duplicates between your tests. Here’s how to set up your logging tests in two steps:
Step 1: Create your JUnit extension
Create your extension for Logback
Create your extension for Log4j2
Step 2: Use that rule to assert against your log statement with logback or log4j2
JUnit 4 rules help to avoid code duplication by extracting the common test code away from the test classes. In our example, we don’t want to duplicate the code for adding a test appender to our logger in every test class.
Step 1: Create your JUnit rule.
Step 2: Use that rule to assert against your log statements using logback or log4j2.
With these approaches, you can assert that your log statements have been called with a message and level that you expect.
The Spring Boot Logging Starter provides everything you need to quickly get started, whilst allowing full control when you need it. We’ve looked at how most logging concerns (formatting, destinations, cross-cutting logging, context and unit tests) can be abstracted away from your core application code.
Any global changes to your logging can be done in one place, and the classes for the rest of your application don’t need to change. At the same time, unit tests for your log statements provide you with reassurance that your log statements are being fired after making any alterations to your business logic.
These are my top 5 tips for configuring Spring Boot Logging. However, when your logging configuration is set up, remember that your logs are only ever as good as the content you put in them. Be mindful of the content you are logging, and make sure you are using the right logging levels.

This article was last updated on June 28, 2023. If you’ve been investigating log monitoring lately, you’ve probably heard of logging agents like Logstash or Fluent…

The Internet of Things (IoT) has quickly become a huge part of how people live, communicate and do business. All kinds of everyday things make up…

Whether it’s Apache, Nginx, ILS, or anything else, web servers are at the core of online services, and web log monitoring and analysis can reveal a…
