During our research here at Coralogix, we discovered the growing need and awareness of Log Analytics as companies strive to control their log data and monitor their application and server logs.
One of the markets which made the most out of Log Analytics is the E-commerce application market. E-commerce is extremely dependent on the completeness of their transactions. They must analyze data from various sources to optimize their user experience, understand their customer behavior, and most importantly, make sure their stores are functioning at 100% as each and every broken transaction or link can result in immediate money loss.
Each user action needs to be monitored at several levels in order to achieve the required coverage.
- Web server logs: The requests and responses from/to web servers (Apache etc.). Monitoring the web server logs allows the ability to understand the latency of the responses to the client requests, as long latencies are a known cause of user bounce. This monitoring can be achieved by creating statistic models on the response times the web server returns to understand their patterns and identifying abnormal behavior or poor performance of servers.
- Performance logs: These logs can provide a sense of the application’s efficiency and performance. By monitoring the machine CPU, thread count, handle count, and memory usage, one can evaluate whether the system is suffering from low performance which might require a hardware upgrade or a software performance enhancement. These parameters are very easy to monitor and comprehend, we found them extremely valuable in identifying problems before they take place and preventing them.
- HTTP errors: There are many possible HTTP errors. The first thing to be done is to aggregate these errors and find out how many types of different error there are (and how many times each type appear). The second step would be to drill deeper into the errors and determine what requests cause them.
A few common HTTP error types:
- 400 Bad Request – usually returned by the web server after it receives an invalid request – can indicate problems with the links on your website
- 404 Not Found – Returned by the web server in case it got a request for a non-existing URL, 404 does not necessarily mean you have a problem because there is a possibility the user actually browsed to a non-existing URL. To understand If there is a real problem you can either compare the request itself to similar requests on this URL or try browsing that URL yourself and verify if it exists
- 408 Request Timeout – Returned by the server in case the client did not produce the request in the defined timeframe, aggregate these errors and verify how many of them you have, too many might indicate a problem on your web server
- 500 Internal server error – The Web server encountered an unexpected condition that prevented it from fulfilling the request by the client. This is a ‘catch-all’ error generated by the Web server. Basically, something has gone wrong, but the server can not be more specific about the error condition in its response to the client.
- Application logs: The logs that were inserted by the developer in order to track the software behavior. The more detailed these logs are the more value they produce. Application logs can reflect the actual patterns of your system and analyze them can help identify software problems that cause major money losses you are not even aware of.
Via the above information, one could measure the key parameters of an e-commerce application
- Your download timing: how much time it takes your web server to download a web page to your client. This is extremely important as customers these days tend to be very impatient to loading times and bounce very fast
- Application response time: how much time does it take your server to respond to user actions, once again, high response time results in customer attrition and high bounce rates.
- Last visited pages: What are the pages that are often the last visited before users leave your store? This can be a good indication that these pages need to be optimized.
- Your peak times: Know what are the days and hours in which your store is most active. This can assist you in scheduling promotions, preparing to handle a large amount of traffic or managing your support center.
There are many Log Analytics solutions out there that can handle such data sources and offer parsing and graphic tools, however, the problem with these tools is that they require the e-commerce owner to invest a lot of his valuable time in investigations and analysis instead of focusing on his main business which is selling and supplying.
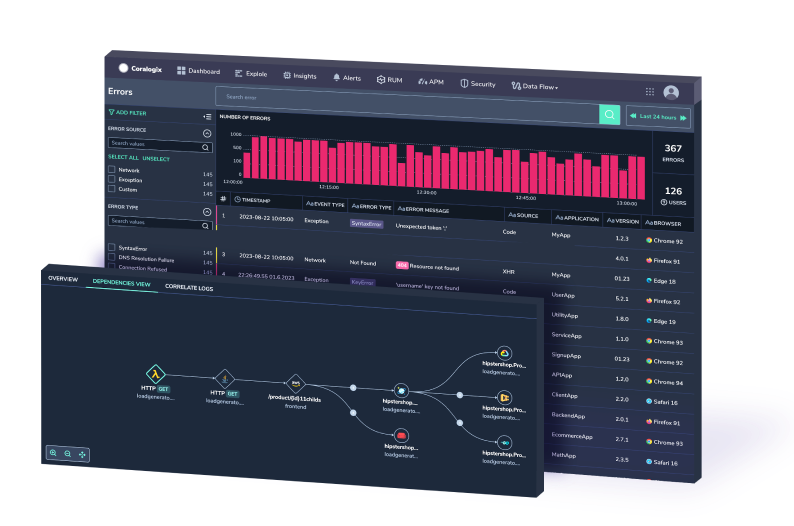
Coralogix combines methods from the worlds of cyber and intelligence to create the world’s first Actionable Log Analytics solution, with a unique algorithm that automatically detects problems on any software, presents them in one simple view, and offers their root cause in a single click. Hit the “Request a demo” button above and join a global movement that is shifting towards actionable and meaningful results in the world of Log Analytics.
