
More Changes Mean More Challenges for Troubleshooting
The widespread adoption of Agile methodologies in recent years has allowed organizations to significantly increase their ability to push out more high quality software. The new…

Elasticsearch is a complex piece of software by itself, but complexity is further increased when you spin up multiple instances to form a cluster. This complexity comes with the risk of things going wrong. In this lesson, we’re going to explore some common Elasticsearch problems that you’re likely to encounter on your Elasticsearch journey. There are plenty more potential issues than we can squeeze into this lesson, so let’s focus on the most prevalent ones mainly related to a node setup, a cluster formation, and the cluster state.
The potential Elasticsearch issues can be categorized according to the following Elasticsearch lifecycle.
Node Setup
Potential issues include the installation and initial start-up. The issues can differ significantly depending on how you run your cluster like whether it’s a local installation, running on containers or a cloud service, etc.). In this lesson, we’ll follow the process of a local setup and focus specifically on bootstrap checks which are very important when starting a node up.
Discovery and Cluster Formation
This category covers issues related to the discovery process when the nodes need to communicate with each other to establish a cluster relationship. This may involve problems during initial bootstrapping of the cluster, nodes not joining the cluster and problems with master elections.
Indexing Data and Sharding
This includes issues related to index settings and mapping but as this is covered in other lectures we’ll just touch upon how sharding issues are reflected in the cluster state.
Search
Search is the ultimate step of the setup journey can raise issues related to queries that return less relevant results or issues related to search performance. This topic is covered in another lecture in this course.
Now that we have some initial background of potential Elasticsearch problems, let’s go one by one using a practical approach. We’ll expose the pitfalls and show how to overcome them.
Before we start messing up our cluster to simulate real-world issues, let’s backup our existing indices. This will have two benefits:
First, we need to setup our repository.
Open your main config file:
sudo vim /etc/elasticsearch/elasticsearch.yml
And make sure you have a registered repository path on your machine:
path.repo: ["/home/student/backups"]
And then let’s go ahead and save it:
:wq
Note: you can save your config file now to be able to get back to it at the end of this lesson.
Next make sure that the directory exists and Elasticsearch will be able to write to it:
mkdir -p /home/student/backups
chgrp elasticsearch /home/student/backups
chmod g+w /home/student/backups/
Now we can register the new repository to Elasticsearch at this path:
curl --request PUT localhost:9200/_snapshot/backup-repo \
--header "Content-Type: application/json" \
--data-raw '{
"type": "fs",
"settings": {
      "location": "/home/student/backups/backup-repo"
  }
}'
Finally we can initiate the snapshot process to backup.
curl --request PUT localhost:9200/_snapshot/backup-repo/snapshot-1
You can check the status of the procedure with a simple GET request:
curl --request GET localhost:9200/_snapshot/backup-repo/snapshot-1?pretty
We should see the success state:
![]()
Very good! Now that we have our data backed up and now we can nuke our cluster 🙂
Ok, now we can get started. Let’s recap on the basics. We’ll start by looking at the Elasticsearch logs.
Their location depends on your path.logs setting in elasticsearch.yml. By default, they are found in /var/log/elasticsearch/your-cluster-name.log.
Basic tailing commands may come in handy to monitor logs in realtime:
tail -n 100 /var/log/elasticsearch/lecture-cluster.log
tail -n 500 /var/log/elasticsearch/lecture-cluster.log | grep ERROR
Note: sometimes it’s also useful to Grep a few surrounding log lines (with the context parameter) as the messages and stack traces can be multiline:
cat lecture-cluster.log | grep Bootstrap --context=3
But right away… we hit the first problem! Insufficient rights to actually read the logs:
tail: cannot open '/var/log/elasticsearch/lecture-cluster.log' for reading: Permission denied
There are various options to solve this. For example, a valid group assignment of your linux user or one generally simpler approach is to provide the user sudo permission to run shell as the elasticsearch user.
You can do so by editing the sudoers file (visudo with root) and adding the following line”
username ALL=(elasticsearch) NOPASSWD: ALL
Afterwards you can run the following command to launch a new shell as the elasticsearch user:
sudo -su elasticsearch
Bootstrap checks are preflight validations performed during a node start which ensure that your node can reasonably perform its functions. There are two modes which determine the execution of bootstrap checks:
Let’s see them in action because when the checks don’t pass, it can become tedious work to find out what’s going on.
One of the first system settings recommended by Elastic is to disable heap swapping. This makes sense, since Elasticsearch is highly memory intensive and you don’t want to load your “memory data” from disk.
There are two options according to the docs:
Let’s try the second option. Open your main configuration file and insert this parameter:
vim /etc/elasticsearch/elasticsearch.yml

bootstrap.memory_lock: true
Now start your service:
sudo systemctl start elasticsearch.service
After a short wait for the start of the node you’ll see the following message:

When you check your logs you will find that the “memory is not locked”
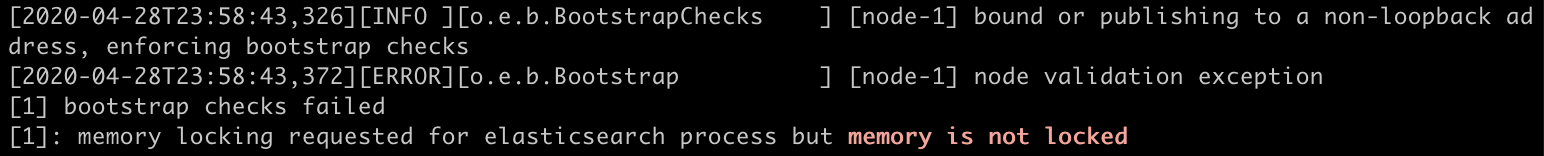
But didn’t we just lock it before? Not really. We just requested the lock, but it didn’t actually get locked so we hit the memory lock bootstrap check.
The easy way in our case is to allow locking and override into our systemd unit-file resp. like this:
sudo systemctl edit elasticsearch.service
Let’s put the following config parameter:
[Service]
LimitMEMLOCK=infinity
Now when you start you should be ok:
sudo systemctl start elasticsearch.service
You can stop your node afterwards, as we’ll continue to use it for this lesson.
If you start playing with the JVM settings in the jvm.options file, which you likely will need to do because by default, these settings are set too low for actual production usage, you may face a similar problem as above. How’s that? By setting the initial heap size lower than the max size, which is actually quite usual in the world of Java.
Let’s open the options file and lower the initial heap size to see what’s going to happen:
vim /etc/elasticsearch/jvm.options
# Xms represents the initial size of total heap space
# Xmx represents the maximum size of total heap space

-Xms500m
-Xmx1g
Go ahead and start your service and you’ll find another fail message as we hit the heap size check. The Elasticsearch logs confirm this:

Generally speaking, this problem is also related to memory locking where the need to increase the heap size during program operations may have undesired consequences.
So remember to set these numbers to:
There are many other bootstrap checks on the runtime platform and its settings including a file descriptors check, a maximum number of threads check, a maximum size virtual memory check and many others. You should definitely browse through their descriptions in the docs. But as we’re running the official Debian distribution that comes with a predefined systemd unit-file most of these issues are resolved for us in the unit-file, among others.
Check the unit file to see the individual parameters that get configured:
cat /usr/lib/systemd/system/elasticsearch.service
Remember that if you run the Elasticsearch binary “on your own”, you will need to take care of these as well.
The last check we’ll run is one that will carry us nicely to the next section of the lesson dealing with clustering. But before we dive in let’s see what are the configuration parameters that Elasticsearch checks during its start up with a discovery configuration check.
There are three key parameters which govern the cluster formation and discovery process:
But what if you don’t want to form any cluster, but rather to run in a small single node setup. You just omit these in the elasticsearch.yml, right?
# --------------------------------- Discovery ----------------------------------
#discovery.seed_hosts: ["127.0.0.1"]
#cluster.initial_master_nodes: ["node-1"]
Nope, that won’t work. After starting up you will hit another bootstrap error, since at least one of these parameters needs to be set to pass this bootstrap check:

Let’s see why this is and dive deeper into troubleshooting the discovery process.
After we have successfully passed the bootstrap checks and started up our node for the first time, the next phase in its lifecycle is the discovery process.
Note: If you need more background on clustering, read through the discovery docs.
To simulate the formation of a brand new cluster we will need a “clean” node. We need to remove all data of the node and thus also lose any previous cluster state information. Remember this is really just to experiment. In a real production setup there would be very few reasons to do this:
rm -rf /var/lib/elasticsearch/*
Now let’s imagine a situation where we already have a cluster and just want the node to join in. So we need to make sure that:
vim /etc/elasticsearch/elasticsearch.yml
# put in following parameter:
cluster.name: lecture-cluster
discovery.seed_hosts: ["127.0.0.1:9301"]
Note: This is just a demonstration, so we just used the loopback address. Normally you would put a hostname (or ip) here and the actual transport port of one or more nodes in your cluster.
Filling this parameter also means compliance to the previously described bootstrap check so the node start should happen without any problem.
sudo systemctl start elasticsearch.service
To confirm that our node is successfully running we can hit the root endpoint (“/”):
curl localhost:9200/
And indeed we get a nice response with various details:

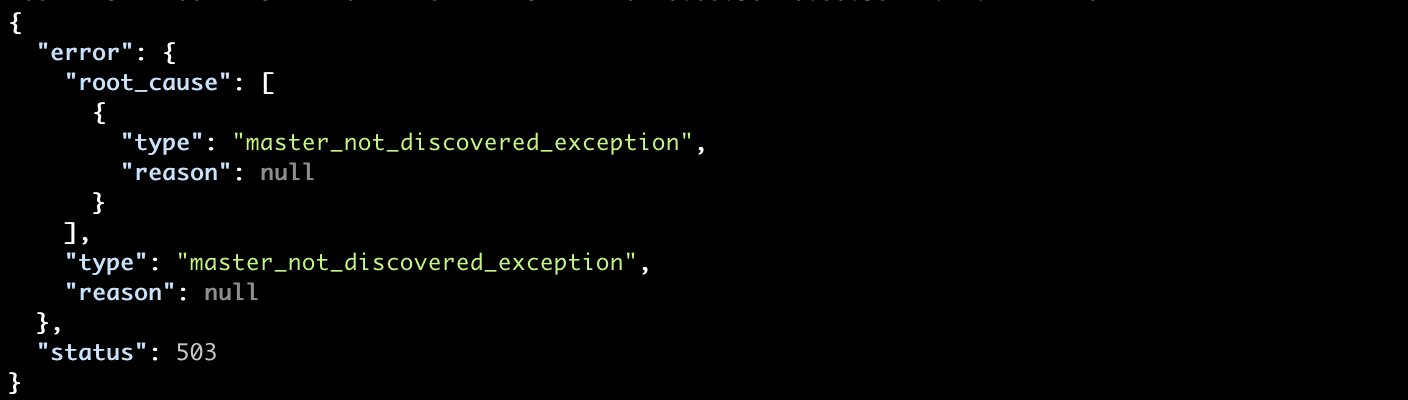
But something is missing… the cluster_uuid. This means that our cluster is not formed. We can confirm this by checking the cluster state with the _cluster/health API:
curl localhost:9200/_cluster/health
After 30 seconds of waiting, we get the following exception:
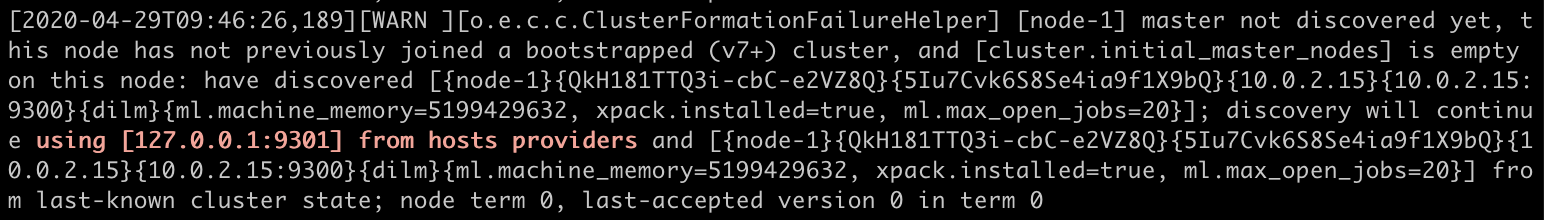
Finally, let’s tail our logs to see that the node has not discovered any master and will continue the discovery process:
The issues mentioned can be very similar when forming a new cluster. We can simulate this in our environment with the cluster.initial_master_nodes settings. Again make sure that there is no previous data on your node (/var/lib/elasticsearch):
vim /etc/elasticsearch/elasticsearch.yml
# put in following parameters:
cluster.name: lecture-cluster
cluster.initial_master_nodes: ["node-1", "node-2", "node-3"]
You can start up by trying the previous requests.
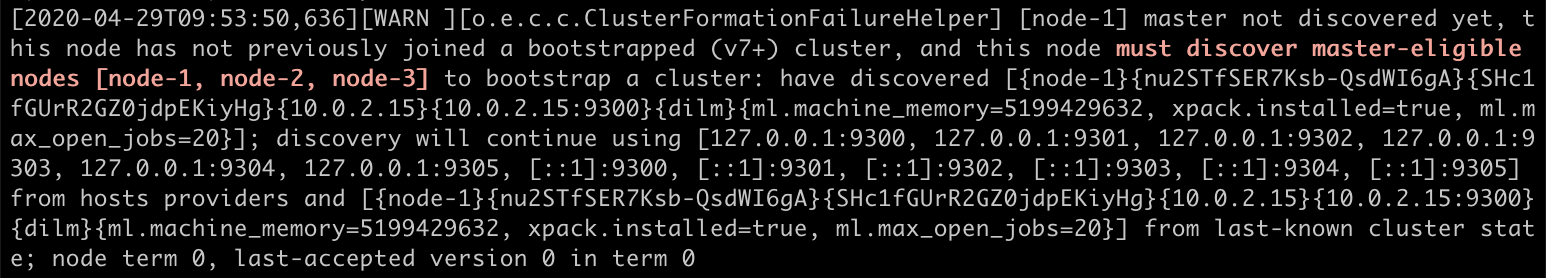
In the logs, we see that node-1 is trying unsuccessfully to discover the second and third node to perform the elections to bootstrap the cluster:
We performed some experiments so you’ll need to use your imagination to complete the picture. In a real “production” scenario there are many reasons why this problem often appears. Since we’re dealing with a distributed system, many external factors such as network communication come to play and may cause the nodes to be unable to reach each other.
To resolve these issues, you’ll need to triple check the following:
The last thing we are going to explore is the relationship between the shard allocation and cluster state, as these two are tightly related.
But first, we need to change the elasticsearch.yml configuration to let our node successfully form a single node cluster. Open the main configuration file and set the initial master as the node itself and then start the service:
vim /etc/elasticsearch/elasticsearch.yml
# --------------------------------- Discovery ----------------------------------
cluster.initial_master_nodes: ["node-1"]
If you again query the _cluster/health API:
curl localhost:9200/_cluster/health
You should see the cluster status in green:

So what does cluster status mean? It actually reflects the worst state of any of the indices we have in our cluster. The different options include:
So now let’s create an index with one primary shard and one replica:
curl --request PUT localhost:9200/test \
--header "Content-Type: application/json" \
--data-raw '{
 "settings": {
       "number_of_shards": 1,
       "number_of_replicas": 1
   }
}'
Suddenly our cluster turns yellow as our worst performing index (the only one we have) is also yellow.
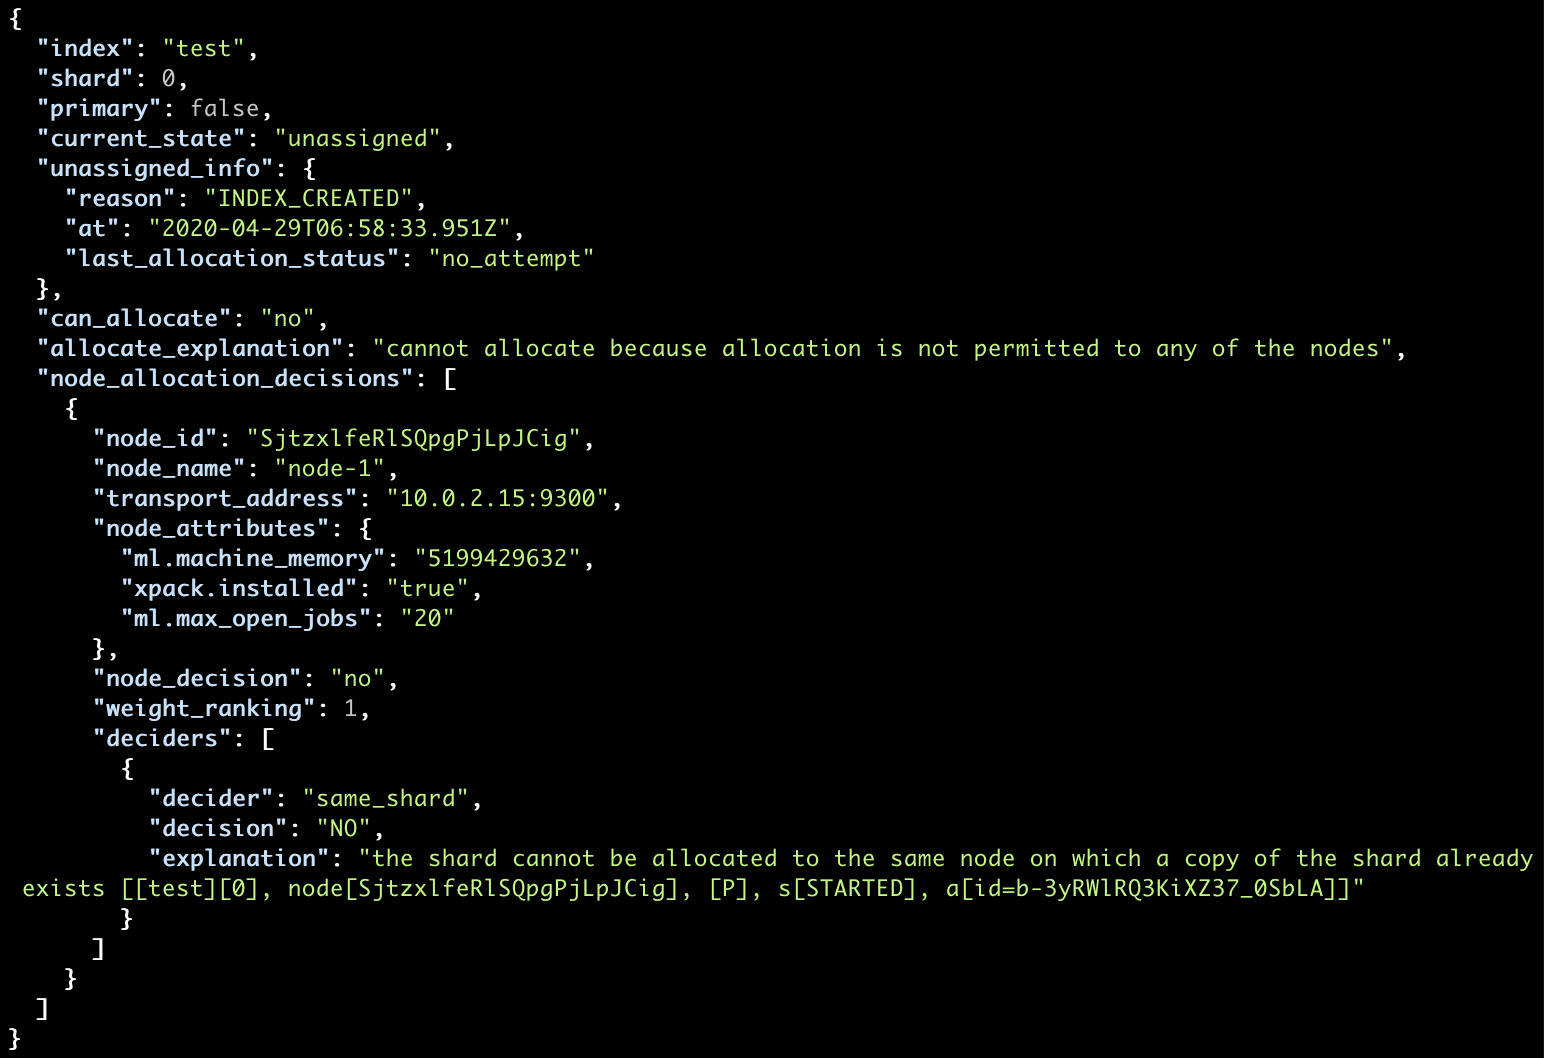
You can check the shards assignment with the _cat/shards API and see one UNASSIGNED shard:
curl localhost:9200/_cat/shards?v
Or, if you want more descriptive information, you can use the _cluster/allocation/explain API which provides an explanation as to why the individual shards were not allocated:
curl localhost:9200/_cluster/allocation/explain?pretty
In our case, as mentioned before, the reason is due to the allocation of the data replica to the same node being disallowed, since it makes no sense from a resiliency perspective.
So how to resolve it? We have two options.
Note: we won’t repeat the local multi-node cluster configuration steps here, so review the lessons where we do so. Generally, we need a separate systemd unit file with a separate configuration.
We can review the main configuration file of our second node to ensure that it will join the same cluster with our existing node. A loopback address will be used as the seed host:
vim /etc/elasticsearch-node-2/elasticsearch.yml

# make sure it also consist of following two params
cluster.name: lecture-cluster
# --------------------------------- Discovery ----------------------------------
discovery.seed_hosts: ["127.0.0.1"]
Now we can start our second node:
systemctl start elasticsearch-node-2.service
Very short after, if we query the cluster health we’ll see that the cluster status is now green:
curl --silent localhost:9200/_cluster/health?pretty | grep status
We’ve resolved our issue, since the replica shards were automatically reallocated.
![]()
Perfect!
Let’s continue with this example to simulate the red cluster status. Start by removing the index and creating it again, but this time with only 2 primary shards and no replica. You will quickly see why this is a bad idea:
curl --request DELETE localhost:9200/test
curl --request PUT localhost:9200/test \
--header "Content-Type: application/json" \
--data-raw '{
 "settings": {
       "number_of_shards": 2,
       "number_of_replicas": 0
   }
}'
Now let’s check the shards assignment:
curl localhost:9200/_cat/shards?v
We can see that each primary shard is on a different node, which follows the standard allocation rules set at the cluster level and index level.

You likely know where we are heading. Imagine the situation where some network issue emerges and your cluster “splits” up resulting in disabled node communication. Or, worse, when some disks malfunction it leads to improper functioning of the node.
The easy way we can simulate this is to stop one of our nodes:
systemctl stop elasticsearch-node-2.service
Our cluster turns immediately to the worst of possible colors:
![]()
And if you now check the explain API:
curl localhost:9200/_cluster/allocation/explain?pretty
You will have the reason well-described:
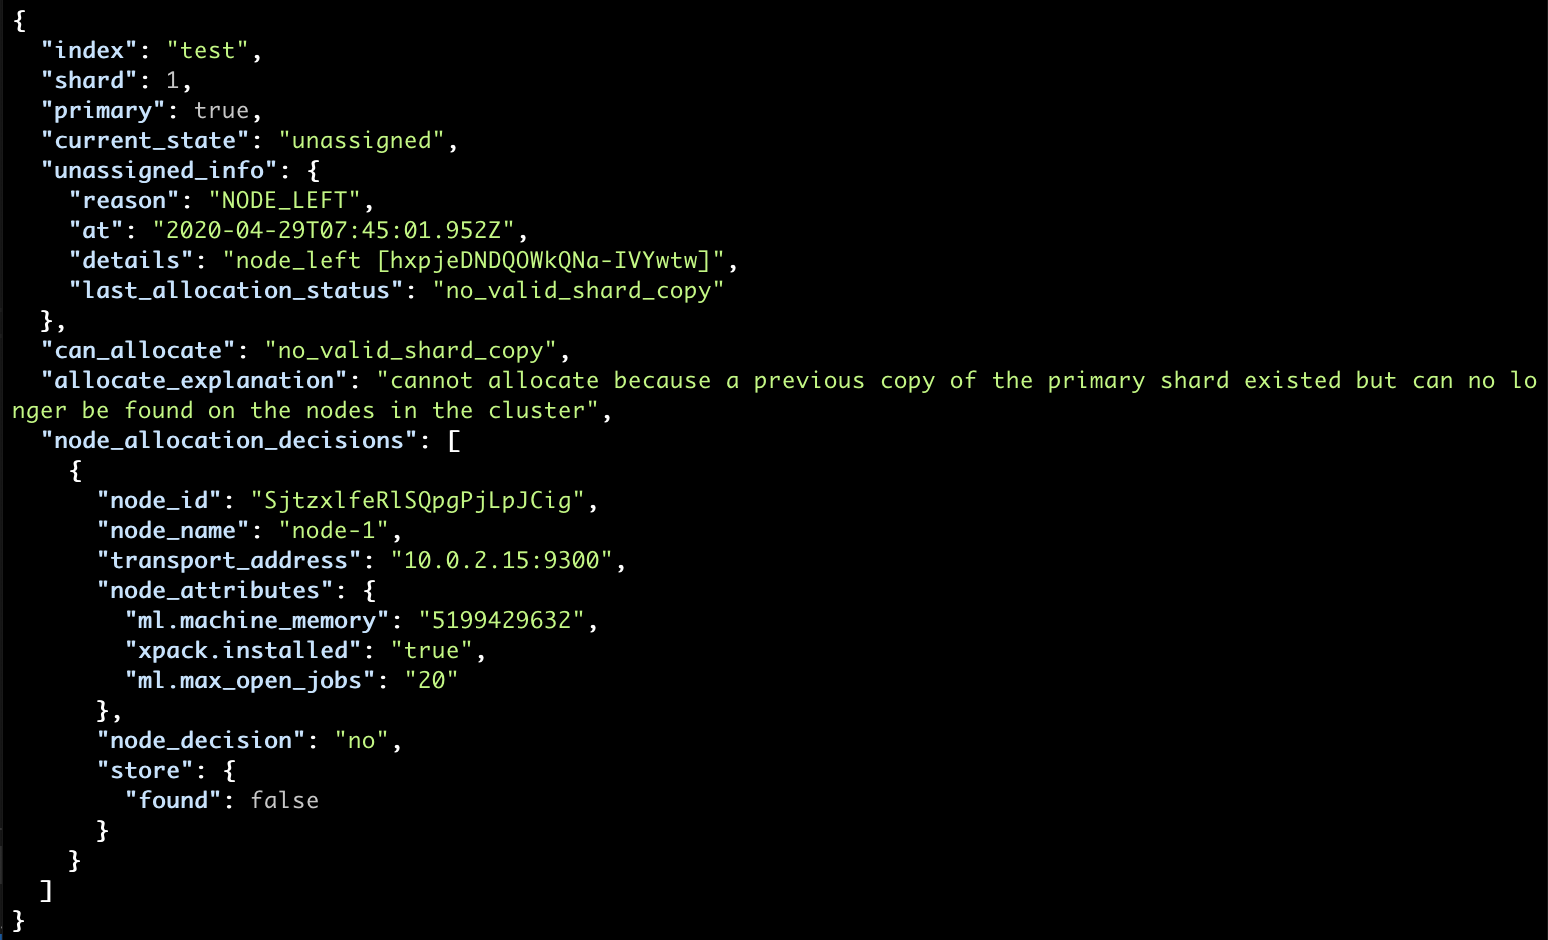
Unfortunately, there is no easy solution to this scenario, as we do not have any replicas and there is no way we could “remake” our data.
Firstly, if you are dealing with some network problems, try to thoroughly inspect what could go wrong, like misconfiguration of firewalls for example, and inspect it as a priority, since data cannot consistently be indexed in this state.
Depending on the document routing, many indexing requests can be pointed towards the missing shard and end up timing out:
curl --request POST localhost:9200/test/_doc \
--header "Content-Type: application/json" \
--data-raw '{ "message": "data" }'
… with the following exception:

Secondly, if no possible solution was found, the only option left to get the index to work properly may be to allocate a new shard. But be aware that even if the lost node will come back afterwards, the new shard will just overwrite it because it is in a newer state.
You can allocate a new shard with the _cluster/reroute API. Here we allocate one for the test index on the node-1 that operates correctly. Notice you have to explicitly accept data loss:
curl --request POST "localhost:9200/_cluster/reroute?pretty" \
--header "Content-Type: application/json" \
--data-raw '{
   "commands" : [
       {
         "allocate_empty_primary" : {
               "index" : "test",
               "shard" : 1,
               "node" : "node-1",
               "accept_data_loss" : "true"
         }
       }
   ]
}'
Afterward, you should no longer experience timeouts during indexing.
Finally, you can stop any of the other nodes that were started.
sudo systemctl stop elasticsearch-node-2.service
To make sure we’re not left with lingering issues we introduced, we’re going to restore all of our original indices that we backed up earlier. But before we can do that, we need to do some cleaning-up.
First, we need to make sure that the repository path is registered again in the elasticsearch.yml as we’ve done some changes to it during the exercise. Go ahead and reference your stored config file that you created at the start of the lesson:.
sudo vim /etc/elasticsearch/elasticsearch.yml
path.repo: ["/home/student/backups"]
After that’s done, we can restart our main node:
sudo systemctl restart elasticsearch.service
Then we can re-register our repository again to make sure it’s ready to provide the backup data:
curl --request PUT localhost:9200/_snapshot/backup-repo \
--header "Content-Type: application/json" \
--data-raw '{
"type": "fs",
"settings": {
      "location": "/home/student/backups/backup-repo"
  }
}'
You can check the available snapshots in the repository with a simple _cat request to our back-up repo and we should see our snapshot-1 waiting to be restored:
curl localhost:9200/_cat/snapshots/backup-repo
Now, to prevent any writes during the restore process we need to make sure all of our indices are closed:
curl --request POST localhost:9200/_all/_close
Finally we can restore our backup:
curl --request POST localhost:9200/_snapshot/backup-repo/snapshot-1/_restore
After a few seconds, if you check your indices you should see all of the original data back in place:
curl localhost:9200/_cat/indices
Great! Now that you’re armed with foundational knowledge and various commands on troubleshooting your Elasticsearch cluster, the last piece of advice is to stay positive, even when things are not working out. It’s part of and parcel to being an Elasticsearch engineer.

The widespread adoption of Agile methodologies in recent years has allowed organizations to significantly increase their ability to push out more high quality software. The new…

When discussing observability pricing models, there are three dimensions that must be considered The first, Cost per Unit, is an easy-to-understand metric, but in practice it…

As data keeps growing at incredible rates, it’s becoming increasingly difficult to store and monitor at a reasonable cost leaving you to cherry-pick which data to…
