Familiar errors are those Error and Critical logs you already “know” and ignore, or they are waiting on some future list you have to clean them up. The problem with these known errors is that they create noise that hides real unknown errors and makes the system monitoring a lot more complicated.
Coralogix’s New Error and Critical Logs Anomaly leverages our ability to separate different logs into their original templates to alert our users in case a new Error / Critical log occurred in their system.
After 5 days of learning all the system’s logs and flows, Coralogix starts to send a daily digest with all the new errors and critical logs that occurred in the system for the first time in the past 2 weeks and a list of the top 10 errors for the past day.
The most common use case for this feature is for our customers to verify a new deployment did not cause any new Errors/Exceptions/Critical logs without investing a single minute. All they have to do is simply wait for the daily digest email the day after the upgrade and understand the deployment status.
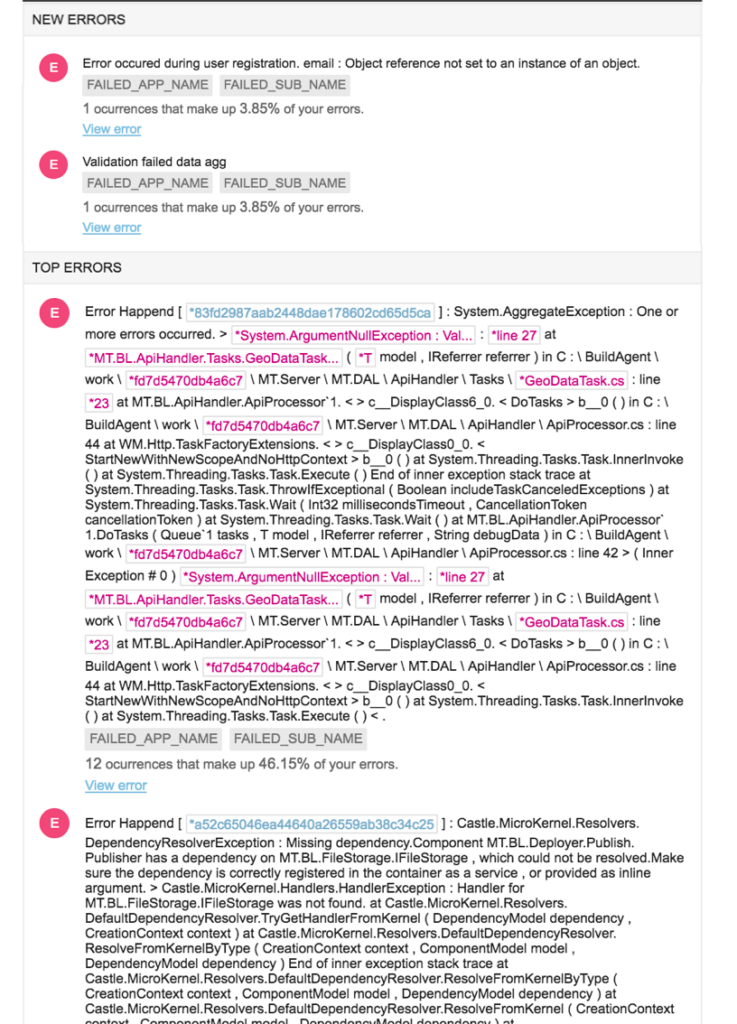
Each Coralogix user will get the following mail on a daily basis.
As you can see, the email has the date of the digested day, a link to view all the lists in a single aggregated view, the list of the new Error and Critical logs plus their application and subsystem. And a link to each one of the logs to be viewed separately on Coralogix’s interface.
Sign up to Coralogix now and enjoy a whole new world of proactive monitoring and better version delivery.
On this page
Live Webinar
Next-Level O11y: Why Every DevOps Team Needs a RUM Strategy
 Oh no!We didn’t find anything for “”,