Why index when you can analyze?
In-stream analysis & alerting
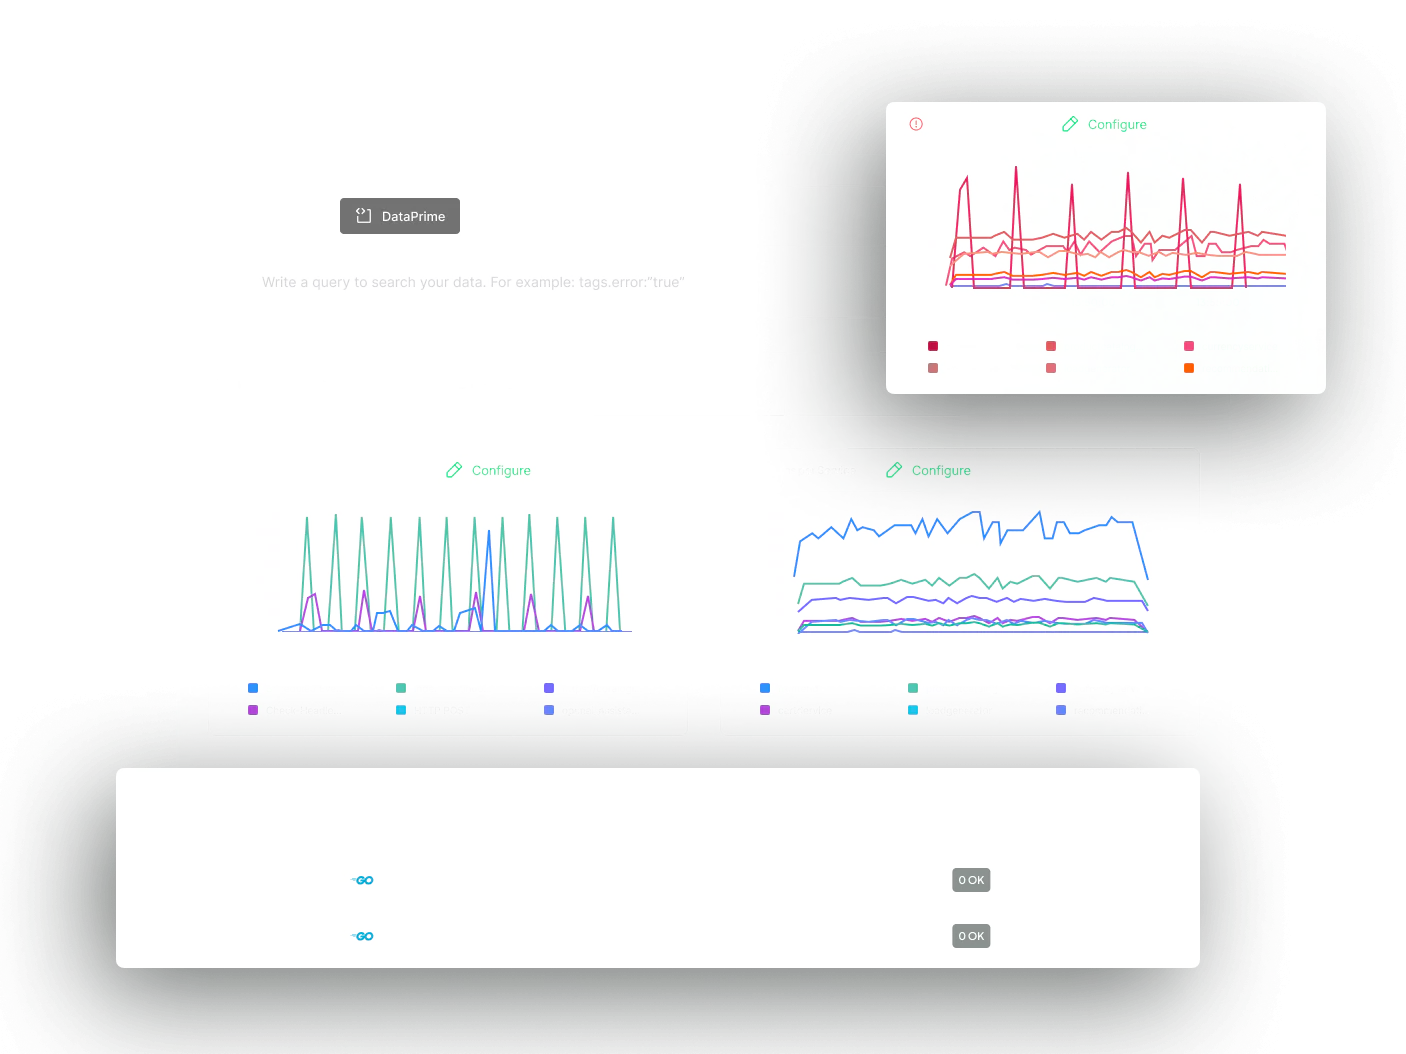
With Streama©, analyze logs, metrics, traces, and security events as they’re ingested. No indexing delays, no storage overhead.

An elegant solution to high performance, high volume observability

Catch issues instantly
In-stream processing removes indexing latency, triggers alarms faster, updates dashboards quickly, and makes data available instantly.

One alert, every data type
Define stateful alarms around logs, metrics & traces, and correlate events from your front end to your database.

Petabyte scale
Streama© scales elegantly, keeping costs down and latencies low for billions of logs, metrics, and spans a day.
Deliver instant intelligence for any kind of data
Insights without the storage delays
Analyze logs, metrics, and traces in motion—no indexing needed. Streama© brings the full power of a cutting edge observability stack to the realm of in-stream processing, removing storage dependencies, cutting processing time, driving down costs, and preserving true ownership of your data.
In-stream decision making
Don’t wait for indexing to make decisions about data routing or transformation. Transform logs & spans into metrics, trigger alarms, update dashboards, train machine learning models and more. No need to rely on storage or indexing, drastically cut your cost per GB.
One pipeline, simple correlation
Streama© processes all data from any source through one streamlined pipeline, uncovering insights through unified correlation. Eliminate silos and surface critical insights that exist between your datapoints. Enrich telemetry with metadata, ML clustering, and external context to accelerate investigation and response.
Real-time insights, full-stack clarity
Stop waiting for indexed searches. Analyze every event in motion, detecting threats and anomalies in real-time.
Traditional platforms choke under pressure. Ensure uptime and zero data loss at any volume.
Analyze historical trends alongside real-time data, exposing patterns and stopping failures before they happen.
While legacy tools silo your data, Streama© unifies logs, metrics, and traces in one pipeline for instant, cross-stack visibility.
Scalable observability for your systems
In-stream analysis
Continuous, real-time monitoring of AI interactions, detecting risks and performance issues before they impact users.
Infinite retention
Archives all system logs indefinitely, enabling deep historical audits and preventing data gaps without ballooning storage costs.
DataPrime engine
Transforms any incoming data for advanced querying, revealing hidden patterns without manual preparation or complexity.
Remote, index-free querying
Enables rapid searches across your infrastructure data, eliminating indexing overhead and cutting operational expenses instantly.
