
Metrics that kill hallucinations
Full fidelity metrics at the resolution and cardinality that agents and engineers need to solve problems.
Open standards, fast queries, and a full audit trail

Open standards
PromQL, OTLP, and Prometheus remote_write in. Metrics stored in an open format, in object storage you own, so other tools read them without going through us.

High performance distributed querying
A distributed metrics query engine, built in Rust, parallelises huge queries into actionable segments, for scalable performance.

Governance and audit
See which metrics and queries are actually being used, then rewrite a metric, block it, or let fixed rules and Dynamic TCO do it for you.
What your engineers and your agents both need from a metric
Cardinality
Seriously high cardinality. Seriously.
Tens of millions of active time series out of the box. Put User ID, Session ID, and URL on the same series, and track what the business cares about.
Resolution
15 second resolution at no extra cost
Coralogix charges nothing extra for 15 second resolution. Every minute carries four data points instead of one, so your agents reason from full fidelity metrics and answer from evidence rather than guessing at what happened between samples.
Dynamic TCO for Metrics
Metrics that optimize based on usage
Dynamic TCO automatically routes metrics to historical tiers, for a huge reduction in cost without losing fidelity or access.
High availability
Simplify your metrics pipeline
Run high availability collectors side by side and point them all at Coralogix. Identical series are joined on arrival, so you get failover and dedupe without running Thanos or any other aggregation layer of your own.
Governance
Know what every metric costs before you pay for it
Every metric carries its own usage record: cardinality, dimensions, label variations, and which queries read it, how often, and from where. Block one in a click and restore it in another, or let Dynamic TCO move unqueried series to a cheaper tier and bring them back on the first read.
Agents
Built for agents
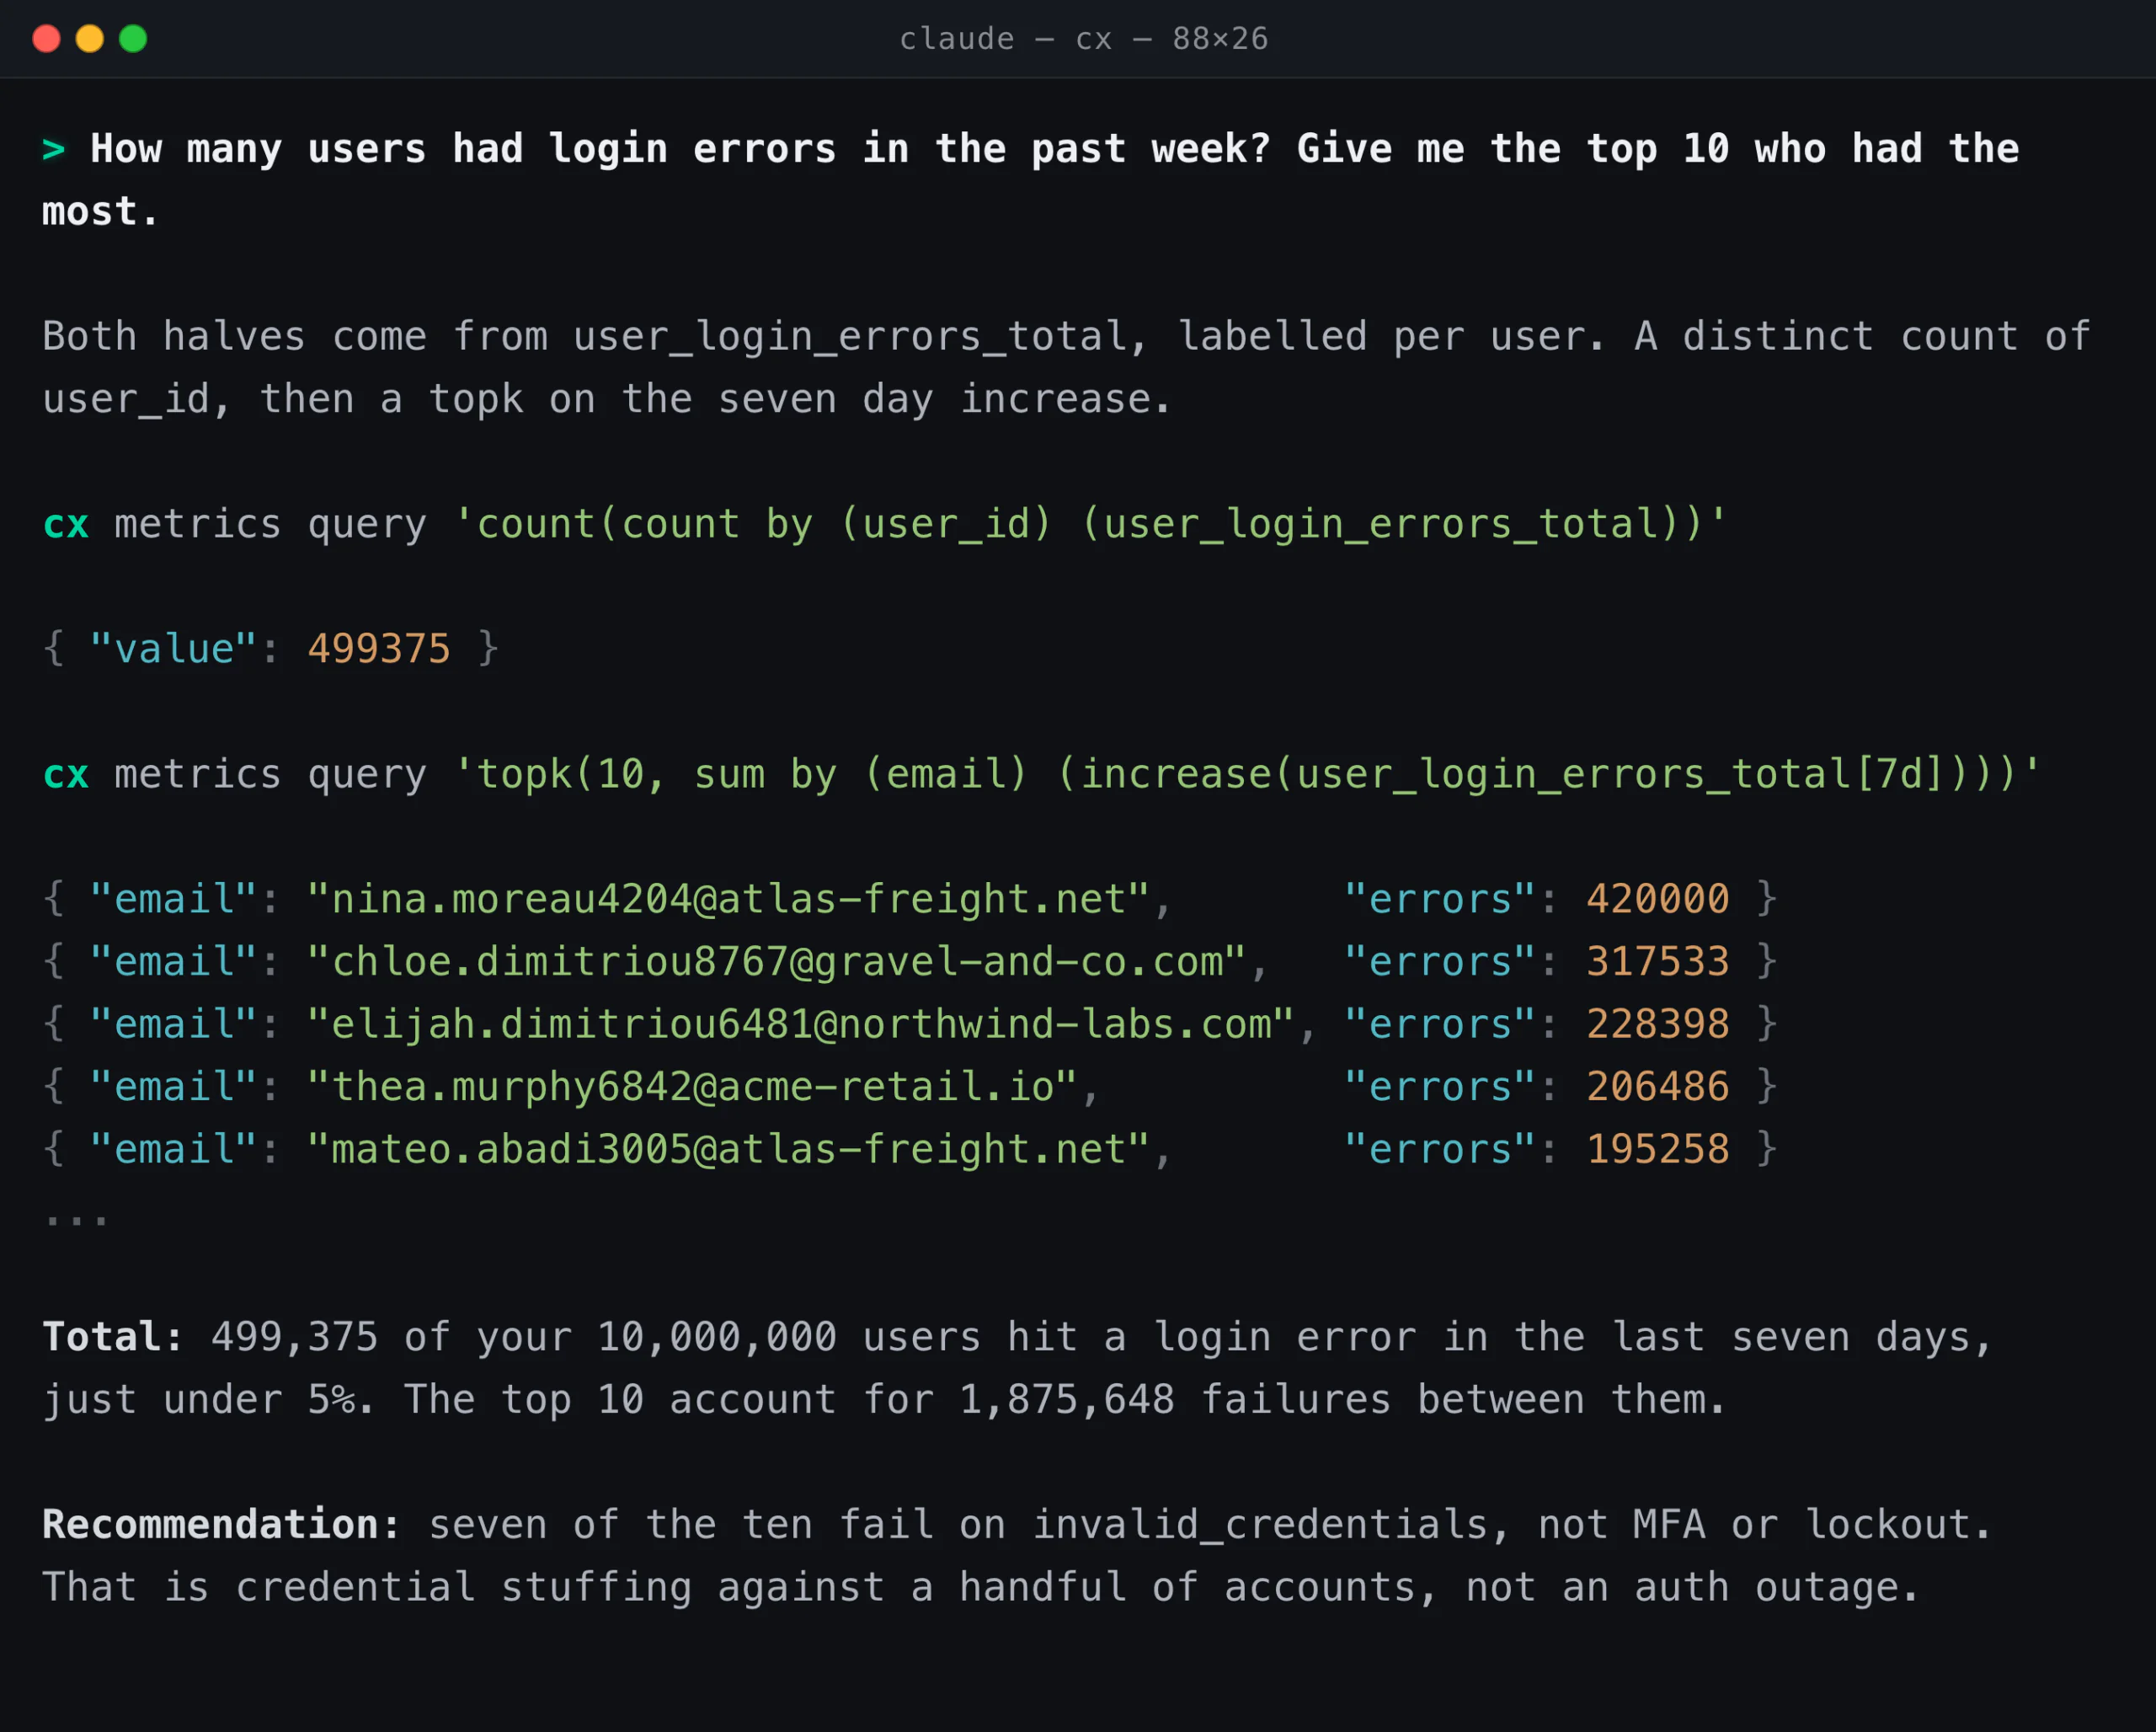
The same metrics that power your dashboards feed autonomous investigation. An agent queries the full series through PromQL, the CLI, or the API, and works from every data point rather than a sample.
 Billable unit
What is an active time series?
One series, counted once in a rolling 60 minute window, however often it reports. Send full fidelity metrics and pay only for your true cardinality.
See what you send, and decide what it costs
Usage, cardinality, dimensions and label variations, for every metric you send.
Which queries read a metric, how often, and from where: dashboards, alerts, recording rules, or the API.
Every metric ranked against your quota, blocked in one click and restored in another.
Series nobody queries move to a cheaper tier on their own, and come back in full on the next read.
Full-fidelity metrics
Give your agents metrics they can reason from
Full resolution and full cardinality, billed only on the series that are genuinely unique.
Resolution at no extra cost
Active time series out of the box
Your existing queries, unchanged
