
Fast, scalable app monitoring
Application Performance Monitoring (APM)
Get real-time visibility with OTel-native APM – no blind spots, no vendor lock-in, no wasted spend.
Everything your APM should’ve been from the start
The only way to truly secure your AI agents

Open-source
advantage
Escape vendor lock-in with 100% OpenTelemetry. Full control, no compromises.

Unified
visibility
Connect traces, logs, and infrastructure data in one unified platform.

Real-time
answers
Monitor system health and SLOs in real time—no indexing delays, no wasted time.
Connect every layer of data to fix what actually matters
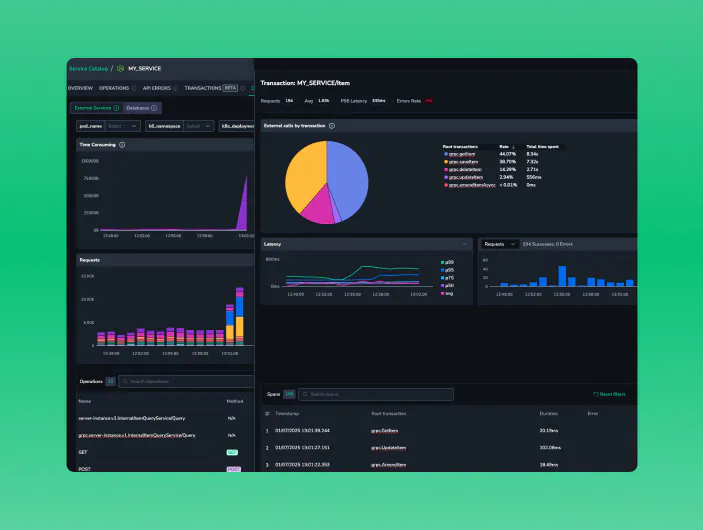
Service catalog
Take control of your services
Get real-time visibility into service health, dependencies, and errors using custom dimensions to filter and surface critical issues fast. Proactively track SLOs and error budgets to prevent failures.
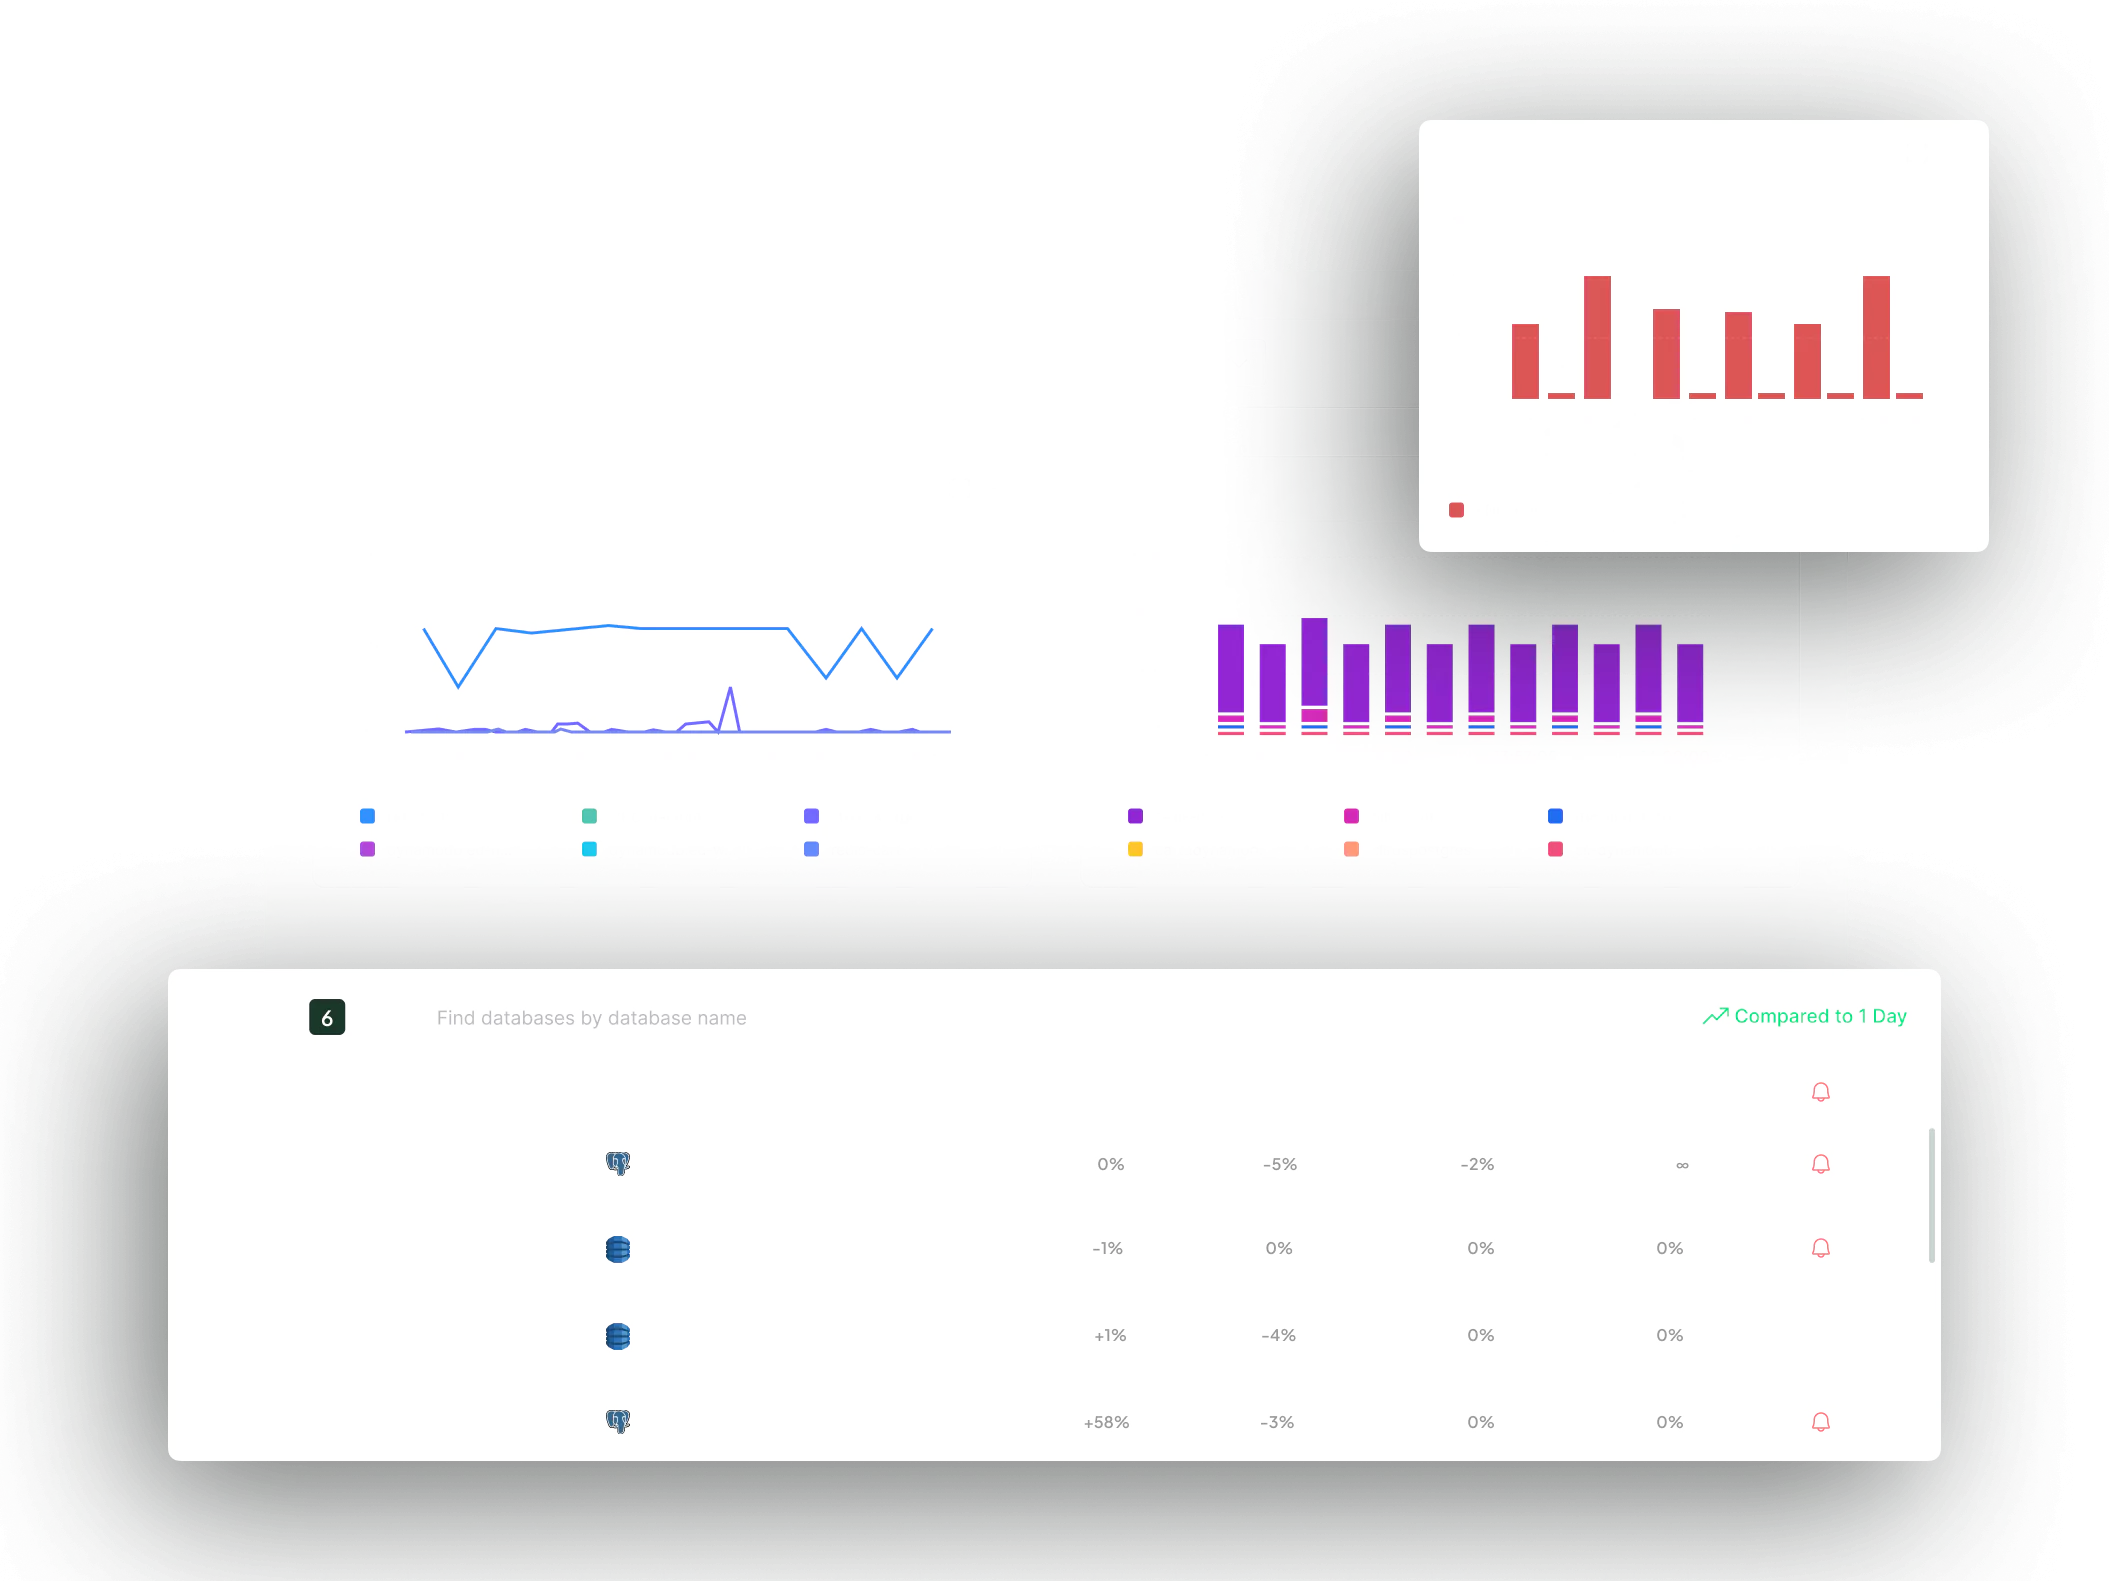
Database monitoring
Eliminate database bottlenecks before they break your app
Identify slow queries, overloaded databases, and the services causing issues—all in real time. Drill down to the trace level to investigate failures and resolve root causes quickly.
Service map
See every service and dependency in real time
Automatically visualize service interactions as they happen. Link logs to corresponding traces to surface root causes in seconds and understand the full impact across your entire system.
Serverless APM
Know exactly what’s happening inside your serverless stack
Track every function, trigger, and execution instantly. Correlate errors, invocations, and performance across your serverless environment to pinpoint failures and optimize faster.
Continuous profiling
Accelerate issue resolution without slowing production
Debug faster, improve application performance, and lower your cloud costs—operating in a predictable and safe way, without slowing down production.
Dependencies
For fast, accurate tracking
Automatically track the connections between every service, database and 3rd party API. When something goes wrong, Coralogix Dependencies tells you what happened, why it happened, and what is the impact.
SLO management
One place to manage all your objectives
Great engineering starts with Service Level Objectives. Define and track excellence with your telemetry.
Read More About Application Performance Monitoring
13 Best Application Performance Monitoring Tools for 2026
A latency spike at peak traffic can pull three on-call engineers into an hour-long bridge...
Application Performance Monitoring: Components, Metrics, and Practices
Why Is APM Important? The primary purpose of application performance monitoring is to provide real-time...
Application Logging Best Practices: A Field Guide for 2026
The fastest postmortems usually trace back to one small thing: a log line that already...